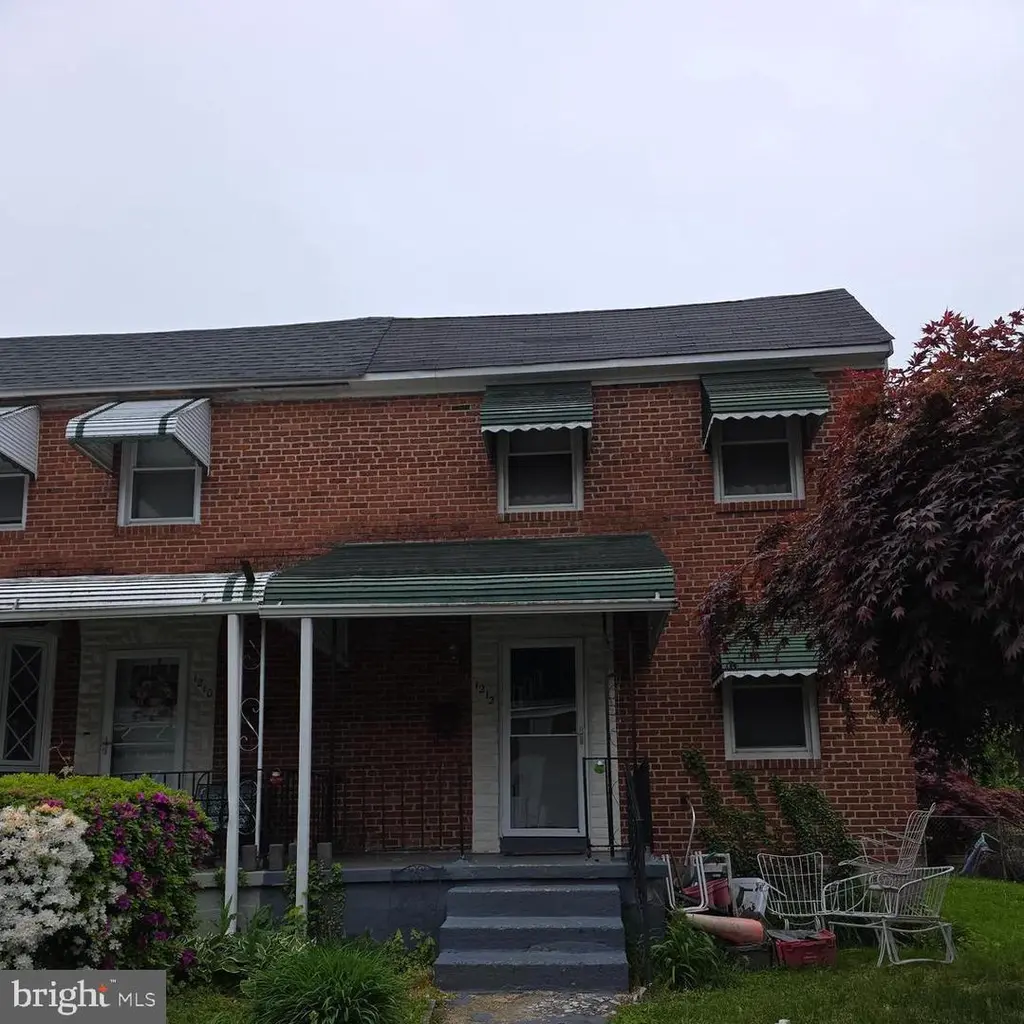
1212 Kevin Rd · Baltimore, MD
Flood risk 1/10 · Minimal
- FEMA flood zone
- X (unshaded)
- Chance of flooding over 30 yrs
- 0.0%
- Est. flood insurance / yr
- $473 – $860
Fire risk 2/10 · Minimal
- Est. fire insurance / yr
- $755 – $1,403
Heat risk 6/10 · Moderate
- Hot days now (above 103°F)
- 7 days/yr
- Hot days in 30 yrs
- 15 days/yr
Wind risk 5/10 · Moderate
- Chance of severe wind over 30 yrs
- 24.0%
Air-quality risk 3/10 · Minor
- Unhealthy air days now
- 3 days/yr
- Unhealthy air days in 30 yrs
- 4 days/yr
Risk factors via First Street. Map © Google.
Why this score? — see what drove the B+ grade
The composite is a weighted blend of 9 inputs, each scored 0–100. Each bar is that input's sub-score; the figure is the points it added to the 100-point composite (weight × sub-score).
- Cash flow +30.0/30.0
- ARV discount +15.0/15.0
- DSCR +10.0/10.0
- 1% rule +9.1/10.0
- Rent growth +3.8/5.0
- Livability +3.8/5.0
- Condition / age +2.5/5.0
- Schools +1.0/10.0
- Appreciation +0.0/10.0
$130,000
🖨 Deal sheet 📄 Offer letter ✓ Due diligence
Listing remarks
Estate Sale Opportunity! Spacious end-of-group rowhome with a fenced rear yard and a newer furnace already in place. This property is being sold strictly As-Is by the Estate and offers tremendous potential for investors, or buyers looking to add value. Bring your vision and creativity to transform this home into something special. Great investment opportunity with plenty of upside!
Key facts
- End-of-group rowhome
- Newer furnace
- Fenced rear yard
Tags
Property features AI
Finance
- Other: Ownership interest: Ground rent
- Financial info: Ground rent payment: $96 semi-annually; Income/expense note: Annual ground rent
Exterior
- Parking: On-street parking
- Utilities: Public water; Public sewer (no septic)
- Home design: End of Row/Townhouse
- Construction: Brick construction; Permanent foundation; Above-grade and below-grade structures
- Exterior features: End-of-row townhouse; Ground rent exists (paid semi-annually)
Interior
- Kitchen: Stove; Refrigerator
- Bedrooms: Three bedrooms on the upper level
- Bathrooms: One full bathroom on the upper level
- Heating & cooling: Forced air heating (natural gas); Cooling: Other (natural gas fuel); Natural gas hot water
- Interior features: Full basement, partially finished; Living area per assessor
Neighborhood map
What this means for you Summary
Snapshot
- This is a 3-bed/1.0-bath townhouse listed at $130k.
Deal economics
- At list price, monthly cash flow is $493 ($6k/yr) — positive.
- The deal already cash-flows at list — no discount required.
- Meets the 1% rule at list price ($2k rent vs $130k).
- Recommended offer: $128k (1.5% below list) — sets the bar for market timing.
- Cap rate 10.8% vs local median 6.0% in Baltimore — top-decile yield for the area; either an underpriced asset or a hidden risk that comps aren't pricing in. Stress-test before assuming the spread holds.
Location & tenants
- Location reads 76/100 on livability (#90 in MD, #3,396 nationally) — a middle-class / working-renter tenant base. Strengths: amenities A+, commute A+, housing A+; Watch: schools D, crime F.
- Baltimore City Public Schools (urban): math 7% / reading 16% proficiency, ranked #24 of 24 in MD (top 100%) — low school quality limits family demand, transient renter base, plan for 1-2y turnover; 79% free/reduced lunch — lower-income household profile, screen leases tightly.
- Market conditions: Rents rising fast (+5.4%/yr); 252 active listings in the ZIP; 40 comparable units currently listed for rent nearby; rentals at typical pace (median 24d on market — plan ~3-4 weeks tenant-placement turnaround); 42% of comp listings sitting > 30 days — soft ceiling on asking rent; 1,273 units permitted in Baltimore city in 2024 (1,104 in 5+ unit buildings).
- This rent runs 37% of the median local income ($60k/yr) — at the standard rent-burdened threshold; future hikes will face affordability resistance.
Forward outlook
- Local home prices are declining (-3.0%/yr); year-one equity from $899 of loan paydown is wiped out by about $4k of value loss. Plan a longer hold.
- Baltimore County population projected to shrink 4% by 2050 — rents likely to lag national; underwrite the cash flow, not the appreciation.
- At projected returns (-3.0% appreciation + 5.4% rent growth), your $36k cash investment doubles in ~7 years — after that, you're playing with house money.
Negotiation context
- It's been on market 23 days — a 2% lower offer ($128k) is reasonable based on typical stale-listing flexibility.
- Current owner paid $80k; list at $130k implies a 64% gain — meaningful room to come down on a strong offer.
Risks & watch-outs
- Watch-outs: built in 1951 — expect roof / HVAC / electrical / plumbing capex.
- Climate carrying-cost: moderate wind risk, 24% chance of damaging wind over 30y; extreme-heat days projected 7→15/yr by 2055 (HVAC capex compounding) — expect insurance premiums to compound above CPI over the hold.
Questions for the listing agent
- Built in 1951 — when were the roof, HVAC, electrical panel, plumbing, and water heater last replaced?
- Is there a deadline driving the sale (1031 exchange, divorce, estate, relocation)? That informs how much negotiation room exists.
- Schools are D-rated, which usually means shorter tenancies and higher turnover. Who's the typical renter profile here, and what's been the actual vacancy rate?
- Crime grade is F in this area — have there been break-ins, vandalism, or insurance claims at this property in the last 3 years? What carrier currently insures it and at what premium?
- What's the average days-on-market for RENTAL listings here right now (not sales)? A rising rental-DOM trend means longer vacancies and softer asking-rent achievability than the comps imply.
- What's the recent tenant-quality profile in this submarket — average credit score on applications, eviction rate, late-payment / NSF rate, and stable-employment percentage? A property-management company in the area should have these aggregated.
- How much new for-sale + rental construction is in the pipeline within 1–3 miles? Heavy new supply typically softens prices + rents 12–24 months out; constrained supply supports both.
Investment metrics
- 1% rule
- 1.41% ✓
- Cap rate
- 10.84%
- Cash-on-cash
- 16.24%
- DSCR
- 1.72
- GRM
- 5.9
CMA / ARV
- ARV (on-the-fly)
- $155,904
- Comps found
- 12
Show comp detail 12 sales within ~0.75 mi
| Address | Dist | Beds/Ba | Sqft | Sold | Price | $/sf | Match |
|---|---|---|---|---|---|---|---|
| 1244 N Augusta Ave | 0.32mi | 3/1.5 | 1,408 (+5%) | 3mo | $195,000 | $138 | 73 |
| 1007 Wildwood Pkwy | 0.42mi | 3/1.0 | 1,216 (-10%) | 2mo | $111,100 | $91 | 63 |
| 1000 Mount Holly St | 0.59mi | 3/1.5 | 1,290 (-4%) | 1mo | $93,000 | $72 | 63 |
| 4105 Flowerton Rd | 0.36mi | 2/2.0 (-1) | 1,260 (-6%) | 2mo | $119,990 | $95 | 62 |
| 3821 Stokes Dr | 0.55mi | 3/2.0 | 1,254 (-7%) | 1mo | $145,000 | $116 | 58 |
| 3707 Colborne Rd | 0.65mi | 3/2.0 | 1,400 (+4%) | 1mo | $220,000 | $157 | 58 |
| 1226 N Augusta Ave | 0.32mi | 3/2.0 | 1,536 (+14%) | 0mo | $212,000 | $138 | 57 |
| 1215 N Augusta Ave | 0.34mi | 3/1.5 | 1,536 (+14%) | 2mo | $138,000 | $90 | 56 |
| 1007 Mount Holly St | 0.61mi | 4/2.0 (+1) | 1,290 (-4%) | 2mo | $210,000 | $163 | 54 |
| 3806 Rokeby Rd | 0.57mi | 3/1.0 | 1,160 (-14%) | 2mo | $120,000 | $103 | 49 |
| 509 Normandy Ave | 0.68mi | 4/2.5 (+1) | 1,458 (+8%) | 1mo | $212,000 | $145 | 42 |
| 3716 Edmondson Ave | 0.73mi | 4/1.0 (+1) | 1,512 (+12%) | 2mo | $130,000 | $86 | 38 |
Match score weights: distance 35% · size 25% · config 20% · recency 20%. Top-matched comps best support the ARV.
Projected returns pro-forma
-3.0% appreciation · 5.38% rent growth · sell at horizon
- IRR
- 10.1%
- Equity multiple
- 1.41×
- Total profit
- $14,881
- Equity at exit
- $19,383
- IRR
- 21.1%
- Equity multiple
- 3.01×
- Total profit
- $73,040
- Equity at exit
- $11,240
Cash invested: $36,400 (down + closing). Projections, not guarantees.
Landlord ↔ Tenant lean methodology
- Overall (CITY)
- 12 Strongly Tenant-Friendly
- State Maryland
- 27 Tenant-Leaning · D+14
- County
- — inherits STATE
- City Baltimore
- 12 Strongly Tenant-Friendly · D+58
ZIP-level market 21229
- Rents YoY
- 5.4%
- Active inventory
- 252
- Price-to-rent
- 5.9×
Monthly cashflow live
- Estimated rent
- $1,838 high interval (Pro) →
- Mortgage (P&I)
- −$682
- Tax from tax record
- −$224 /mo · $2,684/yr
- Insurance
- −$54
- HOA
- −$0
- Vacancy / Maint / Mgmt
- −$386
- Net cashflow
- $493
Break-even live
UW: 25.0% down · 7.5% · 30yr · 1.5% tax · 5.0% vac · 8.0% maint · 8.0% mgmt
Financing live
Cash to close
- Down payment
- $32,500
- Closing costs
- $3,900
- Reserves months
- —
- Total cash needed
- —
Loan-product check · same deal, 3 products live
Conventional
25% down · 7.5% · 30yr
- Down + closing
- —
- Monthly P&I
- —
- Monthly cashflow
- —
- DSCR
- —
- Eligible?
- —
Personal DTI + credit; lowest rate.
DSCR
20% down · 8.5% · 30yr
- Down + closing
- —
- Monthly P&I
- —
- Monthly cashflow
- —
- DSCR
- —
- Eligible?
- —
No personal income docs; deal must DSCR.
Hard money
10% down · 12.0% · 12mo
- Down + closing
- —
- Monthly P&I
- —
- Monthly cashflow
- —
- DSCR
- —
- Eligible?
- —
Short-term bridge; refi at stabilization.
Rent comps 40 comps
| Address | Beds | Baths | Sqft | Rent | $/sqft | DOM | Units | Dist |
|---|---|---|---|---|---|---|---|---|
| 917 Kevin Rd Baltimore, MD | 3.0 | 2.0 | 1151 | $1,795 | $1.56 | 2d | 1 | 0.18mi |
| 1216 N Augusta Ave Baltimore, MD | 3.0 | 1.0 | 1024 | $1,550 | $1.51 | 24d | 1 | 0.30mi |
| 4113 Mountwood Rd Baltimore, MD | 3.0 | 1.0 | 1520 | $1,795 | $1.18 | 43d | 1 | 0.35mi |
| 4103 Mountwood Rd Baltimore, MD | 3.0 | 2.0 | 1030 | $1,700 | $1.65 | 43d | 1 | 0.37mi |
| 3935 Stokes Dr #1 Baltimore, MD | 2.0 | 1.0 | 1150 | $1,400 | $1.22 | 43d | 1 | 0.46mi |
| 4020 Gelston Dr Baltimore, MD | 3.0 | 2.0 | 1270 | $1,875 | $1.48 | 43d | 1 | 0.47mi |
| 4520 Scarlet Oak Ln Baltimore, MD | 2.0 | 1.0 | 1025 | $1,500 | $1.46 | 43d | 1 | 0.52mi |
| 3712 Gelston Dr Baltimore, MD | 3.0 | 2.0 | 1250 | $2,500 | $2.00 | 24d | 1 | 0.66mi |
| 409 Normandy Ave Baltimore, MD | 4.0 | 1.0 | 1640 | $1,500 | $0.91 | 24d | 1 | 0.71mi |
| 111 Upmanor Rd Baltimore, MD | 3.0 | 1.5 | 1224 | $2,163 | $1.77 | 43d | 1 | 0.76mi |
| 623 N Grantley St Baltimore, MD | 4.0 | 2.0 | 1250 | $2,000 | $1.60 | 24d | 1 | 0.79mi |
| 730 Linnard St Unit 1 Baltimore, MD | 4.0 | 1.0 | 1360 | $1,750 | $1.29 | 24d | 1 | 0.83mi |
| 3709 Nortonia Rd #2 Baltimore, MD | 2.0 | 1.0 | 1289 | $1,450 | $1.12 | 18d | 1 | 0.84mi |
| 798 N Grantley St Baltimore, MD | 3.0 | 2.0 | 1360 | $2,295 | $1.69 | 24d | 1 | 0.85mi |
| 3706 W Saratoga St Unit 1 Baltimore, MD | 2.0 | 1.0 | 1540 | $1,350 | $0.88 | 43d | 1 | 0.85mi |
| 787 N Grantley St Baltimore, MD | 3.0 | 1.0 | 1116 | $1,575 | $1.41 | 24d | 1 | 0.86mi |
| 780 Linnard St Baltimore, MD | 3.0 | 2.0 | 1224 | $1,590 | $1.30 | 43d | 1 | 0.88mi |
| 3507 Edmondson Ave Baltimore, MD | 4.0 | 2.0 | 1428 | $2,300 | $1.61 | 43d | 1 | 0.89mi |
| 3423 Edmondson Ave Baltimore, MD | 2.0 | 1.5 | 1400 | $1,710 | $1.22 | 43d | 1 | 0.94mi |
| 219 Atholgate Ln Baltimore, MD | 1.0–3.0 | 1.0–1.5 | 814 | $1,500 | $1.84 | 3d | 2 | 0.95mi |
| 4601 Pen Lucy Rd Unit 4718-F Baltimore, MD | 2.0 | 1.0 | 879 | $1,225 | $1.39 | 2d | 1 | 0.95mi |
| 3607 W Lexington St Baltimore, MD | 3.0 | 2.0 | 1050 | $1,895 | $1.80 | 4d | 1 | 0.96mi |
| 405 N Edgewood St Baltimore, MD | 4.0 | 2.0 | 1408 | $2,950 | $2.10 | 4d | 1 | 0.97mi |
| 202 N Edgewood St Baltimore, MD | 3.0 | 2.0 | 1710 | $2,250 | $1.32 | 24d | 1 | 0.99mi |
| 5006 Windsor Mill Rd Baltimore, MD | 1.0–3.0 | 1.0–2.0 | 776 | $1,899 | $2.45 | 2d | 18 | 1.00mi |
| 2103 Chelsea Ter Unit 1 Baltimore, MD | 2.0 | 2.0 | 1500 | $2,200 | $1.47 | 14d | 1 | 1.02mi |
| 2103 Chelsea Ter Unit 2 Baltimore, MD | 3.0 | 1.5 | 1500 | $2,100 | $1.40 | 14d | 1 | 1.02mi |
| 2220 Lyndhurst Ave Unit 1 Baltimore, MD | 2.0 | 1.0 | 900 | $1,175 | $1.31 | 24d | 1 | 1.05mi |
| 3309 Brighton St Baltimore, MD | 3.0 | 1.0 | 1134 | $1,700 | $1.50 | 43d | 1 | 1.07mi |
| 117 Collins Ave Baltimore, MD | 3.0 | 3.0 | 1617 | $2,350 | $1.45 | 43d | 1 | 1.08mi |
| 3238 Westmont Ave Baltimore, MD | 3.0 | 1.0 | 1280 | $1,600 | $1.25 | 43d | 1 | 1.08mi |
| 2 S Tremont Rd Baltimore, MD | 3.0 | 2.0 | 1450 | $1,800 | $1.24 | 11d | 1 | 1.10mi |
| 2 S Tremont Rd Baltimore, MD | 3.0 | 2.0 | 1450 | $1,800 | $1.24 | 24d | 1 | 1.10mi |
| 3514 Clifton Ave Baltimore, MD | 2.0 | 1.0 | 925 | $1,199 | $1.30 | 43d | 1 | 1.11mi |
| 3514 Clifton Ave Unit 21 Baltimore, MD | 2.0 | 1.0 | 925 | $1,150 | $1.24 | 43d | 1 | 1.11mi |
| 5136 Oaklawn Rd Gwynn Oak, MD | 1.0–3.0 | 1.0 | 896 | $1,710 | $1.91 | 2d | 22 | 1.11mi |
| 19 S Tremont Rd Baltimore, MD | 3.0 | 1.0 | 1350 | $1,850 | $1.37 | 43d | 1 | 1.12mi |
| 4018 Massachusetts Ave Baltimore, MD | 3.0 | 1.0 | 1050 | $1,400 | $1.33 | 24d | 1 | 1.14mi |
| 3904 Gwynns Falls Pkwy Baltimore, MD | 3.0 | 2.0 | 1772 | $2,600 | $1.47 | 43d | 1 | 1.16mi |
| 1513 N Ellamont St Baltimore, MD | 3.0 | 1.0 | 1700 | $1,700 | $1.00 | 24d | 1 | 1.17mi |
Listing history 16 events
-
2026-06-18days on market $130,000 Active 23 DOM
-
2026-06-17days on market $130,000 Active 22 DOM
-
2026-06-16days on market $130,000 Active 21 DOM
-
2026-06-15days on market $130,000 Active 20 DOM
-
2026-06-13days on market $130,000 Active 18 DOM
-
2026-06-09days on market $130,000 Active 14 DOM
-
2026-06-08days on market $130,000 Active 13 DOM
-
2026-06-07days on market $130,000 Active 12 DOM
-
2026-06-04days on market $130,000 Active 9 DOM
-
2026-06-03days on market $130,000 Active 8 DOM
-
2026-06-02days on market $130,000 Active 7 DOM
-
2026-06-01days on market $130,000 Active 6 DOM
-
2026-05-31days on market $130,000 Active 5 DOM
-
2026-05-26$130,000 Active
-
2021-10-07soldstatus $79,506
-
1985-11-08soldstatus $43,000
ⓘ Source: listings_history table (triggers on properties + properties_extension) + one-shot
backfill from property_details.listing_events for pre-trigger history.
Tax reassessment forecast MD · Partial reset (capped growth)
- Current annual tax
- $2,684 · $224/mo
- Projected year-2 tax
- $2,684 · $224/mo
- Expected delta
- $0/yr ($0/mo · 0.0%)
ⓘ Screening estimate from a state-policy table — verify with the county assessor before closing.
Climate risk First Street
- Flood 1/10 Low FEMA zone X (unshaded) · 0% chance over 30 yrs
- Wildfire 2/10 Low
- Heat 6/10 Major 7 d/yr ≥103°F today · 15 d/yr by 30 yrs out
- Wind 5/10 Major 24% chance of damaging wind over 30 yrs
- Air quality 3/10 Moderate 3 unhealthy d/yr today · 4 by 30 yrs out
Nearby sold comps map
Loading sold comps map…
Walkable amenities ~0.75 mi
Loading nearby amenities…
Taxation est. · year 1
- Rental income
- $22,059
- − Mortgage interest
- −$7,282
- − Property taxes
- −$2,684
- − Insurance
- −$650
- − Repairs & maintenance
- −$1,765
- − Management
- −$1,765
- − Depreciation
- −$3,782
- Taxable income
- $4,131
- Est. tax owed @ 24.0%
- −$992
- After-tax cash flow
- $4,920/yr
For passive investors: Depreciation is non-cash, so a rental often shows a tax loss while cash-flowing — sheltering income. Rental losses are passive: they offset passive income freely, and up to $25,000/yr can offset ordinary (W-2) income if you actively participate and your MAGI is under $100k (phasing out to $0 by $150k); unused losses carry forward. On sale, claimed depreciation is recaptured at up to 25%, and gains may owe capital-gains tax (a 1031 exchange can defer both). Figures are a year-1 estimate at your 24.0% rate — not tax advice; consult a CPA.
Schools (NCES district)
- District
- Baltimore City Public Schools
- NCES district ID
- 2400090
- Math proficiency
- 7% ▼ -9.00%
- Reading proficiency
- 16% ▼ -5.00%
- Median HH income
- $42,108
- Composite
- 10.08/100
- National rank
- #9805
- State rank
- #24 of 24 in MD
Livability — Baltimore
- Score
- 76/100
- State rank
- #90
- US rank
- #3396
Category grades
Schools grade is shown separately in the Schools card above.
Census & demographics
- Census place
- Baltimore, MD
- County
- Baltimore City · 558,601 people
- City population
- 588,727
- Metro
- Baltimore-Columbia-Towson, MD
- Population (ZIP)
- 46,679
- Household income
- $60,047
- Rent vs Own
- Severe rent burden
- 2776.0
Population outlook (Baltimore County) Hauer SSP2
- Today (2025)
- 624,249 people
- By 2030
- 621,541 · -0.4%
- By 2040
- 609,756 · -2.3%
- By 2050
- 597,249 · -4.3%
- By 2075
- 552,236 · -11.5%
- By 2100
- 513,934 · -17.7%
Race, ethnicity, and origin ACS 2023
- Neighborhood character
- Predominantly Black (73%)
- Race & ethnicity
- Black 73% White 15% Hispanic / Latino 6% Two or more races 4% Asian 3%
- Hispanic origin (detail)
- Common ancestry
- Lithuanian 1% Romanian 1% Serbian 1%
- Foreign-born
- 5% · Canada, Philippines
- Languages at home
- 91% English-only · Spanish 4% Other Indo-European 2% Other Asian/Pacific 1%
Political lean MEDSL · Baltimore
- 2024 margin
- Solid D (+73.0) · D 85.2% · R 12.2% · Other 2.6%
- 2008→2024 swing
- -2.5pp toward R · 2008: 75.5pp · 2024: 73.0pp
- All cycles
- 2024: D+73.0 2020: D+76.6 2016: D+74.6 2012: D+76.4 2008: D+75.5
Not yet ingested
- Civics
- —
Market trends
- HPI YoY
- ▼ -259.07%
- Current HPI
- 226.896
- Rent YoY
- ▲ 5.38%
- Metro
- Baltimore-Columbia-Towson, MD
- State GDP YoY
- ▲ 2.97%
- F500 in state
- 12
Industry mix (Fortune 500 HQ in MD)
| Industry | F500 HQs | Revenue |
|---|---|---|
| Aerospace / Defense | 1 | $71B |
|
||
| Utilities | 1 | $25B |
|
||
| Hotels | 1 | $24B |
|
||
| Consumer Goods | 1 | $7B |
|
||
| Real Estate | 1 | $6B |
|
||
| Chemicals | 1 | $2B |
|
||
Price history
+202.3% since first listed3 events — show timeline
- 2026-05-26 Listed $130,000 BRIGHT MLS
- 2021-10-07 Sold (Public Records) $79,506 Public Records
- 1985-11-08 Sold (Public Records) $43,000 Public Records
Property tax history
+0.3%/yrLatest (2025): $2,684 · +5.3% YoY. Source: county tax records.
Cash-flow waterfall
monthlySold comps — $/sqft
last 12 mo · ≤1 miLoading sold comps…