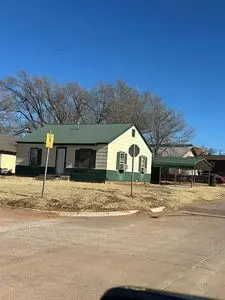
201 S Cearlock Ave · Cheyenne, OK
Flood risk 1/10 · Minimal
- FEMA flood zone
- X (unshaded)
- Chance of flooding over 30 yrs
- 0.0%
- Est. flood insurance / yr
- $507 – $1,088
Fire risk 8/10 · Major
- Est. fire insurance / yr
- $2,463 – $4,575
Heat risk 6/10 · Moderate
- Hot days now (above 104°F)
- 7 days/yr
- Hot days in 30 yrs
- 21 days/yr
Wind risk 2/10 · Minimal
- Chance of severe wind over 30 yrs
- 2.0%
Air-quality risk 2/10 · Minimal
- Unhealthy air days now
- 1 days/yr
- Unhealthy air days in 30 yrs
- 1 days/yr
Risk factors via First Street. Map © Google.
Why this score? — see what drove the B+ grade
The composite is a weighted blend of 9 inputs, each scored 0–100. Each bar is that input's sub-score; the figure is the points it added to the 100-point composite (weight × sub-score).
- Cash flow +30.0/30.0
- 1% rule +10.0/10.0
- DSCR +10.0/10.0
- ARV discount +7.5/15.0
- Appreciation +5.0/10.0
- Schools +4.7/10.0
- Livability +3.5/5.0
- Rent growth +2.5/5.0
- Condition / age +2.2/5.0
$38,000
🖨 Deal sheet 📄 Offer letter ✓ Due diligence
Listing remarks
3-bedroom, 1.5-bath home (~1,100 sq ft) located on a corner lot with plenty of potential. Features: & acirc; & euro; & cent; Metal roof & acirc; & euro; & cent; Carport & acirc; & euro; & cent; 11 & acirc; & euro; & trade; x 11 & acirc; & euro; & trade; cellar (great for storage or storm shelter) & acirc; & euro; & cent; Functional layout with spacious bedrooms The home needs some repairs and updates but has great potential for the right buyer to make it their own or add value as an investment opportunity.
Key facts
- Metal roof
- Cellar
- Carport
Tags
Neighborhood map
What this means for you Summary
Snapshot
- This is a 3-bed/2.0-bath other listed at $38k. Condition is rated fair.
Deal economics
- At list price, monthly cash flow is $534 ($6k/yr) — positive.
- The deal already cash-flows at list — no discount required.
- Meets the 1% rule at list price ($1k rent vs $38k).
- Recommended offer: $37k (1.5% below list) — sets the bar for market timing.
Location & tenants
- Location reads 70/100 on livability (#43 in OK) — a middle-class / working-renter tenant base. Strengths: cost of living A+, housing A+, health & safety B; Watch: schools C-, employment D, crime F.
- Cheyenne (rural): math 60% / reading 45% proficiency, ranked #24 of 513 in OK (top 5%) — acceptable for families but not a draw, mixed tenant base, ~2y average lease.
- Market conditions: 6 active listings in the ZIP.
Forward outlook
- In year one you build about $1k of equity ($263 loan paydown + $1k appreciation (3.0% local appreciation)).
- Roger Mills County population projected at +12% by 2050 — modest demand growth; plan on rents tracking national, not racing it.
- At projected returns (3.0% appreciation + 3.0% rent growth), your $11k cash investment doubles in ~2 years — after that, you're playing with house money.
Negotiation context
- It's been on market 23 days — a 2% lower offer ($37k) is reasonable based on typical stale-listing flexibility.
Risks & watch-outs
- Climate carrying-cost: severe wildfire risk; extreme-heat days projected 7→21/yr by 2055 (HVAC capex compounding) — expect insurance premiums to compound above CPI over the hold.
Questions for the listing agent
- Have any recent inspections been done? Can we get a copy of the seller's disclosures and any deferred-maintenance estimates?
- Is there a deadline driving the sale (1031 exchange, divorce, estate, relocation)? That informs how much negotiation room exists.
- Crime grade is F in this area — have there been break-ins, vandalism, or insurance claims at this property in the last 3 years? What carrier currently insures it and at what premium?
- What's the average days-on-market for RENTAL listings here right now (not sales)? A rising rental-DOM trend means longer vacancies and softer asking-rent achievability than the comps imply.
- What's the recent tenant-quality profile in this submarket — average credit score on applications, eviction rate, late-payment / NSF rate, and stable-employment percentage? A property-management company in the area should have these aggregated.
- How much new for-sale + rental construction is in the pipeline within 1–3 miles? Heavy new supply typically softens prices + rents 12–24 months out; constrained supply supports both.
Investment metrics
- 1% rule
- 2.65% ✓
- Cap rate
- 23.16%
- Cash-on-cash
- 60.23%
- DSCR
- 3.68
- GRM
- 3.1
CMA / ARV
No comps found within radius.
Projected returns pro-forma
3.0% appreciation · 3.0% rent growth · sell at horizon
- IRR
- 65.1%
- Equity multiple
- 4.63×
- Total profit
- $38,605
- Equity at exit
- $17,086
- IRR
- 64.6%
- Equity multiple
- 9.44×
- Total profit
- $89,790
- Equity at exit
- $26,332
Cash invested: $10,640 (down + closing). Projections, not guarantees.
Landlord ↔ Tenant lean methodology
- Overall (STATE)
- 83 Strongly Landlord-Friendly
- State Oklahoma
- 83 Strongly Landlord-Friendly · R+20
- County
- — inherits STATE
- City
- — inherits STATE
ZIP-level market 73628
- Active inventory
- 6
- Price-to-rent
- 3.1×
Monthly cashflow live
- Estimated rent
- $1,008 medium interval (Pro) →
- Mortgage (P&I)
- −$199
- Tax est. 1.5%
- −$48 /mo · $570/yr
- Insurance
- −$16
- HOA
- −$0
- Vacancy / Maint / Mgmt
- −$212
- Net cashflow
- $534
Break-even live
UW: 25.0% down · 7.5% · 30yr · 1.5% tax · 5.0% vac · 8.0% maint · 8.0% mgmt
Financing live
Cash to close
- Down payment
- $9,500
- Closing costs
- $1,140
- Reserves months
- —
- Total cash needed
- —
Loan-product check · same deal, 3 products live
Conventional
25% down · 7.5% · 30yr
- Down + closing
- —
- Monthly P&I
- —
- Monthly cashflow
- —
- DSCR
- —
- Eligible?
- —
Personal DTI + credit; lowest rate.
DSCR
20% down · 8.5% · 30yr
- Down + closing
- —
- Monthly P&I
- —
- Monthly cashflow
- —
- DSCR
- —
- Eligible?
- —
No personal income docs; deal must DSCR.
Hard money
10% down · 12.0% · 12mo
- Down + closing
- —
- Monthly P&I
- —
- Monthly cashflow
- —
- DSCR
- —
- Eligible?
- —
Short-term bridge; refi at stabilization.
Listing history 15 events
-
2026-06-18days on market $38,000 Active 23 DOM
-
2026-06-17days on market $38,000 Active 22 DOM
-
2026-06-16days on market $38,000 Active 21 DOM
-
2026-06-15days on market $38,000 Active 20 DOM
-
2026-06-13days on market $38,000 Active 18 DOM
-
2026-06-12days on market $38,000 Active 17 DOM
-
2026-06-09days on market $38,000 Active 14 DOM
-
2026-06-08days on market $38,000 Active 13 DOM
-
2026-06-08days on market $38,000 Active 12 DOM
-
2026-06-07days on market $38,000 Active 11 DOM
-
2026-06-04days on market $38,000 Active 8 DOM
-
2026-06-02days on market $38,000 Active 7 DOM
-
2026-06-01days on market $38,000 Active 6 DOM
-
2026-05-31days on market $38,000 Active 5 DOM
-
2026-05-26$38,000 Active
ⓘ Source: listings_history table (triggers on properties + properties_extension) + one-shot
backfill from property_details.listing_events for pre-trigger history.
Climate risk First Street
- Flood 1/10 Low FEMA zone X (unshaded) · 0% chance over 30 yrs
- Wildfire 8/10 Severe
- Heat 6/10 Major 7 d/yr ≥104°F today · 21 d/yr by 30 yrs out
- Wind 2/10 Low 2% chance of damaging wind over 30 yrs
- Air quality 2/10 Low 1 unhealthy d/yr today · 1 by 30 yrs out
Nearby sold comps map
Loading sold comps map…
Walkable amenities ~0.75 mi
Loading nearby amenities…
Taxation est. · year 1
- Rental income
- $12,101
- − Mortgage interest
- −$2,129
- − Property taxes
- −$570
- − Insurance
- −$190
- − Repairs & maintenance
- −$968
- − Management
- −$968
- − Depreciation
- −$1,105
- Taxable income
- $6,171
- Est. tax owed @ 24.0%
- −$1,481
- After-tax cash flow
- $4,927/yr
For passive investors: Depreciation is non-cash, so a rental often shows a tax loss while cash-flowing — sheltering income. Rental losses are passive: they offset passive income freely, and up to $25,000/yr can offset ordinary (W-2) income if you actively participate and your MAGI is under $100k (phasing out to $0 by $150k); unused losses carry forward. On sale, claimed depreciation is recaptured at up to 25%, and gains may owe capital-gains tax (a 1031 exchange can defer both). Figures are a year-1 estimate at your 24.0% rate — not tax advice; consult a CPA.
Condition & rehab AI · 2 photos
This home requires significant repairs and updates, including a new roof and exterior painting, to improve its condition and value.
Repairs flagged
- Major roof — Signs of significant weathering and potential leaks
- Major exterior siding — Severe discoloration and wear
- Major landscaping — Overgrown and sparse, detracting from curb appeal
Value-add opportunities
- Both paint exterior walls — Fresh paint enhances curb appeal and home value
- Both repair roof — A new roof addresses a major issue and improves home value
- Both landscape and maintain — A well-maintained yard enhances curb appeal and property value
Renovation cost estimate screening
| Repair item | Severity | Est. cost |
|---|---|---|
| roof · Signs of significant weathering and potential leaks | Major | $15,000–50,000 |
| exterior siding · Severe discoloration and wear | Major | $15,000–50,000 |
| landscaping · Overgrown and sparse, detracting from curb appeal | Major | $15,000–50,000 |
| Total estimated repair cost · 3 items | $45,000–150,000 |
Value-add ROI direction
- Both paint exterior walls — Fresh paint enhances curb appeal and home value ↑
- Both repair roof — A new roof addresses a major issue and improves home value ↑
- Both landscape and maintain — A well-maintained yard enhances curb appeal and property value ↑
ⓘ Cost ranges are severity-bucket heuristics (US national rule-of-thumb). Get contractor quotes + a written scope before underwriting a rehab budget.
Schools (NCES district)
- District
- Cheyenne
- NCES district ID
- 4007500
- Math proficiency
- 60% ▬ 0.00%
- Reading proficiency
- 45% ▬ 0.00%
- Median HH income
- $53,914
- Composite
- 47.18/100
- National rank
- #5094
- State rank
- #24 of 513 in OK
Livability — Cheyenne
- Score
- 70/100
- State rank
- #43
- US rank
- #7953
Category grades
Schools grade is shown separately in the Schools card above.
Census & demographics
- Census place
- Cheyenne, OK
- Population (ZIP)
- 1,625
Population outlook (Roger Mills County) Hauer SSP2
- Today (2025)
- 3,962 people
- By 2030
- 4,064 · +2.6%
- By 2040
- 4,244 · +7.1%
- By 2050
- 4,426 · +11.7%
- By 2075
- 4,876 · +23.1%
- By 2100
- 5,027 · +26.9%
Race, ethnicity, and origin ACS 2023
- Neighborhood character
- Predominantly White (82%)
- Race & ethnicity
- White 82% Hispanic / Latino 8% Two or more races 7% Native American 3% Pacific Islander 1%
- Hispanic origin (detail)
- Mexican 8%
- Common ancestry
- Lithuanian 5% Slovak 2% Romanian 1%
- Foreign-born
- 3% · Canada
- Languages at home
- 97% English-only · Spanish 3% Other Asian/Pacific 1%
Political lean MEDSL · Roger Mills
- 2024 margin
- Solid R (+80.1) · D 9.2% · R 89.3% · Other 1.4%
- 2008→2024 swing
- -12.2pp toward R · 2008: -67.9pp · 2024: -80.1pp
- All cycles
- 2024: R+80.1 2020: R+79.7 2016: R+79.3 2012: R+67.5 2008: R+67.9
Not yet ingested
- Civics
- —
Market trends
- HPI YoY
- —
- Current HPI
- —
- Rent YoY
- —
- Metro
- —
- State GDP YoY
- ▲ 1.55%
- F500 in state
- 6
Industry mix (Fortune 500 HQ in OK)
| Industry | F500 HQs | Revenue |
|---|---|---|
| Energy | 3 | $48B |
|
||
Price history
1 event — show timeline
- 2026-05-26 Listed $38,000 FSBO.com
Cash-flow waterfall
monthlySold comps — $/sqft
last 12 mo · ≤1 miLoading sold comps…