304 Halifax Ln · Chelsea, AL
Flood risk 1/10 · Minimal
- FEMA flood zone
- X (unshaded)
- Chance of flooding over 30 yrs
- 0.0%
- Est. flood insurance / yr
- $507 – $1,088
Fire risk 5/10 · Moderate
- Est. fire insurance / yr
- $916 – $1,700
Heat risk 6/10 · Moderate
- Hot days now (above 107°F)
- 7 days/yr
- Hot days in 30 yrs
- 19 days/yr
Wind risk 6/10 · Moderate
- Chance of severe wind over 30 yrs
- 27.0%
Air-quality risk 3/10 · Minor
- Unhealthy air days now
- 3 days/yr
- Unhealthy air days in 30 yrs
- 4 days/yr
Risk factors via First Street. Map © Google.
Why this score? — see what drove the D grade
The composite is a weighted blend of 9 inputs, each scored 0–100. Each bar is that input's sub-score; the figure is the points it added to the 100-point composite (weight × sub-score).
- Cash flow +11.3/30.0
- ARV discount +9.6/15.0
- Condition / age +4.0/5.0
- Schools +3.9/10.0
- Livability +3.5/5.0
- 1% rule +3.4/10.0
- DSCR +3.3/10.0
- Rent growth +2.5/5.0
- Appreciation +0.0/10.0
$349,900
🖨 Deal sheet (PDF) 📄 Offer letter ✓ Due diligence
Listing remarks MLS
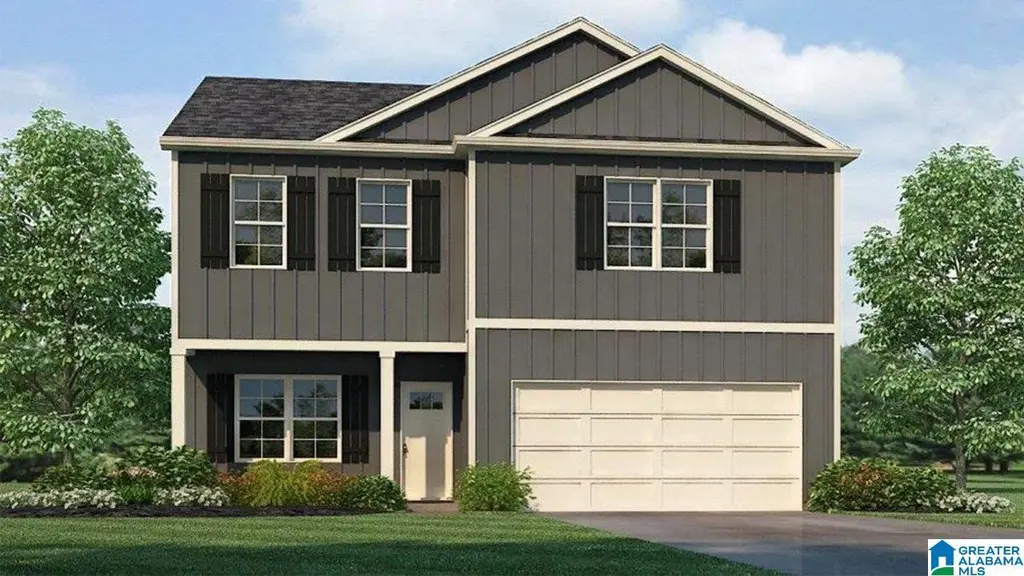
Ask about our interest rates, paid closing cost and easily added options. The Penwell is a two-story plan with 4 bedrooms and 2.5 bathrooms in 2,164 square feet. The main level features a flex room adjacent to the foyer, ideal for a formal dining room or home office. The gourmet kitchen has an oversized island for extra seating and a large pantry, and it opens to the dining area and a spacious living room. Bedroom One is on the second level and offers a private bathroom, double vanities and a large walk-in closet. There are 3 additional bedrooms, a full bathroom, and a walk-in laundry room. Quality materials and workmanship throughout, with superior attention to detail, plus a one-year builders warranty. Your new home also includes our smart home technology package!
Key facts
- Gourmet kitchen
- Large pantry
- Private bathroom
Tags
Neighborhood map
What this means for you Summary
Snapshot
- This is a 4-bed/2.5-bath single-family listed at $350k. Condition is rated good.
Deal economics
- At list price, monthly cash flow is $-126 ($-2k/yr) — negative.
- To cash-flow at today's rent, offer at most $332k (5.2% below list).
- To meet the 1% rule (rent ≥ 1% of price), the offer needs to be $295k (15.7% below list).
- Recommended offer: $295k (15.7% below list) — sets the bar for 1% rule.
- Cap rate 5.9% vs local median 4.1% in Chelsea — top-decile yield for the area; either an underpriced asset or a hidden risk that comps aren't pricing in. Stress-test before assuming the spread holds.
Location & tenants
- Location reads 69/100 on livability (#52 in AL) — a middle-class / working-renter tenant base. Strengths: crime A+, employment A+, housing A+; Watch: amenities F, commute F, health & safety F.
- Shelby County (suburban): math 30% / reading 58% proficiency, ranked #16 of 129 in AL (top 12%) — families likely to look elsewhere, expect single-tenant / working-renter base with shorter leases.
- Zoned schools: Forest Oaks Elementary School (math 44% / reading 63%, grade C, #99 of 627 statewide, top 16%, 683 students, 27% FRL); Chelsea Middle School (math 26% / reading 63%, grade D, #39 of 257 statewide, top 16%, 951 students, 28% FRL); Chelsea High School (math 43% / reading 42%, grade F, #27 of 305 statewide, top 9%, 1,400 students, 23% FRL) — zoned schools at 26% FRL track the district average.
- Market conditions: 292 active listings in the ZIP; 1 comparable units currently listed for rent nearby; 987 units permitted in Shelby County in 2024 (0 in 5+ unit buildings).
Forward outlook
- Local home prices are declining (-3.0%/yr); year-one equity from $2k of loan paydown is wiped out by about $10k of value loss. Plan a longer hold.
- Shelby County population projected at +23% by 2050 — long-run rental-demand tailwind backs the buy-and-hold thesis.
Negotiation context
- It's been on market 88 days — a 6% lower offer ($329k) is reasonable based on typical stale-listing flexibility.
Risks & watch-outs
- Climate carrying-cost: major wind risk, 27% chance of damaging wind over 30y; moderate wildfire risk; extreme-heat days projected 7→19/yr by 2055 (HVAC capex compounding) — expect insurance premiums to compound above CPI over the hold.
Questions for the listing agent
- What do current leases actually rent for vs. the listed asking? Can we see a recent rent roll and the last 12 months of T-12 income?
- It's been on market 88 days. Have you received any prior offers? Is the seller open to a 16% concession, seller financing, or rate buy-down credit?
- What does the HOA fee cover, when was the last increase, and are there any pending special assessments or reserve-fund shortfalls?
- Why hasn't it sold? Are there any deal-killer items the seller is aware of (foundation, flood, title, zoning, code violations)?
- Is there a deadline driving the sale (1031 exchange, divorce, estate, relocation)? That informs how much negotiation room exists.
- Schools are B-rated — typically a magnet for longer-tenancy family renters. What's the average tenant stay here, and is there a school-zone premium baked into asking?
- The area grade is low — what's the realistic commute time and amenity access for the typical tenant pool here? Any planned neighborhood developments (good or bad) we should know about?
- What's the average days-on-market for RENTAL listings here right now (not sales)? A rising rental-DOM trend means longer vacancies and softer asking-rent achievability than the comps imply.
- What's the recent tenant-quality profile in this submarket — average credit score on applications, eviction rate, late-payment / NSF rate, and stable-employment percentage? A property-management company in the area should have these aggregated.
- How much new for-sale + rental construction is in the pipeline within 1–3 miles? Heavy new supply typically softens prices + rents 12–24 months out; constrained supply supports both.
Investment metrics
- 1% rule
- 0.84% ✗
- Cap rate
- 5.86%
- Cash-on-cash
- -1.54%
- DSCR
- 0.93
- GRM
- 9.9
CMA / ARV
- ARV (median comp)
- $367,150
- List price
- $349,900
- Delta
- -4.70%
- Verdict
- FAIR
- Comps
- 20 within 1.0 mi
Show comp detail 12 sales within ~0.75 mi
| Address | Dist | Beds/Ba | Sqft | Sold | Price | $/sf | Match |
|---|---|---|---|---|---|---|---|
| 291 Halifax Ln | 0.03mi | 4/2.5 | 2,164 (0%) | 0mo | $354,900 | $164 | 98 |
| 601 Fish Camp Rd | 0.19mi | 4/3.0 | 2,271 (+5%) | 1mo | $424,900 | $187 | 80 |
| 593 Fish Camp Rd | 0.20mi | 4/3.0 | 2,271 (+5%) | 1mo | $404,900 | $178 | 80 |
| 292 Halifax Ln | 0.03mi | 5/3.0 (+1) | 2,012 (-7%) | 2mo | $366,400 | $182 | 78 |
| 598 Fish Camp Rd | 0.23mi | 4/3.0 | 2,271 (+5%) | 1mo | $429,900 | $189 | 78 |
| 606 Fish Camp Rd | 0.23mi | 4/3.0 | 2,271 (+5%) | 2mo | $421,900 | $186 | 77 |
| 614 Fish Camp Rd | 0.24mi | 4/3.0 | 2,271 (+5%) | 2mo | $429,400 | $189 | 77 |
| 728 Empire Ave | 0.33mi | 4/3.0 | 2,271 (+5%) | 2mo | $409,900 | $180 | 73 |
| 736 Empire Ave | 0.37mi | 4/3.0 | 2,271 (+5%) | 2mo | $420,000 | $185 | 71 |
| 505 Foggy Brook Loop | 0.21mi | 4/3.0 | 1,941 (-10%) | 2mo | $359,900 | $185 | 70 |
| 713 Empire Ave | 0.24mi | 4/3.0 | 2,400 (+11%) | 1mo | $422,900 | $176 | 68 |
| 311 Halifax Ln | 0.24mi | 4/2.5 | 1,885 (-13%) | 2mo | $339,900 | $180 | 66 |
Match score weights: distance 35% · size 25% · config 20% · recency 20%. Top-matched comps best support the ARV.
Projected returns pro-forma
-3.0% appreciation · 3.0% rent growth · sell at horizon
- IRR
- -18.8%
- Equity multiple
- 0.34×
- Total profit
- $-64,629
- Equity at exit
- $52,171
- IRR
- -11.3%
- Equity multiple
- 0.32×
- Total profit
- $-66,301
- Equity at exit
- $30,253
Cash invested: $97,972 (down + closing). Projections, not guarantees.
Landlord ↔ Tenant lean methodology
- Overall (STATE)
- 90 Strongly Landlord-Friendly
- State Alabama
- 90 Strongly Landlord-Friendly · R+15
- County
- — inherits STATE
- City
- — inherits STATE
ZIP-level market 35043
- Home prices YoY
- -15.6%
- Active inventory
- 292
- Price-to-rent
- 9.9×
Monthly cashflow live
- Estimated rent
- $2,950 medium interval (Pro) →
- Mortgage (P&I)
- −$1,835
- Tax est. 1.5%
- −$437 /mo · $5,248/yr
- Insurance
- −$146
- HOA
- −$38
- Vacancy / Maint / Mgmt
- −$620
- Net cashflow
- $-126
Break-even live
Sensitivity live
| Price | -10% $116 | -5% $-5 | +0% $-126 | +5% $-246 | +10% $-367 |
|---|---|---|---|---|---|
| Rent | -10% $-359 | -5% $-242 | +0% $-126 | +5% $-9 | +10% $107 |
| Rate | -1.0pp $51 | -0.5pp $-37 | base $-126 | +0.5pp $-216 | +1.0pp $-308 |
UW: 25.0% down · 7.5% · 30yr · 1.5% tax · 5.0% vac · 8.0% maint · 8.0% mgmt
Financing live
Cash to close
- Down payment
- $87,475
- Closing costs
- $10,497
- Reserves months
- —
- Total cash needed
- —
Loan-product check · same deal, 3 products live
Conventional
25% down · 7.5% · 30yr
- Down + closing
- —
- Monthly P&I
- —
- Monthly cashflow
- —
- DSCR
- —
- Eligible?
- —
Personal DTI + credit; lowest rate.
DSCR
20% down · 8.5% · 30yr
- Down + closing
- —
- Monthly P&I
- —
- Monthly cashflow
- —
- DSCR
- —
- Eligible?
- —
No personal income docs; deal must DSCR.
Hard money
10% down · 12.0% · 12mo
- Down + closing
- —
- Monthly P&I
- —
- Monthly cashflow
- —
- DSCR
- —
- Eligible?
- —
Short-term bridge; refi at stabilization.
Rent comps 1 comps
| Address | Beds | Baths | Sqft | Rent | $/sqft | DOM | Units | Dist |
|---|---|---|---|---|---|---|---|---|
| 283 Halifax Ln Chelsea, AL | 4.0 | 2.0 | 2250 | $2,950 | $1.31 | 45d | 1 | 0.04mi |
HOA detail
- Monthly dues
- $38 · $456/yr
Listing history 18 events
-
2026-06-21days on market $349,900 Active 88 DOM
-
2026-06-18days on market $349,900 Active 85 DOM
-
2026-06-17price $349,900 Active 84 DOM
-
2026-06-17days on market $352,900 Active 84 DOM
-
2026-06-16days on market $352,900 Active 83 DOM
-
2026-06-15days on market $352,900 Active 82 DOM
-
2026-06-13days on market $352,900 Active 80 DOM
-
2026-06-13days on market $352,900 Active 79 DOM
-
2026-06-10days on market $352,900 Active 77 DOM
-
2026-06-09days on market $352,900 Active 76 DOM
-
2026-06-08days on market $352,900 Active 75 DOM
-
2026-06-07days on market $352,900 Active 74 DOM
-
2026-06-05days on market $352,900 Active 71 DOM
-
2026-06-03days on market $352,900 Active 70 DOM
-
2026-06-02days on market $352,900 Active 69 DOM
-
2026-06-01days on market $352,900 Active 68 DOM
-
2026-05-31days on market $352,900 Active 67 DOM
-
2026-03-25$359,900 Active 776-char remark
Show marketing remark (776 chars)
Ask about our interest rates, paid closing cost and easily added options. The Penwell is a two-story plan with 4 bedrooms and 2.5 bathrooms in 2,164 square feet. The main level features a flex room adjacent to the foyer, ideal for a formal dining room or home office. The gourmet kitchen has an oversized island for extra seating and a large pantry, and it opens to the dining area and a spacious living room. Bedroom One is on the second level and offers a private bathroom, double vanities and a large walk-in closet. There are 3 additional bedrooms, a full bathroom, and a walk-in laundry room. Quality materials and workmanship throughout, with superior attention to detail, plus a one-year builders warranty. Your new home also includes our smart home technology package!
ⓘ Source: listings_history table (triggers on properties + properties_extension) + one-shot
backfill from property_details.listing_events for pre-trigger history.
Climate risk First Street
- Flood 1/10 Low FEMA zone X (unshaded) · 0% chance over 30 yrs
- Wildfire 5/10 Major
- Heat 6/10 Major 7 d/yr ≥107°F today · 19 d/yr by 30 yrs out
- Wind 6/10 Major 27% chance of damaging wind over 30 yrs
- Air quality 3/10 Moderate 3 unhealthy d/yr today · 4 by 30 yrs out
Nearby sold comps map
Loading sold comps map…
Walkable amenities ~0.75 mi
Loading nearby amenities…
Taxation est. · year 1
- Rental income
- $35,400
- − Mortgage interest
- −$19,600
- − Property taxes
- −$5,248
- − Insurance
- −$1,750
- − Repairs & maintenance
- −$2,832
- − Management
- −$2,832
- − HOA
- −$456
- − Depreciation
- −$10,179
- Taxable loss
- −$7,497
- Est. tax savings @ 24.0%
- +$1,799
- After-tax cash flow
- $292/yr
For passive investors: Depreciation is non-cash, so a rental often shows a tax loss while cash-flowing — sheltering income. Rental losses are passive: they offset passive income freely, and up to $25,000/yr can offset ordinary (W-2) income if you actively participate and your MAGI is under $100k (phasing out to $0 by $150k); unused losses carry forward. On sale, claimed depreciation is recaptured at up to 25%, and gains may owe capital-gains tax (a 1031 exchange can defer both). Figures are a year-1 estimate at your 24.0% rate — not tax advice; consult a CPA.
Condition & rehab AI · 6 photos
This two-story home is in good condition with modern finishes and a well-maintained exterior. It offers a good balance of updates and maintenance, making it a solid investment opportunity.
Value-add opportunities
- Both Painting the exterior siding — Enhances curb appeal and can increase both resale and rental value.
- Both Landscaping improvements — Enhances curb appeal and can increase both resale and rental value.
- Resale Updating the kitchen backsplash — Modernizes the kitchen and can increase resale value.
- Rental Upgrading the flooring in the bedrooms — Improves the rental experience and can increase rental value.
Renovation cost estimate screening
Value-add ROI direction
- Both Painting the exterior siding — Enhances curb appeal and can increase both resale and rental value. ↑
- Both Landscaping improvements — Enhances curb appeal and can increase both resale and rental value. ↑
- Resale Updating the kitchen backsplash — Modernizes the kitchen and can increase resale value. ↑
- Rental Upgrading the flooring in the bedrooms — Improves the rental experience and can increase rental value. ↑
ⓘ Cost ranges are severity-bucket heuristics (US national rule-of-thumb). Get contractor quotes + a written scope before underwriting a rehab budget.
Schools (NCES district)
- District
- Shelby County
- NCES district ID
- 0103030
- Math proficiency
- 30% ▼ -28.00%
- Reading proficiency
- 58% ▲ 2.00%
- Median HH income
- $66,672
- Composite
- 39.29/100
- National rank
- #3995
- State rank
- #16 of 129 in AL
Livability — Chelsea
- Score
- 69/100
- State rank
- #52
- US rank
- #8363
Category grades
Schools grade is shown separately in the Schools card above.
Census & demographics
- Census place
- Chelsea, AL
- City population
- 15,068
- Population (ZIP)
- 15,068
Population outlook (Shelby County) Hauer SSP2
- Today (2025)
- 237,024 people
- By 2030
- 249,868 · +5.4%
- By 2040
- 272,778 · +15.1%
- By 2050
- 291,062 · +22.8%
- By 2075
- 326,049 · +37.6%
- By 2100
- 335,870 · +41.7%
Race, ethnicity, and origin ACS 2023
- Neighborhood character
- Predominantly White (85%)
- Race & ethnicity
- White 85% Black 6% Hispanic / Latino 5% Two or more races 4%
- Hispanic origin (detail)
- Mexican 3%
- Common ancestry
- Serbian 3% Slovak 2% Romanian 2%
- Foreign-born
- 3% · Canada
- Languages at home
- 92% English-only · Arabic 4% Spanish 4%
Political lean MEDSL · Shelby
- 2024 margin
- Solid R (+40.9) · D 29.0% · R 69.9% · Other 1.1%
- 2008→2024 swing
- +12.6pp toward D · 2008: -53.4pp · 2024: -40.9pp
- All cycles
- 2024: R+40.9 2020: R+40.4 2016: R+50.3 2012: R+55.6 2008: R+53.4
Not yet ingested
- Civics
- —
Market trends
- HPI YoY
- ▼ -38.08%
- Current HPI
- 205.463
- Rent YoY
- —
- Metro
- —
- State GDP YoY
- ▲ 2.94%
- F500 in state
- 4
Industry mix (Fortune 500 HQ in AL)
| Industry | F500 HQs | Revenue |
|---|---|---|
| Financial Services | 1 | $8B |
|
||
| Healthcare | 1 | $5B |
|
||
Price history
1 event — show timeline
- 2026-03-25 Listed $359,900 Greater Alabama MLS
Cash-flow waterfall
monthlySold comps — $/sqft
last 12 mo · ≤1 miLoading sold comps…