 Triplex
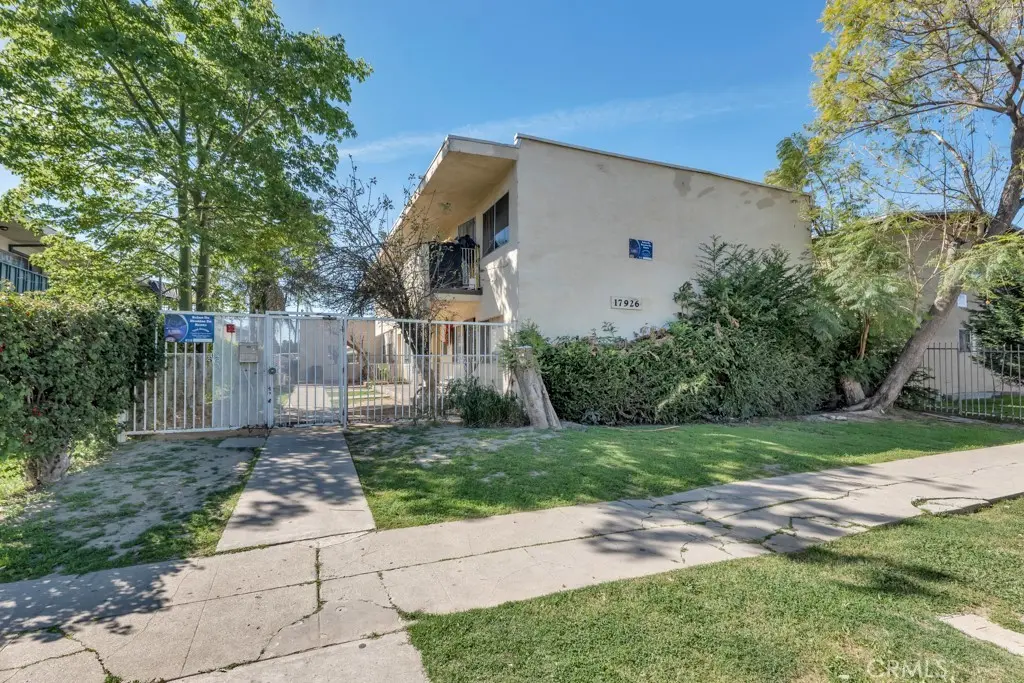
17926 Schoenborn St · Los Angeles, CA
Flood risk 1/10 · Minimal
- FEMA flood zone
- X (unshaded)
- Chance of flooding over 30 yrs
- 0.0%
- Est. flood insurance / yr
- $507 – $1,088
Fire risk 1/10 · Minimal
- Est. fire insurance / yr
- $659 – $1,223
Heat risk 6/10 · Moderate
- Hot days now (above 101°F)
- 7 days/yr
- Hot days in 30 yrs
- 19 days/yr
Wind risk 1/10 · Minimal
- Chance of severe wind over 30 yrs
- —
Air-quality risk 5/10 · Moderate
- Unhealthy air days now
- 7 days/yr
- Unhealthy air days in 30 yrs
- 8 days/yr
Risk factors via First Street. Map © Google.
Why this score? — see what drove the C- grade
The composite is a weighted blend of 9 inputs, each scored 0–100. Each bar is that input's sub-score; the figure is the points it added to the 100-point composite (weight × sub-score).
- Cash flow +16.3/30.0
- ARV discount +14.5/15.0
- DSCR +5.0/10.0
- 1% rule +4.3/10.0
- Schools +3.6/10.0
- Livability +3.4/5.0
- Rent growth +3.2/5.0
- Condition / age +2.5/5.0
- Appreciation +0.0/10.0
$1,295,000
🖨 Deal sheet 📄 Offer letter ✓ Due diligence
Multi-family units
County records classify this as Multi-Family (5+ Unit). Listing-text estimate: 3 units. estimate disagrees with records
5+ unit building — per-unit beds/baths from public records are typically unavailable; the breakdown below (if shown) is an estimate from the listing text.
Listing remarks MLS
Located in the desirable community of Northridge, 17926 Schoenborn St presents an excellent multifamily investment opportunity in one of the San Fernando Valley’s most consistently strong rental markets. Situated on a quiet residential street with convenient alley access, the property benefits from both neighborhood charm and close proximity to major retail, transportation, and employment hubs throughout the area. The property features a well-balanced six-unit unit mix consisting of four 1-Bedroom/1-Bath units, one 2-Bedroom/2-Bath unit, and one 3-Bedroom/2-Bath unit, providing a diverse range of living options that appeal to a broad tenant base including students, professionals, and families. Each unit is individually metered for gas and electric, helping reduce operating costs while allowing tenants to manage their own utility usage. Residents enjoy the convenience of on-site parking with additional storage, a valuable amenity that enhances tenant appeal and everyday practicality. The location offers outstanding access to nearby amenities including the popular Northridge Fashion Center, which features a wide variety of retail stores, dining options, and entertainment. Tenants are also within close proximity to numerous grocery stores, restaurants, and neighborhood services, making daily errands quick and convenient. Transportation and commuting options are another strong advantage, with the property located a short distance from the Northridge Metrolink Station, providing regional rail service across the greater Los Angeles area. Residents also benefit from easy access to major transportation corridors including the Interstate 405 and the U. S. Route 101, allowing convenient travel throughout the San Fernando Valley and beyond. The property is also located near California State University, Northridge, one of the largest universities in the region, which contributes to strong and consistent rental demand. Additionally, Van Nuys Airport is just a short drive away, adding further convenience for residents and visitors. This information has been secured from sources we believe to be reliable, but we make no representations or warranties, expressed or implied as to the accuracy of the information. References to square footage or age are approximate. Buyer must verify the information and bears all risk for any inaccuracies.
Key facts
- Alley access
- On-site parking
- Additional storage
Tags
Neighborhood map
What this means for you Summary
Snapshot
- This is a 3 × 3-bed/?-bath units multifamily listed at $1.29M.
Deal economics
- At list price, monthly cash flow is $705 ($8k/yr) — positive. Per door: $235/mo.
- The deal already cash-flows at list — no discount required.
- To meet the 1% rule (rent ≥ 1% of price), the offer needs to be $1.20M (7.3% below list).
- Recommended offer: $1.18M (9.0% below list) — sets the bar for market timing.
- Cap rate 6.9% vs local median 2.1% in Los Angeles — top-decile yield for the area; either an underpriced asset or a hidden risk that comps aren't pricing in. Stress-test before assuming the spread holds.
Location & tenants
- Location reads 68/100 on livability (#273 in CA) — a middle-class / working-renter tenant base. Strengths: amenities A+, commute A+, employment B; Watch: health & safety C-, schools D+, crime F.
- Los Angeles Unified (urban): math 29% / reading 54% proficiency, ranked #223 of 517 in CA (top 43%) — families likely to look elsewhere, expect single-tenant / working-renter base with shorter leases; 67% free/reduced lunch — lower-income household profile, screen leases tightly.
- Market conditions: Rents rising (+2.7%/yr); 63 active listings in the ZIP; solid renter incomes; 19,697 units permitted in Los Angeles County in 2024 (9,426 in 5+ unit buildings).
- At $12,005/mo this rent would consume 165% of the median local household income ($87k/yr) (locally 2413% of renters already pay >50% of income on rent) — very limited rent-growth headroom before tenants either downsize or default.
Forward outlook
- Local home prices are declining (-3.0%/yr); year-one equity from $9k of loan paydown is wiped out by about $39k of value loss. Plan a longer hold.
- Los Angeles County population projected at +9% by 2050 — modest demand growth; plan on rents tracking national, not racing it.
Negotiation context
- It's been on market 91 days — a 9% lower offer ($1.18M) is reasonable based on typical stale-listing flexibility.
- 5 sale attempts since 12y ago with the ask held roughly flat each time — persistent listings suggest the price (not the market) is what's stuck; bring a comps-based counter.
Risks & watch-outs
- Watch-outs: built in 1959 — expect roof / HVAC / electrical / plumbing capex.
- Climate carrying-cost: extreme-heat days projected 7→19/yr by 2055 (HVAC capex compounding) — expect insurance premiums to compound above CPI over the hold.
Questions for the listing agent
- It's been on market 91 days. Have you received any prior offers? Is the seller open to a 9% concession, seller financing, or rate buy-down credit?
- Can we see the unit-by-unit rent roll, current vacancy, and any below-market leases? What's the average tenancy length?
- What capital expenditures (roof, boiler, parking lot, exteriors) have been made in the last 5 years, and what's planned in the next 2?
- Built in 1959 — when were the roof, HVAC, electrical panel, plumbing, and water heater last replaced?
- Why hasn't it sold? Are there any deal-killer items the seller is aware of (foundation, flood, title, zoning, code violations)?
- Is there a deadline driving the sale (1031 exchange, divorce, estate, relocation)? That informs how much negotiation room exists.
- Schools are D-rated, which usually means shorter tenancies and higher turnover. Who's the typical renter profile here, and what's been the actual vacancy rate?
- Crime grade is F in this area — have there been break-ins, vandalism, or insurance claims at this property in the last 3 years? What carrier currently insures it and at what premium?
- What's the average days-on-market for RENTAL listings here right now (not sales)? A rising rental-DOM trend means longer vacancies and softer asking-rent achievability than the comps imply.
- What's the recent tenant-quality profile in this submarket — average credit score on applications, eviction rate, late-payment / NSF rate, and stable-employment percentage? A property-management company in the area should have these aggregated.
- How much new apartment / multifamily construction is in the pipeline within 1–3 miles? Heavy new supply (>2% of stock underway) typically softens rents 12–24 months out; light construction supports rent growth.
Investment metrics
- 1% rule
- 0.93% ✗
- Cap rate
- 6.95%
- Cash-on-cash
- 2.33%
- DSCR
- 1.10
- GRM
- 9.0
CMA / ARV
- ARV (median comp)
- $1,532,778
- List price
- $1,295,000
- Delta
- -15.51%
- Verdict
- UNDERPRICED
- Comps
- 9 within 1.0 mi
Show comp detail 1 sale within ~0.75 mi
| Address | Dist | Beds/Ba | Sqft | Sold | Price | $/sf | Match |
|---|---|---|---|---|---|---|---|
| 17956 Schoenborn St | 0.06mi | 9/7.0 | 4,962 (0%) | 8mo | $1,410,000 | $284 | 91 |
Match score weights: distance 35% · size 25% · config 20% · recency 20%. Top-matched comps best support the ARV.
Projected returns pro-forma
-3.0% appreciation · 2.73% rent growth · sell at horizon
- IRR
- -12.9%
- Equity multiple
- 0.54×
- Total profit
- $-168,104
- Equity at exit
- $193,089
- IRR
- -4.3%
- Equity multiple
- 0.72×
- Total profit
- $-101,508
- Equity at exit
- $111,968
Cash invested: $362,600 (down + closing). Projections, not guarantees.
Landlord ↔ Tenant lean methodology
- Overall (CITY)
- 0 Strongly Tenant-Friendly
- State California
- 18 Strongly Tenant-Friendly · D+13
- County
- — inherits STATE
- City Los Angeles
- 0 Strongly Tenant-Friendly · D+22
ZIP-level market 91325
- Rents YoY
- 2.7%
- Active inventory
- 63
- Price-to-rent
- 27.0×
Monthly cashflow live
- Estimated rent
- $12,005 high interval (Pro) →
- Mortgage (P&I)
- −$6,791
- Tax from tax record
- −$1,448 /mo · $17,376/yr
- Insurance
- −$540
- HOA
- −$0
- Vacancy / Maint / Mgmt
- −$2,521
- Net cashflow
- $705
Break-even live
3-unit breakdown (identical units grouped — click to expand)
| Units | Beds | Baths | Est. rent |
|---|---|---|---|
| 3× units | 3 | — | $12,006 |
| #1 | 3 | — | $4,002 |
| #2 | 3 | — | $4,002 |
| #3 | 3 | — | $4,002 |
| Total (3 units) | $12,005 | ||
UW: 25.0% down · 7.5% · 30yr · 1.5% tax · 5.0% vac · 8.0% maint · 8.0% mgmt
Financing live
Cash to close
- Down payment
- $323,750
- Closing costs
- $38,850
- Reserves months
- —
- Total cash needed
- —
Loan-product check · same deal, 3 products live
Conventional
25% down · 7.5% · 30yr
- Down + closing
- —
- Monthly P&I
- —
- Monthly cashflow
- —
- DSCR
- —
- Eligible?
- —
Personal DTI + credit; lowest rate.
DSCR
20% down · 8.5% · 30yr
- Down + closing
- —
- Monthly P&I
- —
- Monthly cashflow
- —
- DSCR
- —
- Eligible?
- —
No personal income docs; deal must DSCR.
Hard money
10% down · 12.0% · 12mo
- Down + closing
- —
- Monthly P&I
- —
- Monthly cashflow
- —
- DSCR
- —
- Eligible?
- —
Short-term bridge; refi at stabilization.
Listing history 27 events
-
2026-06-18days on market $1,295,000 Active 91 DOM
-
2026-06-17days on market $1,295,000 Active 90 DOM
-
2026-06-16days on market $1,295,000 Active 89 DOM
-
2026-06-15days on market $1,295,000 Active 88 DOM
-
2026-06-13days on market $1,295,000 Active 86 DOM
-
2026-06-09days on market $1,295,000 Active 82 DOM
-
2026-06-08days on market $1,295,000 Active 81 DOM
-
2026-06-07days on market $1,295,000 Active 80 DOM
-
2026-06-04days on market $1,295,000 Active 77 DOM
-
2026-06-03days on market $1,295,000 Active 76 DOM
-
2026-06-02days on market $1,295,000 Active 75 DOM
-
2026-06-01days on market $1,295,000 Active 74 DOM
-
2026-05-31days on market $1,295,000 Active 73 DOM
-
2026-03-19$1,295,000 Active 2367-char remark
Show marketing remark (2367 chars)
Located in the desirable community of Northridge, 17926 Schoenborn St presents an excellent multifamily investment opportunity in one of the San Fernando Valley’s most consistently strong rental markets. Situated on a quiet residential street with convenient alley access, the property benefits from both neighborhood charm and close proximity to major retail, transportation, and employment hubs throughout the area. The property features a well-balanced six-unit unit mix consisting of four 1-Bedroom/1-Bath units, one 2-Bedroom/2-Bath unit, and one 3-Bedroom/2-Bath unit, providing a diverse range of living options that appeal to a broad tenant base including students, professionals, and families. Each unit is individually metered for gas and electric, helping reduce operating costs while allowing tenants to manage their own utility usage. Residents enjoy the convenience of on-site parking with additional storage, a valuable amenity that enhances tenant appeal and everyday practicality. The location offers outstanding access to nearby amenities including the popular Northridge Fashion Center, which features a wide variety of retail stores, dining options, and entertainment. Tenants are also within close proximity to numerous grocery stores, restaurants, and neighborhood services, making daily errands quick and convenient. Transportation and commuting options are another strong advantage, with the property located a short distance from the Northridge Metrolink Station, providing regional rail service across the greater Los Angeles area. Residents also benefit from easy access to major transportation corridors including the Interstate 405 and the U. S. Route 101, allowing convenient travel throughout the San Fernando Valley and beyond. The property is also located near California State University, Northridge, one of the largest universities in the region, which contributes to strong and consistent rental demand. Additionally, Van Nuys Airport is just a short drive away, adding further convenience for residents and visitors. This information has been secured from sources we believe to be reliable, but we make no representations or warranties, expressed or implied as to the accuracy of the information. References to square footage or age are approximate. Buyer must verify the information and bears all risk for any inaccuracies.
-
2018-04-20soldstatus $1,200,000 Closed 212-char remark
Show marketing remark (212 chars)
-Current Interest Only Loan May be Assumable (Contact Listing Agent) -Close to Reseda Boulevard & Roscoe Boulevard -Good Unit Mix with Upside -6 Gated Parking Spaces & No Soft-Story Construction
-
2018-04-20soldstatus $1,200,000
Show marketing remark (212 chars)
-Current Interest Only Loan May be Assumable (Contact Listing Agent) -Close to Reseda Boulevard & Roscoe Boulevard -Good Unit Mix with Upside -6 Gated Parking Spaces & No Soft-Story Construction
-
2018-04-16status Backup Offers Accepted 212-char remark
Show marketing remark (212 chars)
-Current Interest Only Loan May be Assumable (Contact Listing Agent) -Close to Reseda Boulevard & Roscoe Boulevard -Good Unit Mix with Upside -6 Gated Parking Spaces & No Soft-Story Construction
-
2018-03-15$1,250,000 Active 212-char remark
Show marketing remark (212 chars)
-Current Interest Only Loan May be Assumable (Contact Listing Agent) -Close to Reseda Boulevard & Roscoe Boulevard -Good Unit Mix with Upside -6 Gated Parking Spaces & No Soft-Story Construction
-
2018-03-15$1,250,000
Show marketing remark (212 chars)
-Current Interest Only Loan May be Assumable (Contact Listing Agent) -Close to Reseda Boulevard & Roscoe Boulevard -Good Unit Mix with Upside -6 Gated Parking Spaces & No Soft-Story Construction
-
2014-05-30soldstatus $825,000
-
2014-05-29historical
-
2014-05-29$825,000
-
2014-05-20soldstatus $845,000
-
2014-02-11historical Withdrawn
-
2014-01-11Active
-
2004-02-03soldstatus $490,000
-
1995-03-24soldstatus $65,000
ⓘ Source: listings_history table (triggers on properties + properties_extension) + one-shot
backfill from property_details.listing_events for pre-trigger history.
Tax reassessment forecast CA · Resets to sale price
- Current annual tax
- $17,376 · $1,448/mo
- Projected year-2 tax
- $17,376 · $1,448/mo
- Expected delta
- $0/yr ($0/mo · 0.0%)
ⓘ Screening estimate from a state-policy table — verify with the county assessor before closing.
Climate risk First Street
- Flood 1/10 Low FEMA zone X (unshaded) · 0% chance over 30 yrs
- Wildfire 1/10 Low
- Heat 6/10 Major 7 d/yr ≥101°F today · 19 d/yr by 30 yrs out
- Wind 1/10 Low
- Air quality 5/10 Major 7 unhealthy d/yr today · 8 by 30 yrs out
Nearby sold comps map
Loading sold comps map…
Walkable amenities ~0.75 mi
Loading nearby amenities…
Taxation est. · year 1
- Rental income
- $144,060
- − Mortgage interest
- −$72,540
- − Property taxes
- −$17,376
- − Insurance
- −$6,475
- − Repairs & maintenance
- −$11,525
- − Management
- −$11,525
- − Depreciation
- −$37,673
- Taxable loss
- −$13,053
- Est. tax savings @ 24.0%
- +$3,133
- After-tax cash flow
- $11,596/yr
For passive investors: Depreciation is non-cash, so a rental often shows a tax loss while cash-flowing — sheltering income. Rental losses are passive: they offset passive income freely, and up to $25,000/yr can offset ordinary (W-2) income if you actively participate and your MAGI is under $100k (phasing out to $0 by $150k); unused losses carry forward. On sale, claimed depreciation is recaptured at up to 25%, and gains may owe capital-gains tax (a 1031 exchange can defer both). Figures are a year-1 estimate at your 24.0% rate — not tax advice; consult a CPA.
Schools (NCES district)
- District
- Los Angeles Unified
- NCES district ID
- 0622710
- Math proficiency
- 29% ▼ -4.00%
- Reading proficiency
- 54% ▲ 10.00%
- Median HH income
- $50,403
- Composite
- 35.67/100
- National rank
- #4875
- State rank
- #223 of 517 in CA
Livability — Los Angeles
- Score
- 68/100
- State rank
- #273
- US rank
- #9237
Category grades
Schools grade is shown separately in the Schools card above.
Census & demographics
- Census place
- Los Angeles, CA
- County
- Los Angeles County · 9,444,647 people
- City population
- 3,838,149
- Metro
- Los Angeles-Long Beach-Anaheim, CA
- Population (ZIP)
- 35,062
- Household income
- $87,168
- Rent vs Own
- Severe rent burden
- 2413.0
Population outlook (Los Angeles County) Hauer SSP2
- Today (2025)
- 10,940,515 people
- By 2030
- 11,256,481 · +2.9%
- By 2040
- 11,729,929 · +7.2%
- By 2050
- 11,948,407 · +9.2%
- By 2075
- 11,818,114 · +8.0%
- By 2100
- 10,842,928 · -0.9%
Race, ethnicity, and origin ACS 2023
- Neighborhood character
- Highly diverse neighborhood (Simpson 0.70)
- Race & ethnicity
- White 37% Hispanic / Latino 36% Asian 16% Two or more races 13% Black 5%
- Hispanic origin (detail)
- Mexican 24%
- Common ancestry
- Scotch-Irish 2% Romanian 2% Lithuanian 1%
- Foreign-born
- 35% · Canada, South Korea, China
- Languages at home
- 51% English-only · Spanish 25% Other Indo-European 8% Tagalog/Filipino 3%
Political lean MEDSL · Los Angeles
- 2024 margin
- Solid D (+32.9) · D 64.8% · R 31.9% · Other 3.3%
- 2008→2024 swing
- -7.4pp toward R · 2008: 40.4pp · 2024: 32.9pp
- All cycles
- 2024: D+32.9 2020: D+44.2 2016: D+48.0 2012: D+40.0 2008: D+40.4
Not yet ingested
- Civics
- —
Market trends
- HPI YoY
- ▼ -794.61%
- Current HPI
- 390.0474
- Rent YoY
- ▲ 2.73%
- Metro
- Los Angeles-Long Beach-Anaheim, CA
- State GDP YoY
- ▲ 3.21%
- F500 in state
- 116
Industry mix (Fortune 500 HQ in CA)
| Industry | F500 HQs | Revenue |
|---|---|---|
| Technology | 27 | $1,492B |
|
||
| Financial Services | 3 | $174B |
|
||
| Retail | 3 | $44B |
|
||
| Insurance | 3 | $26B |
|
||
| Media / Entertainment | 2 | $115B |
|
||
| Pharmaceuticals / Biotech | 2 | $62B |
|
||
Price history
+1892.3% since first listed14 events — show timeline
- 2026-03-19 Listed $1,295,000 CRMLS
- 2018-04-20 Sold (MLS) $1,200,000 SDMLS
- 2018-04-20 Sold (MLS) $1,200,000 TheMLS
- 2018-04-16 Pending — TheMLS
- 2018-03-15 Listed $1,250,000 SDMLS
- 2018-03-15 Listed $1,250,000 TheMLS
- 2014-05-30 Sold (MLS) $825,000 CRMLS
- 2014-05-29 Listed $825,000 CRMLS
- 2014-05-29 Listing Removed — CRMLS
- 2014-05-20 Sold (Public Records) $845,000 Public Records
- 2014-02-11 Delisted — TheMLS
- 2014-01-11 Listed — TheMLS
- 2004-02-03 Sold (Public Records) $490,000 Public Records
- 1995-03-24 Sold (Public Records) $65,000 Public Records
Property tax history
+5.4%/yrLatest (2025): $17,376 · +1.3% YoY. Source: county tax records.
Cash-flow waterfall
monthlySold comps — $/sqft
last 12 mo · ≤1 miLoading sold comps…