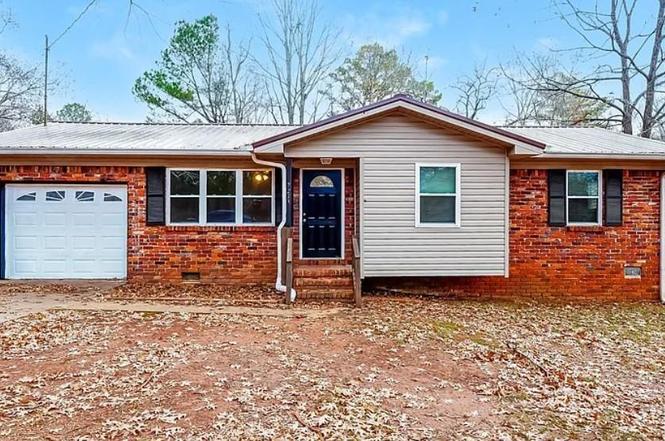
2213 Cynthia Dr · Center Point, AL
Flood risk 1/10 · Minimal
- FEMA flood zone
- X (unshaded)
- Chance of flooding over 30 yrs
- 0.0%
- Est. flood insurance / yr
- $507 – $1,088
Fire risk 3/10 · Minor
- Est. fire insurance / yr
- $916 – $1,700
Heat risk 6/10 · Moderate
- Hot days now (above 105°F)
- 7 days/yr
- Hot days in 30 yrs
- 19 days/yr
Wind risk 6/10 · Moderate
- Chance of severe wind over 30 yrs
- 27.0%
Air-quality risk 5/10 · Moderate
- Unhealthy air days now
- 7 days/yr
- Unhealthy air days in 30 yrs
- 9 days/yr
Risk factors via First Street. Map © Google.
Why this score? — see what drove the B- grade
The composite is a weighted blend of 9 inputs, each scored 0–100. Each bar is that input's sub-score; the figure is the points it added to the 100-point composite (weight × sub-score).
- Cash flow +25.8/30.0
- ARV discount +15.0/15.0
- DSCR +8.6/10.0
- 1% rule +6.5/10.0
- Rent growth +3.3/5.0
- Livability +3.2/5.0
- Condition / age +2.5/5.0
- Schools +1.8/10.0
- Appreciation +0.0/10.0
$114,900
🖨 Deal sheet 📄 Offer letter ✓ Due diligence
Listing remarks MLS
One level brick on quiet street right next to Chalkville Elementary and Sports Complex. The Roof (Metal) HVAC and Water Heater all replaced in 2017. New flooring and paint throughout including garage. New insulation in attic and all appliances stay with home. This is a GREAT buy!
Key facts
- 0.28 acre lot
- Garage
- Built 1970
Property features AI
Finance
- Other: Lot is approximately 0.28 acres; Located in the Chalkville subdivision
- HOA & community: No association fees
Exterior
- Parking: Attached front-entry garage with 1 garage space
- Utilities: Public water; Gas water heater; Internet service availability unknown
- Home design: Existing single-family home (4-side brick construction)
- Construction: 4-side brick construction; Basement foundation
- Exterior features: Open deck; No pool, patio, garden/patio, or waterfront
Interior
- Kitchen: Solid surface countertops; Built-in dishwasher
- Bedrooms: Master bedroom on main level; Two additional bedrooms on main level
- Flooring: Hardwood
- Bathrooms: One full bathroom with a garden tub
- Heating & cooling: Central heating; Central cooling
- Interior features: Hardwood floors; Ceilings noted as 'Other' (see remarks); Pull-down attic; Partial, all-unfinished concrete block basement; No special interior features listed
- Laundry & utility: Main-level laundry closet with washer hookup and electric dryer hookup; Gas water heater
Neighborhood map
What this means for you Summary
Snapshot
- This is a 3-bed/1.0-bath single-family listed at $115k.
Deal economics
- At list price, monthly cash flow is $279 ($3k/yr) — positive.
- The deal already cash-flows at list — no discount required.
- Meets the 1% rule at list price ($1k rent vs $115k).
- Cap rate 9.2% vs local median 7.3% in Center Point — meaningfully above typical; check what's discounted (condition, days-on-market, listing class) to confirm the premium yield is real.
Location & tenants
- Location reads 63/100 on livability (#193 in AL) — a middle-class / working-renter tenant base. Strengths: cost of living A+, commute A, housing A; Watch: crime D, amenities F, employment F.
- Jefferson County (suburban): math 9% / reading 32% proficiency, ranked #104 of 129 in AL (top 81%) — low school quality limits family demand, transient renter base, plan for 1-2y turnover.
- Zoned schools: Chalkville Elementary School (math 6% / reading 16%, grade F, #560 of 627 statewide, top 90%, 854 students, 79% FRL); Claychalkville High School (math 6% / reading 9%, grade F, #261 of 305 statewide, top 87%, 1,361 students, 56% FRL) — zoned schools average 67% FRL vs 49% district-wide (19 pts higher); higher-poverty schools than district average — tighter screening recommended.
- Market conditions: Rents rising (+3.0%/yr); 334 active listings in the ZIP; 38 comparable units currently listed for rent nearby; rentals at typical pace (median 24d on market — plan ~3-4 weeks tenant-placement turnaround); 2,114 units permitted in Jefferson County in 2024 (556 in 5+ unit buildings).
Forward outlook
- Local home prices are declining (-3.0%/yr); year-one equity from $794 of loan paydown is wiped out by about $3k of value loss. Plan a longer hold.
- Jefferson County population projected to shrink 4% by 2050 — rents likely to lag national; underwrite the cash flow, not the appreciation.
Negotiation context
- Only 1 days on market — expect competitive offers; lowballing is unlikely to land.
- 2 sale attempts since 7y ago with the ask held roughly flat each time — persistent listings suggest the price (not the market) is what's stuck; bring a comps-based counter.
Risks & watch-outs
- Climate carrying-cost: major wind risk, 27% chance of damaging wind over 30y; extreme-heat days projected 7→19/yr by 2055 (HVAC capex compounding) — expect insurance premiums to compound above CPI over the hold.
Questions for the listing agent
- Built in 1970 — when were the roof, HVAC, electrical panel, plumbing, and water heater last replaced?
- Is there a deadline driving the sale (1031 exchange, divorce, estate, relocation)? That informs how much negotiation room exists.
- Schools are F-rated, which usually means shorter tenancies and higher turnover. Who's the typical renter profile here, and what's been the actual vacancy rate?
- Crime grade is D in this area — have there been break-ins, vandalism, or insurance claims at this property in the last 3 years? What carrier currently insures it and at what premium?
- What's the average days-on-market for RENTAL listings here right now (not sales)? A rising rental-DOM trend means longer vacancies and softer asking-rent achievability than the comps imply.
- What's the recent tenant-quality profile in this submarket — average credit score on applications, eviction rate, late-payment / NSF rate, and stable-employment percentage? A property-management company in the area should have these aggregated.
- How much new for-sale + rental construction is in the pipeline within 1–3 miles? Heavy new supply typically softens prices + rents 12–24 months out; constrained supply supports both.
Investment metrics
- 1% rule
- 1.15% ✓
- Cap rate
- 9.20%
- Cash-on-cash
- 10.39%
- DSCR
- 1.46
- GRM
- 7.3
CMA / ARV
- ARV (on-the-fly)
- $150,380
- Comps found
- 10
Show comp detail 10 sales within ~0.75 mi
| Address | Dist | Beds/Ba | Sqft | Sold | Price | $/sf | Match |
|---|---|---|---|---|---|---|---|
| 1833 Lyle Dr | 0.41mi | 3/1.5 | 1,054 (+2%) | 2mo | $170,000 | $161 | 73 |
| 1801 Dry Creek Cir | 0.48mi | 3/2.0 | 1,076 (+4%) | 7mo | $185,000 | $172 | 60 |
| 509 20th Ave NE | 0.63mi | 3/1.5 | 1,008 (-2%) | 7mo | $95,000 | $94 | 59 |
| 1012 Turner Ln | 0.14mi | 3/2.0 | 1,120 (+9%) | 20mo | $164,000 | $146 | 58 |
| 1833 Dry Creek Cir | 0.54mi | 3/1.0 | 1,155 (+12%) | 3mo | $120,000 | $104 | 52 |
| 5026 Curtis Dr | 0.47mi | 3/2.0 | 1,126 (+9%) | 12mo | $200,000 | $178 | 49 |
| 1928 Reed Rd | 0.62mi | 3/1.5 | 1,050 (+2%) | 21mo | $132,500 | $126 | 48 |
| 770 Mary Vann Ln | 0.60mi | 3/1.5 | 992 (-4%) | 23mo | $63,000 | $64 | 45 |
| 5036 Vernon St | 0.54mi | 3/2.0 | 1,177 (+14%) | 21mo | $165,000 | $140 | 30 |
| 5010 Patriot Dr | 0.56mi | 3/2.0 | 1,160 (+13%) | 24mo | $197,500 | $170 | 29 |
Match score weights: distance 35% · size 25% · config 20% · recency 20%. Top-matched comps best support the ARV.
Projected returns pro-forma
-3.0% appreciation · 3.04% rent growth · sell at horizon
- IRR
- -0.7%
- Equity multiple
- 0.97×
- Total profit
- $-827
- Equity at exit
- $17,132
- IRR
- 9.0%
- Equity multiple
- 1.69×
- Total profit
- $22,338
- Equity at exit
- $9,934
Cash invested: $32,172 (down + closing). Projections, not guarantees.
Landlord ↔ Tenant lean methodology
- Overall (STATE)
- 90 Strongly Landlord-Friendly
- State Alabama
- 90 Strongly Landlord-Friendly · R+15
- County
- — inherits STATE
- City
- — inherits STATE
ZIP-level market 35215
- Home prices YoY
- -34.4%
- Rents YoY
- 3.0%
- Active inventory
- 334
- Price-to-rent
- 7.3×
Monthly cashflow live
- Estimated rent
- $1,316 high interval (Pro) →
- Mortgage (P&I)
- −$603
- Tax from tax record
- −$110 /mo · $1,325/yr
- Insurance
- −$48
- HOA
- −$0
- Vacancy / Maint / Mgmt
- −$276
- Net cashflow
- $279
Break-even live
UW: 25.0% down · 7.5% · 30yr · 1.5% tax · 5.0% vac · 8.0% maint · 8.0% mgmt
Financing live
Cash to close
- Down payment
- $28,725
- Closing costs
- $3,447
- Reserves months
- —
- Total cash needed
- —
Loan-product check · same deal, 3 products live
Conventional
25% down · 7.5% · 30yr
- Down + closing
- —
- Monthly P&I
- —
- Monthly cashflow
- —
- DSCR
- —
- Eligible?
- —
Personal DTI + credit; lowest rate.
DSCR
20% down · 8.5% · 30yr
- Down + closing
- —
- Monthly P&I
- —
- Monthly cashflow
- —
- DSCR
- —
- Eligible?
- —
No personal income docs; deal must DSCR.
Hard money
10% down · 12.0% · 12mo
- Down + closing
- —
- Monthly P&I
- —
- Monthly cashflow
- —
- DSCR
- —
- Eligible?
- —
Short-term bridge; refi at stabilization.
Rent comps 38 comps
| Address | Beds | Baths | Sqft | Rent | $/sqft | DOM | Units | Dist |
|---|---|---|---|---|---|---|---|---|
| 856 Parkbrook Trl Birmingham, AL | 1.0–3.0 | 1.0–2.0 | 925 | $1,180 | $1.28 | 2d | 10 | 0.33mi |
| 1814 Valley Run Cir Birmingham, AL | 3.0 | 1.0 | 1025 | $1,350 | $1.32 | 43d | 1 | 0.39mi |
| 2415 Ormond Dr Center Point, AL | 3.0 | 1.5 | 1194 | $1,295 | $1.08 | 43d | 1 | 0.47mi |
| 1817 Lyle Dr Birmingham, AL | 4.0 | 2.0 | 1361 | $1,605 | $1.18 | 23d | 1 | 0.47mi |
| 1935 Springlake Ct Unit 1 Birmingham, AL | 2.0 | 1.5 | 1152 | $1,095 | $0.95 | 43d | 1 | 0.51mi |
| 509 20th Ave NE Center Point, AL | 3.0 | 1.5 | 1008 | $1,200 | $1.19 | 23d | 1 | 0.61mi |
| 2025 Brewster Rd Birmingham, AL | 3.0 | 2.0 | 1369 | $1,450 | $1.06 | 23d | 1 | 0.62mi |
| 2249 4th Place Cir NE Center Point, AL | 3.0 | 1.5 | 1400 | $1,400 | $1.00 | 43d | 1 | 0.70mi |
| 1845 Stonehenge Dr Birmingham, AL | 3.0 | 2.0 | 1358 | $1,323 | $0.97 | 14d | 1 | 0.73mi |
| 1830 Christian St Birmingham, AL | 3.0 | 2.0 | 1468 | $1,375 | $0.94 | 2d | 1 | 0.79mi |
| 2109 Whetstone Ct Center Point, AL | 2.0 | 1.5 | 800 | $675 | $0.84 | 2d | 1 | 0.86mi |
| 1748 Sonia Dr Birmingham, AL | 4.0 | 2.0 | 1401 | $1,395 | $1.00 | 43d | 1 | 0.87mi |
| 401 22nd Ave NE Center Point, AL | 2.0 | 1.5 | 850 | $745 | $0.88 | 16d | 1 | 0.88mi |
| 332 23rd Ave NE Center Point, AL | 3.0 | 1.0 | 1100 | $1,350 | $1.23 | 2d | 1 | 0.90mi |
| 2708 7th St NE Center Point, AL | 3.0 | 1.0 | 1451 | $1,150 | $0.79 | 43d | 1 | 0.97mi |
| 2229 3rd St NE Center Point, AL | 3.0 | 1.0 | 1215 | $1,125 | $0.93 | 23d | 1 | 1.04mi |
| 2245 3rd St NE Center Point, AL | 3.0 | 1.0 | 1150 | $1,100 | $0.96 | 23d | 1 | 1.05mi |
| 2324 3rd St NE Center Point, AL | 3.0 | 2.0 | 1329 | $1,300 | $0.98 | 23d | 1 | 1.12mi |
| 124 21st Ave NE Unit 202 Center Point, AL | 2.0 | 1.0 | 830 | $750 | $0.90 | 16d | 1 | 1.22mi |
| 2258 Cheshire Dr Birmingham, AL | 2.0 | 2.0 | 1152 | $1,050 | $0.91 | 43d | 1 | 1.23mi |
| 2537 3rd St NE Center Point, AL | 3.0 | 2.0 | 1040 | $1,350 | $1.30 | 23d | 1 | 1.23mi |
| 123 21st Ave NE Center Point, AL | 2.0 | 1.0 | 850 | $800 | $0.94 | 43d | 1 | 1.24mi |
| 2504 Beechwood Trl Pinson, AL | 3.0 | 2.0 | 1359 | $1,435 | $1.06 | 21d | 1 | 1.30mi |
| 5528 Saint James St Birmingham, AL | 2.0 | 1.5 | 1072 | $1,150 | $1.07 | 43d | 1 | 1.33mi |
| 5531 Saint James St Birmingham, AL | 2.0 | 1.5 | 1072 | $950 | $0.89 | 43d | 1 | 1.34mi |
| 2358 Grayson Valley Cir Birmingham, AL | 3.0 | 3.0 | 1320 | $1,503 | $1.14 | 11d | 1 | 1.35mi |
| 2350 Grayson Valley Cir Birmingham, AL | 3.0 | 2.5 | 1380 | $1,595 | $1.16 | 43d | 1 | 1.36mi |
| 2629 Wood Dr NE Center Point, AL | 3.0 | 1.0 | 1203 | $1,250 | $1.04 | 43d | 1 | 1.36mi |
| 2463 Hampstead Dr Birmingham, AL | 2.0 | 1.5 | 1100 | $1,127 | $1.02 | 2d | 1 | 1.38mi |
| 2345 Grayson Valley Cir Birmingham, AL | 2.0 | 1.5 | 1056 | $1,150 | $1.09 | 2d | 1 | 1.39mi |
| 1720 2nd St NE Center Point, AL | 3.0 | 2.0 | 1100 | $1,400 | $1.27 | 43d | 1 | 1.40mi |
| 2487 Hampstead Dr Birmingham, AL | 2.0 | 1.5 | 1163 | $995 | $0.86 | 2d | 1 | 1.41mi |
| 4464 Winchester Hills Way Birmingham, AL | 3.0 | 2.0 | 1178 | $1,750 | $1.49 | 43d | 1 | 1.43mi |
| 4464 Winchester Hills Ln Pinson, AL | 3.0 | 2.0 | 1500 | $1,750 | $1.17 | 11d | 1 | 1.43mi |
| 2543 Hampstead Dr Birmingham, AL | 2.0 | 2.5 | 1272 | $1,123 | $0.88 | 23d | 1 | 1.46mi |
| 341 Argonne Dr NE Center Point, AL | 3.0 | 1.0 | 1040 | $1,300 | $1.25 | 2d | 1 | 1.48mi |
| 1729 Tall Oak Cir Birmingham, AL | 3.0 | 2.0 | 1403 | $1,630 | $1.16 | 1d | 1 | 1.48mi |
| 1753 Tall Oak Cir Birmingham, AL | 3.0 | 2.0 | 1380 | $1,225 | $0.89 | 3d | 1 | 1.50mi |
Listing history 2 events
-
2026-06-19remarks 623-char remark
-
2026-06-19$114,900 Active 1 DOM
ⓘ Source: listings_history table (triggers on properties + properties_extension) + one-shot
backfill from property_details.listing_events for pre-trigger history.
Tax reassessment forecast AL · Resets to sale price
- Current annual tax
- $1,325 · $110/mo
- Projected year-2 tax
- $1,325 · $110/mo
- Expected delta
- $0/yr ($0/mo · 0.0%)
ⓘ Screening estimate from a state-policy table — verify with the county assessor before closing.
Climate risk First Street
- Flood 1/10 Low FEMA zone X (unshaded) · 0% chance over 30 yrs
- Wildfire 3/10 Moderate
- Heat 6/10 Major 7 d/yr ≥105°F today · 19 d/yr by 30 yrs out
- Wind 6/10 Major 27% chance of damaging wind over 30 yrs
- Air quality 5/10 Major 7 unhealthy d/yr today · 9 by 30 yrs out
Nearby sold comps map
Loading sold comps map…
Walkable amenities ~0.75 mi
Loading nearby amenities…
Taxation est. · year 1
- Rental income
- $15,787
- − Mortgage interest
- −$6,436
- − Property taxes
- −$1,325
- − Insurance
- −$574
- − Repairs & maintenance
- −$1,263
- − Management
- −$1,263
- − Depreciation
- −$3,343
- Taxable income
- $1,584
- Est. tax owed @ 24.0%
- −$380
- After-tax cash flow
- $2,962/yr
For passive investors: Depreciation is non-cash, so a rental often shows a tax loss while cash-flowing — sheltering income. Rental losses are passive: they offset passive income freely, and up to $25,000/yr can offset ordinary (W-2) income if you actively participate and your MAGI is under $100k (phasing out to $0 by $150k); unused losses carry forward. On sale, claimed depreciation is recaptured at up to 25%, and gains may owe capital-gains tax (a 1031 exchange can defer both). Figures are a year-1 estimate at your 24.0% rate — not tax advice; consult a CPA.
Schools (NCES district)
- District
- Jefferson County
- NCES district ID
- 0101920
- Math proficiency
- 9% ▼ -24.00%
- Reading proficiency
- 32% ▼ -5.00%
- Median HH income
- $51,712
- Composite
- 18.4/100
- National rank
- #8937
- State rank
- #104 of 129 in AL
Livability — Center Point
- Score
- 63/100
- State rank
- #193
- US rank
- #15671
Category grades
Schools grade is shown separately in the Schools card above.
Census & demographics
- County
- Jefferson County · 527,445 people
- City population
- 43,903
- Metro
- Birmingham-Hoover, AL
- Population (ZIP)
- 43,903
- Household income
- $52,793
- Rent vs Own
- Severe rent burden
- 1729.0
Population outlook (Jefferson County) Hauer SSP2
- Today (2025)
- 669,185 people
- By 2030
- 669,694 · +0.1%
- By 2040
- 661,388 · -1.2%
- By 2050
- 643,086 · -3.9%
- By 2075
- 577,267 · -13.7%
- By 2100
- 474,758 · -29.1%
Race, ethnicity, and origin ACS 2023
- Neighborhood character
- Predominantly Black (75%)
- Race & ethnicity
- Black 75% White 15% Hispanic / Latino 7% Two or more races 3%
- Hispanic origin (detail)
- Mexican 4%
- Common ancestry
- Lithuanian 1% Italian 1% Slovak 1%
- Foreign-born
- 4% · Canada
- Languages at home
- 92% English-only · Spanish 7%
Political lean MEDSL · Jefferson
- 2024 margin
- D (+10.4) · D 54.6% · R 44.2% · Other 1.2%
- 2008→2024 swing
- +5.4pp toward D · 2008: 5.1pp · 2024: 10.4pp
- All cycles
- 2024: D+10.4 2020: D+13.2 2016: D+7.2 2012: D+6.0 2008: D+5.1
Not yet ingested
- Civics
- —
Market trends
- HPI YoY
- ▼ -112.97%
- Current HPI
- 215.0607
- Rent YoY
- ▲ 3.04%
- Metro
- Birmingham-Hoover, AL
- State GDP YoY
- ▲ 2.94%
- F500 in state
- 4
Industry mix (Fortune 500 HQ in AL)
| Industry | F500 HQs | Revenue |
|---|---|---|
| Financial Services | 1 | $8B |
|
||
| Healthcare | 1 | $5B |
|
||
Price history
+183.7% since first listed11 events — show timeline
- 2026-06-18 Listed $114,900 Greater Alabama MLS
- 2023-12-07 Sold (Public Records) $7,899,000 Public Records
- 2022-03-01 Sold (Public Records) $120,880 Public Records
- 2022-02-13 Price Changed $950 RENT.
- 2019-09-30 Sold (Public Records) $85,000 Public Records
- 2019-09-27 Sold (MLS) $85,000 Greater Alabama MLS
- 2019-08-10 Contingent — Greater Alabama MLS
- 2019-07-16 Price Changed $108,000 Greater Alabama MLS
- 2019-06-28 Listed $110,000 Greater Alabama MLS
- 2019-06-27 Coming Soon $110,000 Greater Alabama MLS
- 1986-01-01 Sold (Public Records) $40,500 Public Records
Property tax history
+14.2%/yrLatest (2025): $1,325 · +7.0% YoY. Source: county tax records.
Cash-flow waterfall
monthlySold comps — $/sqft
last 12 mo · ≤1 miLoading sold comps…