1122 Millview Dr #604 · Arlington, TX
Flood risk 1/10 · Minimal
- FEMA flood zone
- X (unshaded)
- Chance of flooding over 30 yrs
- 0.0%
- Est. flood insurance / yr
- $507 – $1,088
Fire risk 2/10 · Minimal
- Est. fire insurance / yr
- $1,222 – $2,270
Heat risk 8/10 · Major
- Hot days now (above 109°F)
- 7 days/yr
- Hot days in 30 yrs
- 24 days/yr
Wind risk 6/10 · Moderate
- Chance of severe wind over 30 yrs
- 27.0%
Air-quality risk 3/10 · Minor
- Unhealthy air days now
- 2 days/yr
- Unhealthy air days in 30 yrs
- 3 days/yr
Risk factors via First Street. Map © Google.
Why this score? — see what drove the C- grade
The composite is a weighted blend of 9 inputs, each scored 0–100. Each bar is that input's sub-score; the figure is the points it added to the 100-point composite (weight × sub-score).
- ARV discount +15.0/15.0
- Cash flow +13.2/30.0
- 1% rule +7.9/10.0
- DSCR +4.0/10.0
- Livability +3.9/5.0
- Rent growth +3.5/5.0
- Schools +2.5/10.0
- Condition / age +2.5/5.0
- Appreciation +0.0/10.0
$115,000
🖨 Deal sheet 📄 Offer letter ✓ Due diligence
Listing remarks MLS
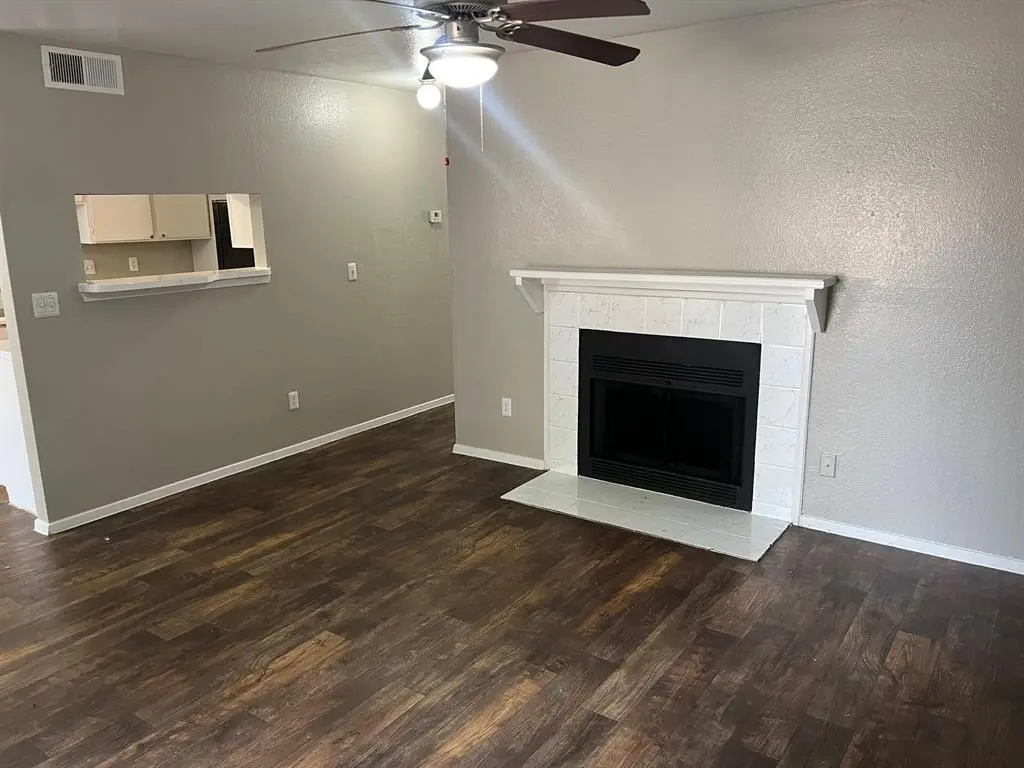
Welcome to your ideal home or investment! This 2-bedroom, 2-bath condo is in a prime location, offering convenience and comfort. Inside, you'll find stylish vinyl flooring and plenty of natural light. The spacious master bedroom features a large closet, while the second bedroom is perfect for guests or a home office. The living room is great for relaxing or entertaining, and the balcony adds to the charm. Close to shopping, dining, and public transport, this condo is a fantastic find at an affordable price. Schedule a showing today and make it yours!
Key facts
- Large closet
- Balcony
- Natural light
Tags
Neighborhood map
What this means for you Summary
Snapshot
- This is a 2-bed/2.0-bath townhouse listed at $115k.
Deal economics
- At list price, monthly cash flow is $-2 ($-27/yr) — negative.
- To cash-flow at today's rent, offer at most $115k (0.3% below list).
- Meets the 1% rule at list price ($1k rent vs $115k).
- Recommended offer: $105k (9.0% below list) — sets the bar for market timing.
- Cap rate 6.3% vs local median 3.7% in Arlington — top-decile yield for the area; either an underpriced asset or a hidden risk that comps aren't pricing in. Stress-test before assuming the spread holds.
Location & tenants
- Location reads 78/100 on livability (#75 in TX, #2,697 nationally) — a middle-class / working-renter tenant base. Strengths: amenities A+, cost of living A+, housing A+; Watch: schools D+, crime F, commute F.
- Arlington ISD (urban): math 24% / reading 34% proficiency, ranked #629 of 826 in TX (top 76%) — low school quality limits family demand, transient renter base, plan for 1-2y turnover.
- Market conditions: Rents rising (+4.0%/yr); 144 active listings in the ZIP; 40 comparable units currently listed for rent nearby; rentals at typical pace (median 25d on market — plan ~3-4 weeks tenant-placement turnaround); 42% of comp listings sitting > 30 days — soft ceiling on asking rent; solid renter incomes; 18,938 units permitted in Tarrant County in 2024 (8,336 in 5+ unit buildings).
Forward outlook
- Local home prices are declining (-3.0%/yr); year-one equity from $795 of loan paydown is wiped out by about $3k of value loss. Plan a longer hold.
- Tarrant County population projected at +41% by 2050 — long-run rental-demand tailwind backs the buy-and-hold thesis.
Negotiation context
- It's been on market 115 days — a 9% lower offer ($105k) is reasonable based on typical stale-listing flexibility.
Risks & watch-outs
- Climate carrying-cost: major wind risk, 27% chance of damaging wind over 30y; extreme-heat days projected 7→24/yr by 2055 (HVAC capex compounding) — expect insurance premiums to compound above CPI over the hold.
Questions for the listing agent
- What do current leases actually rent for vs. the listed asking? Can we see a recent rent roll and the last 12 months of T-12 income?
- It's been on market 115 days. Have you received any prior offers? Is the seller open to a 9% concession, seller financing, or rate buy-down credit?
- What does the HOA fee cover, when was the last increase, and are there any pending special assessments or reserve-fund shortfalls?
- Why hasn't it sold? Are there any deal-killer items the seller is aware of (foundation, flood, title, zoning, code violations)?
- Is there a deadline driving the sale (1031 exchange, divorce, estate, relocation)? That informs how much negotiation room exists.
- Schools are D-rated, which usually means shorter tenancies and higher turnover. Who's the typical renter profile here, and what's been the actual vacancy rate?
- Crime grade is F in this area — have there been break-ins, vandalism, or insurance claims at this property in the last 3 years? What carrier currently insures it and at what premium?
- What's the average days-on-market for RENTAL listings here right now (not sales)? A rising rental-DOM trend means longer vacancies and softer asking-rent achievability than the comps imply.
- What's the recent tenant-quality profile in this submarket — average credit score on applications, eviction rate, late-payment / NSF rate, and stable-employment percentage? A property-management company in the area should have these aggregated.
- How much new for-sale + rental construction is in the pipeline within 1–3 miles? Heavy new supply typically softens prices + rents 12–24 months out; constrained supply supports both.
Investment metrics
- 1% rule
- 1.29% ✓
- Cap rate
- 6.27%
- Cash-on-cash
- -0.08%
- DSCR
- 1.00
- GRM
- 6.5
CMA / ARV
- ARV (median comp)
- $141,702
- List price
- $115,000
- Delta
- -18.84%
- Verdict
- UNDERPRICED
- Comps
- 20 within 1.0 mi
Show comp detail 9 sales within ~0.75 mi
| Address | Dist | Beds/Ba | Sqft | Sold | Price | $/sf | Match |
|---|---|---|---|---|---|---|---|
| 1200 Alder Dr #1403 | 0.06mi | 2/2.0 | 946 (0%) | 4mo | $125,000 | $132 | 93 |
| 1122 Millview Dr #503 | 0.03mi | 2/2.0 | 946 (0%) | 8mo | $115,000 | $122 | 92 |
| 1122 Millview Dr #1404 | 0.06mi | 2/2.0 | 950 (+0%) | 11mo | $125,000 | $132 | 87 |
| 1122 Millview Dr #1804 | 0.08mi | 2/2.0 | 946 (0%) | 11mo | $125,000 | $132 | 87 |
| 1122 Millview Dr #504 | 0.03mi | 2/2.0 | 946 (0%) | 16mo | $148,000 | $156 | 85 |
| 1122 Millview Dr #302 | 0.04mi | 2/2.0 | 1,000 (+6%) | 9mo | $150,000 | $150 | 81 |
| 1122 Millview Dr #401 | 0.02mi | 2/2.0 | 1,000 (+6%) | 20mo | $150,000 | $150 | 73 |
| 1122 Millview Dr #1606 | 0.10mi | 2/2.0 | 1,000 (+6%) | 22mo | $150,000 | $150 | 68 |
| 1608 Pecan Chase Cir #24 | 0.22mi | 2/1.0 | 818 (-14%) | 16mo | $125,000 | $153 | 50 |
Match score weights: distance 35% · size 25% · config 20% · recency 20%. Top-matched comps best support the ARV.
Projected returns pro-forma
-3.0% appreciation · 3.98% rent growth · sell at horizon
- IRR
- -14.6%
- Equity multiple
- 0.47×
- Total profit
- $-17,054
- Equity at exit
- $17,147
- IRR
- -3.4%
- Equity multiple
- 0.76×
- Total profit
- $-7,850
- Equity at exit
- $9,943
Cash invested: $32,200 (down + closing). Projections, not guarantees.
Landlord ↔ Tenant lean methodology
- Overall (STATE)
- 87 Strongly Landlord-Friendly
- State Texas
- 87 Strongly Landlord-Friendly · R+5
- County
- — inherits STATE
- City
- — inherits STATE
ZIP-level market 76012
- Rents YoY
- 4.0%
- Active inventory
- 144
- Price-to-rent
- 6.5×
Monthly cashflow live
- Estimated rent
- $1,478 high interval (Pro) →
- Mortgage (P&I)
- −$603
- Tax from tax record
- −$228 /mo · $2,733/yr
- Insurance
- −$48
- HOA
- −$291
- Vacancy / Maint / Mgmt
- −$310
- Net cashflow
- $-2
Break-even live
UW: 25.0% down · 7.5% · 30yr · 1.5% tax · 5.0% vac · 8.0% maint · 8.0% mgmt
Financing live
Cash to close
- Down payment
- $28,750
- Closing costs
- $3,450
- Reserves months
- —
- Total cash needed
- —
Loan-product check · same deal, 3 products live
Conventional
25% down · 7.5% · 30yr
- Down + closing
- —
- Monthly P&I
- —
- Monthly cashflow
- —
- DSCR
- —
- Eligible?
- —
Personal DTI + credit; lowest rate.
DSCR
20% down · 8.5% · 30yr
- Down + closing
- —
- Monthly P&I
- —
- Monthly cashflow
- —
- DSCR
- —
- Eligible?
- —
No personal income docs; deal must DSCR.
Hard money
10% down · 12.0% · 12mo
- Down + closing
- —
- Monthly P&I
- —
- Monthly cashflow
- —
- DSCR
- —
- Eligible?
- —
Short-term bridge; refi at stabilization.
Rent comps 40 comps
| Address | Beds | Baths | Sqft | Rent | $/sqft | DOM | Units | Dist |
|---|---|---|---|---|---|---|---|---|
| 1119 Park Vista Dr Unit 506 Arlington, TX | 2.0 | 2.0 | 1000 | $1,525 | $1.52 | 24d | 1 | 0.05mi |
| 1708 Park Vista Dr Unit 3104 Arlington, TX | 2.0 | 2.0 | 1000 | $1,525 | $1.52 | 24d | 1 | 0.09mi |
| 1122 Millview Dr #3104 Arlington, TX | 2.0 | 2.0 | 1000 | $1,525 | $1.52 | 24d | 1 | 0.10mi |
| 1736 W Randol Mill Rd Arlington, TX | 2.0 | 1.0–2.0 | 629 | $1,825 | $2.90 | 14d | 1 | 0.10mi |
| 1204 Alder Dr Unit 1502 Arlington, TX | 2.0 | 2.0 | 1000 | $1,525 | $1.52 | 43d | 1 | 0.11mi |
| 1705 Park Vista Dr Unit 2901 Arlington, TX | 2.0 | 2.0 | 1000 | $1,525 | $1.52 | 24d | 1 | 0.12mi |
| 1122 Millview Dr #2401 Arlington, TX | 2.0 | 2.0 | 1000 | $1,485 | $1.49 | 10d | 1 | 0.13mi |
| 1208 Park Vista Dr Unit 2401 Arlington, TX | 2.0 | 2.0 | 1000 | $1,485 | $1.49 | 18d | 1 | 0.13mi |
| 1614 Pecan Chase Cir #59 Arlington, TX | 2.0 | 1.0 | 851 | $1,350 | $1.59 | 5d | 1 | 0.20mi |
| 1608 Pecan Chase Cir Arlington, TX | 1.0 | 1.0 | 627 | $1,995 | $3.18 | 43d | 1 | 0.22mi |
| 1608 Pecan Chase Cir Arlington, TX | 1.0–2.0 | 1.0 | 751 | $1,795 | $2.39 | 12d | 2 | 0.22mi |
| 1726 W Sanford St Apt D Arlington, TX | 2.0 | 1.5 | 1108 | $1,275 | $1.15 | 43d | 1 | 0.59mi |
| 1726 W Sanford St Apt D Arlington, TX | 2.0 | 1.5 | 1108 | $1,275 | $1.15 | 20d | 1 | 0.59mi |
| 1724 W Sanford St Unit D Arlington, TX | 1.0 | 1.0 | 620 | $1,150 | $1.85 | 2d | 1 | 0.60mi |
| 1913 Nolen Ct Apt A Arlington, TX | 2.0 | 1.5 | 1050 | $1,295 | $1.23 | 24d | 1 | 0.65mi |
| 1705 Fitzgerald Ct Arlington, TX | 2.0 | 1.0 | 900 | $1,150 | $1.28 | 7d | 1 | 0.68mi |
| 2637 W Randol Mill Rd Unit 2643-B Arlington, TX | 2.0 | 1.0 | 968 | $1,150 | $1.19 | 43d | 1 | 0.70mi |
| 607 McQueary St Arlington, TX | 2.0 | 1.0 | 900 | $1,250 | $1.39 | 43d | 1 | 0.71mi |
| 605 McQueary St Arlington, TX | 2.0 | 1.0 | 900 | $1,250 | $1.39 | 43d | 1 | 0.71mi |
| 1707 Tina Marie Rd Unit A Arlington, TX | 3.0 | 2.0 | 1097 | $1,900 | $1.73 | 43d | 1 | 0.75mi |
| 2001 Wesley Dr Apt A Arlington, TX | 1.0 | 1.0 | 674 | $995 | $1.48 | 43d | 1 | 0.76mi |
| 511 Oakwood Ln Arlington, TX | 2.0 | 2.0 | 800 | $1,400 | $1.75 | 43d | 1 | 0.81mi |
| 2005 Minnie Dr Unit 1A Arlington, TX | 2.0 | 1.0 | 943 | $1,525 | $1.62 | 4d | 1 | 0.82mi |
| 2009 Minnie Dr Arlington, TX | 2.0 | 1.0 | 1023 | $1,450 | $1.42 | 2d | 1 | 0.82mi |
| 2208 Viewtop Ln Unit A Arlington, TX | 2.0 | 1.5 | 1010 | $1,400 | $1.39 | 43d | 1 | 0.85mi |
| 1728 Crest Point Dr Arlington, TX | 1.0 | 1.0 | 641 | $1,100 | $1.72 | 43d | 1 | 0.85mi |
| 2017 Oakwood Ct Unit 2017 Arlington, TX | 3.0 | 1.5 | 1100 | $1,800 | $1.64 | 43d | 1 | 0.88mi |
| 1741 Crest Grove Dr Arlington, TX | 2.0 | 1.0 | 696 | $1,050 | $1.51 | 43d | 1 | 0.88mi |
| 2040 Minnie Dr Arlington, TX | 2.0 | 1.5 | 1076 | $1,485 | $1.38 | 24d | 1 | 0.88mi |
| 1506 Clover Hill Rd Arlington, TX | 2.0 | 2.0 | 913 | $1,173 | $1.28 | 43d | 1 | 1.06mi |
| 505 N Bowen Rd Arlington, TX | 1.0–2.0 | 1.0 | 610 | $1,085 | $1.78 | 1d | 11 | 1.09mi |
| 1727 Westview Ter Arlington, TX | 1.0–2.0 | 1.5 | 859 | $1,772 | $2.06 | 2d | 10 | 1.15mi |
| 1731 Westview Ter Arlington, TX | 1.0 | 1.0 | 692 | $1,060 | $1.53 | 43d | 1 | 1.15mi |
| 901 Greenway Glen Dr Arlington, TX | 1.0 | 1.0 | 656 | $1,158 | $1.77 | 15d | 1 | 1.20mi |
| 901 Greenway Glen Dr Arlington, TX | 1.0 | 1.0 | 656 | $1,175 | $1.79 | 12d | 1 | 1.20mi |
| 901 Greenway Glen Dr Arlington, TX | 1.0–2.0 | 1.0–2.0 | 818 | $1,524 | $1.86 | 3d | 27 | 1.20mi |
| 901 Greenway Glen Dr Arlington, TX | 2.0 | 2.0 | 981 | $1,473 | $1.50 | 22d | 1 | 1.20mi |
| 901 Greenway Glen Dr Arlington, TX | 2.0 | 2.0 | 981 | $1,390 | $1.42 | 18d | 1 | 1.20mi |
| 1524 Chukka Dr Arlington, TX | 1.0 | 1.0 | 656 | $1,020 | $1.55 | 43d | 1 | 1.21mi |
| 9001 Randol Mill Rd Unit 9058 Fort Worth, TX | 2.0 | 2.0 | 917 | $1,250 | $1.36 | 43d | 1 | 1.25mi |
HOA detail
- Monthly dues
- $291 · $3,492/yr
Listing history 15 events
-
2026-06-18days on market $115,000 Active 115 DOM
-
2026-06-17price $115,000 Active 114 DOM
-
2026-06-17days on market $130,000 Active 114 DOM
-
2026-06-16days on market $130,000 Active 113 DOM
-
2026-06-15days on market $130,000 Active 112 DOM
-
2026-06-13days on market $130,000 Active 110 DOM
-
2026-06-09days on market $130,000 Active 106 DOM
-
2026-06-08days on market $130,000 Active 105 DOM
-
2026-06-07days on market $130,000 Active 104 DOM
-
2026-06-04days on market $130,000 Active 101 DOM
-
2026-06-03days on market $130,000 Active 100 DOM
-
2026-06-02days on market $130,000 Active 99 DOM
-
2026-06-01days on market $130,000 Active 98 DOM
-
2026-05-31days on market $130,000 Active 97 DOM
-
2026-02-23$130,000 Active 556-char remark
Show marketing remark (556 chars)
Welcome to your ideal home or investment! This 2-bedroom, 2-bath condo is in a prime location, offering convenience and comfort. Inside, you'll find stylish vinyl flooring and plenty of natural light. The spacious master bedroom features a large closet, while the second bedroom is perfect for guests or a home office. The living room is great for relaxing or entertaining, and the balcony adds to the charm. Close to shopping, dining, and public transport, this condo is a fantastic find at an affordable price. Schedule a showing today and make it yours!
ⓘ Source: listings_history table (triggers on properties + properties_extension) + one-shot
backfill from property_details.listing_events for pre-trigger history.
Tax reassessment forecast TX · Resets to sale price
- Current annual tax
- $2,733 · $228/mo
- Projected year-2 tax
- $2,733 · $228/mo
- Expected delta
- $0/yr ($0/mo · 0.0%)
ⓘ Screening estimate from a state-policy table — verify with the county assessor before closing.
Climate risk First Street
- Flood 1/10 Low FEMA zone X (unshaded) · 0% chance over 30 yrs
- Wildfire 2/10 Low
- Heat 8/10 Severe 7 d/yr ≥109°F today · 24 d/yr by 30 yrs out
- Wind 6/10 Major 27% chance of damaging wind over 30 yrs
- Air quality 3/10 Moderate 2 unhealthy d/yr today · 3 by 30 yrs out
Nearby sold comps map
Loading sold comps map…
Walkable amenities ~0.75 mi
Loading nearby amenities…
Taxation est. · year 1
- Rental income
- $17,734
- − Mortgage interest
- −$6,442
- − Property taxes
- −$2,733
- − Insurance
- −$575
- − Repairs & maintenance
- −$1,419
- − Management
- −$1,419
- − HOA
- −$3,492
- − Depreciation
- −$3,345
- Taxable loss
- −$1,691
- Est. tax savings @ 24.0%
- +$406
- After-tax cash flow
- $379/yr
For passive investors: Depreciation is non-cash, so a rental often shows a tax loss while cash-flowing — sheltering income. Rental losses are passive: they offset passive income freely, and up to $25,000/yr can offset ordinary (W-2) income if you actively participate and your MAGI is under $100k (phasing out to $0 by $150k); unused losses carry forward. On sale, claimed depreciation is recaptured at up to 25%, and gains may owe capital-gains tax (a 1031 exchange can defer both). Figures are a year-1 estimate at your 24.0% rate — not tax advice; consult a CPA.
Schools (NCES district)
- District
- Arlington ISD
- NCES district ID
- 4808700
- Math proficiency
- 24% ▼ -21.00%
- Reading proficiency
- 34% ▼ -8.00%
- Median HH income
- $50,873
- Composite
- 25.42/100
- National rank
- #7458
- State rank
- #629 of 826 in TX
Livability — Arlington
- Score
- 78/100
- State rank
- #75
- US rank
- #2697
Category grades
Schools grade is shown separately in the Schools card above.
Census & demographics
- Census place
- Arlington, TX
- County
- Tarrant County · 2,033,669 people
- City population
- 366,588
- Metro
- Dallas-Fort Worth-Arlington, TX
- Population (ZIP)
- 27,991
- Household income
- $88,141
- Rent vs Own
- Severe rent burden
- 1121.0
Population outlook (Tarrant County) Hauer SSP2
- Today (2025)
- 2,380,417 people
- By 2030
- 2,578,900 · +8.3%
- By 2040
- 2,974,995 · +25.0%
- By 2050
- 3,350,489 · +40.8%
- By 2075
- 4,216,909 · +77.2%
- By 2100
- 4,741,527 · +99.2%
Race, ethnicity, and origin ACS 2023
- Neighborhood character
- Diverse neighborhood (Simpson 0.65)
- Race & ethnicity
- White 46% Hispanic / Latino 34% Two or more races 20% Black 15% Asian 2%
- Hispanic origin (detail)
- Mexican 25% Cuban 3%
- Common ancestry
- Slovak 2% Italian 2% Lithuanian 1%
- Foreign-born
- 20% · Canada, Jamaica
- Languages at home
- 68% English-only · Spanish 27% French/Haitian/Cajun 2% Arabic 1%
Political lean MEDSL · Tarrant
- 2024 margin
- Lean R (+5.1) · D 46.7% · R 51.9% · Other 1.4%
- 2008→2024 swing
- +6.6pp toward D · 2008: -11.7pp · 2024: -5.1pp
- All cycles
- 2024: R+5.1 2020: D+0.2 2016: R+8.7 2012: R+15.7 2008: R+11.7
Not yet ingested
- Civics
- —
Market trends
- HPI YoY
- ▼ -281.05%
- Current HPI
- 259.0255
- Rent YoY
- ▲ 3.98%
- Metro
- Dallas-Fort Worth-Arlington, TX
- State GDP YoY
- ▲ 3.95%
- F500 in state
- 110
Industry mix (Fortune 500 HQ in TX)
| Industry | F500 HQs | Revenue |
|---|---|---|
| Energy | 16 | $1,198B |
|
||
| Technology | 5 | $198B |
|
||
| Engineering / Construction | 4 | $72B |
|
||
| Energy Services | 3 | $60B |
|
||
| Utilities | 3 | $41B |
|
||
| Healthcare | 2 | $330B |
|
||
Price history
1 event — show timeline
- 2026-02-23 Listed $130,000 NTREIS
Property tax history
-1.4%/yrLatest (2025): $2,733 · -12.4% YoY. Source: county tax records.
Cash-flow waterfall
monthlySold comps — $/sqft
last 12 mo · ≤1 miLoading sold comps…