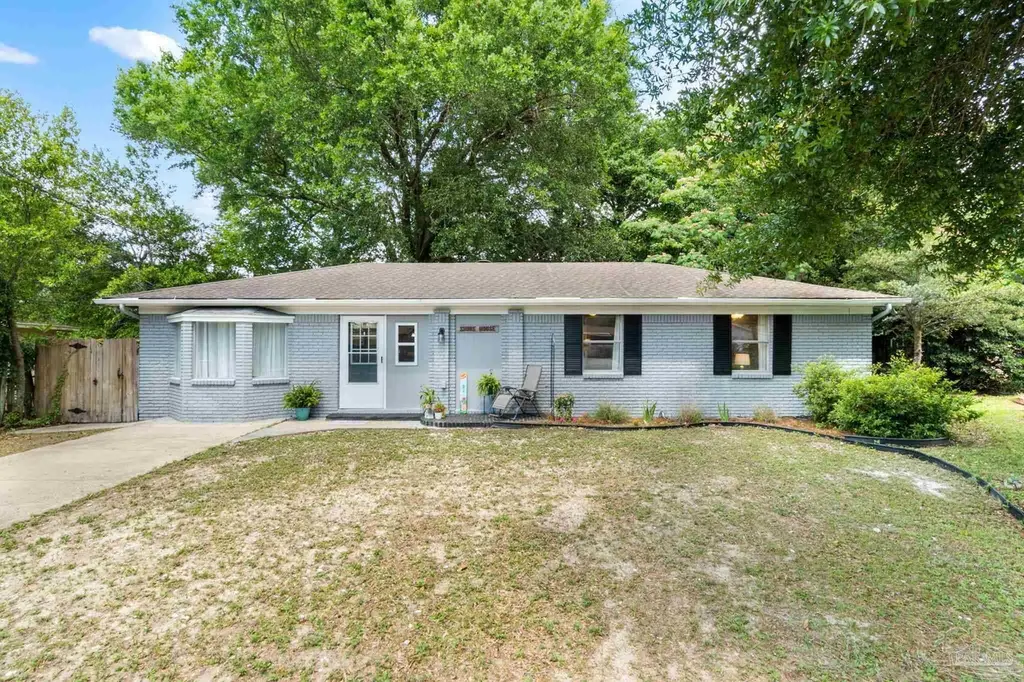
2955 Newton Dr · Pensacola, FL
Flood risk 1/10 · Minimal
- FEMA flood zone
- X (unshaded)
- Chance of flooding over 30 yrs
- 0.0%
- Est. flood insurance / yr
- $507 – $1,088
Fire risk 1/10 · Minimal
- Est. fire insurance / yr
- $947 – $1,759
Heat risk 10/10 · Severe
- Hot days now (above 105°F)
- 7 days/yr
- Hot days in 30 yrs
- 22 days/yr
Wind risk 9/10 · Severe
- Chance of severe wind over 30 yrs
- 99.0%
Air-quality risk 1/10 · Minimal
- Unhealthy air days now
- 0 days/yr
- Unhealthy air days in 30 yrs
- 0 days/yr
Risk factors via First Street. Map © Google.
Why this score? — see what drove the D+ grade
The composite is a weighted blend of 9 inputs, each scored 0–100. Each bar is that input's sub-score; the figure is the points it added to the 100-point composite (weight × sub-score).
- Cash flow +15.4/30.0
- ARV discount +9.1/15.0
- DSCR +4.7/10.0
- Livability +4.2/5.0
- 1% rule +3.8/10.0
- Schools +3.6/10.0
- Rent growth +3.3/5.0
- Condition / age +2.5/5.0
- Appreciation +0.0/10.0
$300,000
🖨 Deal sheet 📄 Offer letter ✓ Due diligence
Listing remarks
Welcome to this beautifully remodeled home, perfectly nestled off Scenic Hwy on a quiet cul-de-sac, offering the ideal blend of luxury and location. With two spacious primary suites—including one with its own private entrance—this home is perfect for multi-generational living or hosting guests in comfort and style. Inside, you'll find luxury vinyl plank flooring, fresh paint, and a fully upgraded and remodeled kitchen, brand-new cabinets, gleaming countertops, and modern appliances ready to inspire your culinary adventures. The 4th bedroom would make a great office or whatever your heart desires. Bask in the natural light of the bright sunroom or step outside to your own private
Key facts
- Private entrance
- Neighborhood park
- Remodeled home
Tags
Property features AI
Finance
- HOA & community: No association
Exterior
- Parking: Open parking; Driveway
- Utilities: Public water; Public sewer; Copper electrical wiring
- Home design: Single-family home; One story; Resale property; Not attached to another property; Paved, public-maintained road access
- Construction: Brick construction; Slab foundation
- Exterior features: Back yard with privacy fencing; Deck; Shingle roof; Located on a cul-de-sac
Interior
- Kitchen: Remodeled kitchen (updated within the last 1–5 years); Dishwasher; Refrigerator; Gas water heater
- Bedrooms: Primary bedroom on the first floor (13 x 13); Second bedroom on the first floor (11.17 x 14.34); Third bedroom on the first floor (9.32 x 11.5)
- Flooring: Brick flooring; Carpet
- Bathrooms: Three full bathrooms; Remodeled bathrooms (total remodel within the last 1–5 years)
- Heating & cooling: Central heating; Central air; Ceiling fans for cooling
- Interior features: Ceiling fans; Crown molding; High-speed internet; Sun room; Drapery rods; Skylights
- Laundry & utility: Indoor laundry with washer/dryer hookups
Neighborhood map
What this means for you Summary
Snapshot
- This is a 4-bed/2.0-bath single-family listed at $300k.
Deal economics
- At list price, monthly cash flow is $114 ($1k/yr) — positive.
- The deal already cash-flows at list — no discount required.
- To meet the 1% rule (rent ≥ 1% of price), the offer needs to be $265k (11.6% below list).
- Recommended offer: $265k (11.6% below list) — sets the bar for 1% rule.
- Cap rate 6.7% vs local median 3.6% in Pensacola — top-decile yield for the area; either an underpriced asset or a hidden risk that comps aren't pricing in. Stress-test before assuming the spread holds.
Location & tenants
- Location reads 83/100 on livability (#53 in FL, #924 nationally) — a professional / high-income tenant draw. Strengths: commute A+, cost of living A+, housing A+.
- Escambia (suburban): math 40% / reading 45% proficiency, ranked #56 of 73 in FL (top 77%) — families likely to look elsewhere, expect single-tenant / working-renter base with shorter leases.
- Market conditions: Rents rising (+3.4%/yr); 240 active listings in the ZIP; 4 comparable units currently listed for rent nearby; rentals at typical pace (median 24d on market — plan ~3-4 weeks tenant-placement turnaround); 1,479 units permitted in Escambia County in 2024 (0 in 5+ unit buildings).
- This rent runs 45% of the median local income ($71k/yr) — at the standard rent-burdened threshold; future hikes will face affordability resistance.
Forward outlook
- Local home prices are declining (-3.0%/yr); year-one equity from $2k of loan paydown is wiped out by about $9k of value loss. Plan a longer hold.
- Escambia County population projected at +13% by 2050 — modest demand growth; plan on rents tracking national, not racing it.
Negotiation context
- It's been on market 44 days — a 3% lower offer ($291k) is reasonable based on typical stale-listing flexibility.
- 15 sale attempts since 22y ago; this cycle's ask has dropped $20k (6%) from the opening price — seller is motivated, your offer sets the floor, not the list.
- Current owner paid $220k; 36% above their basis — modest negotiation headroom, anchor on the comps not their cost.
Risks & watch-outs
- Climate carrying-cost: severe wind risk, 99% chance of damaging wind over 30y; extreme-heat days projected 7→22/yr by 2055 (HVAC capex compounding) — expect insurance premiums to compound above CPI over the hold.
Questions for the listing agent
- It's been on market 44 days. Have you received any prior offers? Is the seller open to a 12% concession, seller financing, or rate buy-down credit?
- Built in 1973 — when were the roof, HVAC, electrical panel, plumbing, and water heater last replaced?
- Is there a deadline driving the sale (1031 exchange, divorce, estate, relocation)? That informs how much negotiation room exists.
- The area grade is low — what's the realistic commute time and amenity access for the typical tenant pool here? Any planned neighborhood developments (good or bad) we should know about?
- What's the average days-on-market for RENTAL listings here right now (not sales)? A rising rental-DOM trend means longer vacancies and softer asking-rent achievability than the comps imply.
- What's the recent tenant-quality profile in this submarket — average credit score on applications, eviction rate, late-payment / NSF rate, and stable-employment percentage? A property-management company in the area should have these aggregated.
- How much new for-sale + rental construction is in the pipeline within 1–3 miles? Heavy new supply typically softens prices + rents 12–24 months out; constrained supply supports both.
Investment metrics
- 1% rule
- 0.88% ✗
- Cap rate
- 6.75%
- Cash-on-cash
- 1.63%
- DSCR
- 1.07
- GRM
- 9.4
CMA / ARV
- ARV (median comp)
- $311,055
- List price
- $300,000
- Delta
- -3.55%
- Verdict
- FAIR
- Comps
- 20 within 1.0 mi
Show comp detail 12 sales within ~0.75 mi
| Address | Dist | Beds/Ba | Sqft | Sold | Price | $/sf | Match |
|---|---|---|---|---|---|---|---|
| 3121 Whistler Dr | 0.15mi | 3/2.0 (-1) | 1,625 (+4%) | 1mo | $349,000 | $215 | 79 |
| 3600 Summit Blvd | 0.47mi | 3/2.0 (-1) | 1,530 (-2%) | 4mo | $335,000 | $219 | 67 |
| 3621 Bonner Rd | 0.63mi | 3/2.0 (-1) | 1,540 (-1%) | 3mo | $399,900 | $260 | 62 |
| 3755 Firestone Blvd | 0.52mi | 3/2.0 (-1) | 1,625 (+4%) | 5mo | $320,000 | $197 | 59 |
| 761 Connell Dr | 0.70mi | 3/2.5 (-1) | 1,585 (+2%) | 1mo | $385,000 | $243 | 56 |
| 3251 Wythe Cir | 0.36mi | 3/2.0 (-1) | 1,376 (-12%) | 6mo | $235,000 | $171 | 54 |
| 3251 Braxton Cir | 0.41mi | 3/2.0 (-1) | 1,359 (-13%) | 3mo | $295,000 | $217 | 53 |
| 3540 Dunfries Rd | 0.54mi | 3/2.0 (-1) | 1,700 (+9%) | 3mo | $494,500 | $291 | 52 |
| 4020 Coppertree Ln | 0.68mi | 3/2.0 (-1) | 1,634 (+5%) | 5mo | $340,000 | $208 | 51 |
| 3505 Silvergate Way | 0.70mi | 3/2.0 (-1) | 1,395 (-10%) | 4mo | $279,900 | $201 | 42 |
| 3545 Blueridge Dr | 0.64mi | 3/2.0 (-1) | 1,736 (+12%) | 6mo | $347,000 | $200 | 41 |
| 3640 Maule Rd | 0.66mi | 3/2.0 (-1) | 1,782 (+15%) | 8mo | $480,000 | $269 | 33 |
Match score weights: distance 35% · size 25% · config 20% · recency 20%. Top-matched comps best support the ARV.
Projected returns pro-forma
-3.0% appreciation · 3.39% rent growth · sell at horizon
- IRR
- -13.3%
- Equity multiple
- 0.52×
- Total profit
- $-40,319
- Equity at exit
- $44,731
- IRR
- -3.8%
- Equity multiple
- 0.74×
- Total profit
- $-21,503
- Equity at exit
- $25,939
Cash invested: $84,000 (down + closing). Projections, not guarantees.
Landlord ↔ Tenant lean methodology
- Overall (STATE)
- 87 Strongly Landlord-Friendly
- State Florida
- 87 Strongly Landlord-Friendly · R+3
- County
- — inherits STATE
- City
- — inherits STATE
ZIP-level market 32503
- Rents YoY
- 3.4%
- Active inventory
- 240
- Price-to-rent
- 9.4×
Monthly cashflow live
- Estimated rent
- $2,651 medium interval (Pro) →
- Mortgage (P&I)
- −$1,573
- Tax from tax record
- −$282 /mo · $3,380/yr
- Insurance
- −$125
- HOA
- −$0
- Vacancy / Maint / Mgmt
- −$557
- Net cashflow
- $114
Break-even live
UW: 25.0% down · 7.5% · 30yr · 1.5% tax · 5.0% vac · 8.0% maint · 8.0% mgmt
Financing live
Cash to close
- Down payment
- $75,000
- Closing costs
- $9,000
- Reserves months
- —
- Total cash needed
- —
Loan-product check · same deal, 3 products live
Conventional
25% down · 7.5% · 30yr
- Down + closing
- —
- Monthly P&I
- —
- Monthly cashflow
- —
- DSCR
- —
- Eligible?
- —
Personal DTI + credit; lowest rate.
DSCR
20% down · 8.5% · 30yr
- Down + closing
- —
- Monthly P&I
- —
- Monthly cashflow
- —
- DSCR
- —
- Eligible?
- —
No personal income docs; deal must DSCR.
Hard money
10% down · 12.0% · 12mo
- Down + closing
- —
- Monthly P&I
- —
- Monthly cashflow
- —
- DSCR
- —
- Eligible?
- —
Short-term bridge; refi at stabilization.
Rent comps 4 comps
| Address | Beds | Baths | Sqft | Rent | $/sqft | DOM | Units | Dist |
|---|---|---|---|---|---|---|---|---|
| 3545 Hopestill Rd Pensacola, FL | 4.0 | 2.0 | 1984 | $2,400 | $1.21 | 23d | 1 | 0.54mi |
| 3547 Firestone Blvd Pensacola, FL | 4.0 | 2.0 | 2000 | $2,695 | $1.35 | 23d | 1 | 0.61mi |
| 3791 Maule Rd Pensacola, FL | 4.0 | 3.0 | 2000 | $3,250 | $1.62 | 23d | 1 | 0.65mi |
| 3014 Magnolia Ave Pensacola, FL | 3.0 | 2.0 | 1650 | $2,750 | $1.67 | 23d | 1 | 1.29mi |
Listing history 50 events
-
2026-06-14statusdays on market $300,000 Pending 44 DOM
-
2026-06-10days on market $300,000 Active 43 DOM
-
2026-06-09days on market $300,000 Active 42 DOM
-
2026-06-08days on market $300,000 Active 41 DOM
-
2026-06-07days on market $300,000 Active 40 DOM
-
2026-06-03days on market $300,000 Active 36 DOM
-
2026-06-02days on market $300,000 Active 35 DOM
-
2026-06-01days on market $300,000 Active 34 DOM
-
2026-05-31days on market $300,000 Active 33 DOM
-
2026-05-31days on market $300,000 Active 32 DOM
-
2026-05-11price $310,000 1462-char remark
-
2026-04-28$320,000 Active 1462-char remark
-
2026-04-27historical
-
2026-04-17price $320,000
-
2026-03-17$325,000 Active
-
2026-02-10historical
-
2026-01-19$320,000 Active
-
2025-11-09historical
-
2025-09-30price $328,000
-
2025-07-21price $335,000
-
2025-06-17price $339,977
-
2025-05-30price $350,000
-
2025-05-21$355,000 Active
-
2025-05-05historical
-
2025-04-16price $342,000
-
2025-04-08$349,000 Active
-
2023-02-02status Pending
-
2023-02-02soldstatus $220,000
-
2023-02-01soldstatus $220,000 Sold
-
2022-12-16historical Contingent
-
2022-11-28price $225,000
-
2022-11-09$250,000 Active
-
2022-04-07soldstatus $175,000
-
2020-01-30historical
-
2019-09-19$170,000
-
2018-09-15historical
-
2018-09-15historical
-
2018-04-20$177,900
-
2018-04-20$177,900
-
2018-04-20$177,900
-
2017-05-30soldstatus $162,500
-
2017-05-26soldstatus $162,500
-
2016-12-29$159,900
-
2016-12-27historical
-
2016-11-08$166,500
-
2008-06-10soldstatus $153,500
-
2008-06-05soldstatus $153,500
-
2008-04-29$147,500
-
2007-05-25historical
-
2007-01-13$184,900
ⓘ Source: listings_history table (triggers on properties + properties_extension) + one-shot
backfill from property_details.listing_events for pre-trigger history.
Tax reassessment forecast FL · Resets to sale price
- Current annual tax
- $3,380 · $282/mo
- Projected year-2 tax
- $3,380 · $282/mo
- Expected delta
- $0/yr ($0/mo · 0.0%)
ⓘ Screening estimate from a state-policy table — verify with the county assessor before closing.
Climate risk First Street
- Flood 1/10 Low FEMA zone X (unshaded) · 0% chance over 30 yrs
- Wildfire 1/10 Low
- Heat 10/10 Extreme 7 d/yr ≥105°F today · 22 d/yr by 30 yrs out
- Wind 9/10 Extreme 99% chance of damaging wind over 30 yrs
- Air quality 1/10 Low 0 unhealthy d/yr today · 0 by 30 yrs out
Nearby sold comps map
Loading sold comps map…
Walkable amenities ~0.75 mi
Loading nearby amenities…
Taxation est. · year 1
- Rental income
- $31,807
- − Mortgage interest
- −$16,805
- − Property taxes
- −$3,380
- − Insurance
- −$1,500
- − Repairs & maintenance
- −$2,545
- − Management
- −$2,545
- − Depreciation
- −$8,727
- Taxable loss
- −$3,694
- Est. tax savings @ 24.0%
- +$886
- After-tax cash flow
- $2,256/yr
For passive investors: Depreciation is non-cash, so a rental often shows a tax loss while cash-flowing — sheltering income. Rental losses are passive: they offset passive income freely, and up to $25,000/yr can offset ordinary (W-2) income if you actively participate and your MAGI is under $100k (phasing out to $0 by $150k); unused losses carry forward. On sale, claimed depreciation is recaptured at up to 25%, and gains may owe capital-gains tax (a 1031 exchange can defer both). Figures are a year-1 estimate at your 24.0% rate — not tax advice; consult a CPA.
Schools (NCES district)
- District
- Escambia
- NCES district ID
- 1200510
- Math proficiency
- 40% ▼ -9.00%
- Reading proficiency
- 45% ▼ -4.00%
- Median HH income
- $44,649
- Composite
- 36.04/100
- National rank
- #4773
- State rank
- #56 of 73 in FL
Livability — Pensacola
- Score
- 83/100
- State rank
- #53
- US rank
- #924
Category grades
Schools grade is shown separately in the Schools card above.
Census & demographics
- Census place
- Pensacola, FL
- County
- Escambia County · 301,722 people
- City population
- 237,636
- Metro
- Pensacola-Ferry Pass-Brent, FL
- Population (ZIP)
- 33,559
- Household income
- $71,411
- Rent vs Own
- Severe rent burden
- 948.0
Population outlook (Escambia County) Hauer SSP2
- Today (2025)
- 334,637 people
- By 2030
- 345,779 · +3.3%
- By 2040
- 364,828 · +9.0%
- By 2050
- 378,514 · +13.1%
- By 2075
- 403,220 · +20.5%
- By 2100
- 386,125 · +15.4%
Race, ethnicity, and origin ACS 2023
- Neighborhood character
- Predominantly White (68%)
- Race & ethnicity
- White 68% Black 20% Two or more races 6% Hispanic / Latino 5% Asian 2%
- Common ancestry
- Lithuanian 3% Italian 2% Romanian 2%
- Foreign-born
- 5% · Canada, China
- Languages at home
- 93% English-only · Spanish 3% Arabic 1% Tagalog/Filipino 1%
Political lean MEDSL · Escambia
- 2024 margin
- R (+19.5) · D 39.7% · R 59.2% · Other 1.1%
- 2008→2024 swing
- -0.2pp no change · 2008: -19.3pp · 2024: -19.5pp
- All cycles
- 2024: R+19.5 2020: R+15.1 2016: R+20.6 2012: R+20.6 2008: R+19.3
Not yet ingested
- Civics
- —
Market trends
- HPI YoY
- ▼ -300.02%
- Current HPI
- 294.4873
- Rent YoY
- ▲ 3.39%
- Metro
- Pensacola-Ferry Pass-Brent, FL
- State GDP YoY
- ▲ 3.28%
- F500 in state
- 36
Industry mix (Fortune 500 HQ in FL)
| Industry | F500 HQs | Revenue |
|---|---|---|
| Industrial Technology | 2 | $29B |
|
||
| Insurance | 2 | $17B |
|
||
| Retail | 1 | $60B |
|
||
| Technology Distribution | 1 | $58B |
|
||
| Homebuilding | 1 | $35B |
|
||
| Technology Manufacturing | 1 | $35B |
|
||
Price history
+100.1% since first listed44 events — show timeline
- 2026-06-11 Pending — PARMLS
- 2026-05-27 Price Changed $300,000 PARMLS
- 2026-05-11 Price Changed $310,000 PARMLS
- 2026-04-28 Listed $320,000 PARMLS
- 2026-04-27 Listing Removed — PARMLS
- 2026-04-17 Price Changed $320,000 PARMLS
- 2026-03-17 Listed $325,000 PARMLS
- 2026-02-10 Listing Removed — PARMLS
- 2026-01-19 Listed $320,000 PARMLS
- 2025-11-09 Listing Removed — PARMLS
- 2025-09-30 Price Changed $328,000 PARMLS
- 2025-07-21 Price Changed $335,000 PARMLS
- 2025-06-17 Price Changed $339,977 PARMLS
- 2025-05-30 Price Changed $350,000 PARMLS
- 2025-05-21 Listed $355,000 PARMLS
- 2025-05-05 Listing Removed — PARMLS
- 2025-04-16 Price Changed $342,000 PARMLS
- 2025-04-08 Listed $349,000 PARMLS
- 2023-02-02 Pending — PARMLS
- 2023-02-02 Sold (Public Records) $220,000 Public Records
- 2023-02-01 Sold (MLS) $220,000 PARMLS
- 2022-12-16 Contingent — PARMLS
- 2022-11-28 Price Changed $225,000 PARMLS
- 2022-11-09 Listed $250,000 PARMLS
- 2022-04-07 Sold (Public Records) $175,000 Public Records
- 2020-01-30 Listing Removed — PARMLS
- 2019-09-19 Listed $170,000 PARMLS
- 2018-09-15 Listing Removed — PARMLS
- 2018-09-15 Listing Removed — NAMLS
- 2018-04-20 Listed $177,900 PARMLS
- 2018-04-20 Listed $177,900 NAMLS
- 2018-04-20 Listed $177,900 ECAR
- 2017-05-30 Sold (Public Records) $162,500 Public Records
- 2017-05-26 Sold (MLS) $162,500 PARMLS
- 2016-12-29 Listed $159,900 PARMLS
- 2016-12-27 Listing Removed — PARMLS
- 2016-11-08 Listed $166,500 PARMLS
- 2008-06-10 Sold (Public Records) $153,500 Public Records
- 2008-06-05 Sold (MLS) $153,500 PARMLS
- 2008-04-29 Listed $147,500 PARMLS
- 2007-05-25 Listing Removed — PARMLS
- 2007-01-13 Listed $184,900 PARMLS
- 2004-08-06 Listing Removed — PARMLS
- 2004-06-03 Listed $149,900 PARMLS
Property tax history
+11.8%/yrLatest (2025): $3,380 · +15.8% YoY. Source: county tax records.
Cash-flow waterfall
monthlySold comps — $/sqft
last 12 mo · ≤1 miLoading sold comps…