 🏷️ Likely Rental
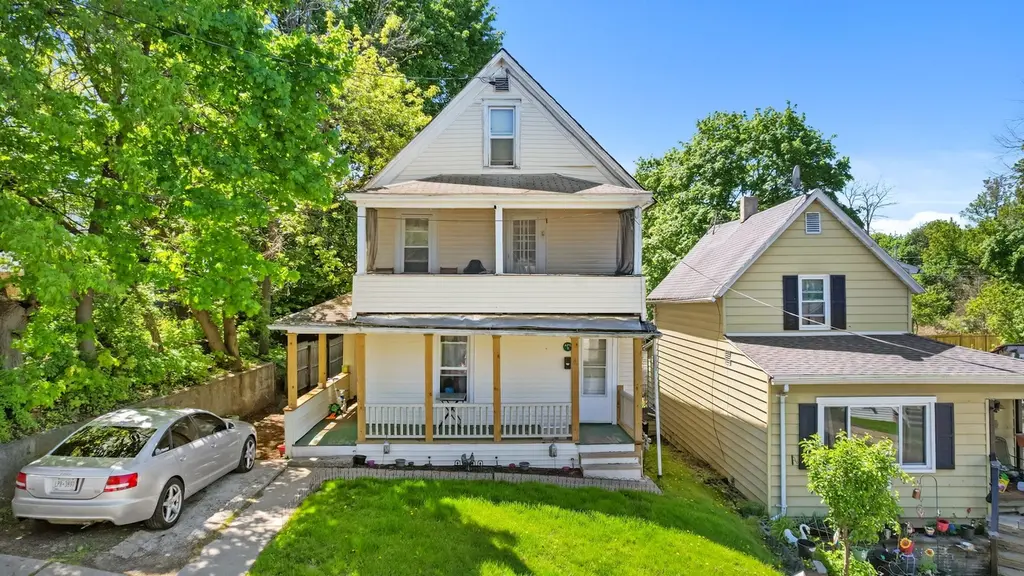
154 Saint Charles St · Johnson City, NY
Flood risk 2/10 · Minimal
- FEMA flood zone
- X
- Chance of flooding over 30 yrs
- 0.05%
- Est. flood insurance / yr
- $473 – $860
Fire risk 3/10 · Minor
- Est. fire insurance / yr
- $691 – $1,283
Heat risk 3/10 · Minor
- Hot days now (above 94°F)
- 7 days/yr
- Hot days in 30 yrs
- 16 days/yr
Wind risk 2/10 · Minimal
- Chance of severe wind over 30 yrs
- 1.0%
Air-quality risk 2/10 · Minimal
- Unhealthy air days now
- 0 days/yr
- Unhealthy air days in 30 yrs
- 1 days/yr
Risk factors via First Street. Map © Google.
Why this score? — see what drove the A grade
The composite is a weighted blend of 9 inputs, each scored 0–100. Each bar is that input's sub-score; the figure is the points it added to the 100-point composite (weight × sub-score).
- Cash flow +30.0/30.0
- ARV discount +15.0/15.0
- 1% rule +10.0/10.0
- DSCR +10.0/10.0
- Appreciation +10.0/10.0
- Rent growth +4.9/5.0
- Livability +3.8/5.0
- Schools +3.3/10.0
- Condition / age +2.5/5.0
$109,900
🖨 Deal sheet 📄 Offer letter ✓ Due diligence
Multi-family units
County records classify this as Multi-Family (2-4 Unit). Listing-text estimate: 1 unit. estimate disagrees with records
Listing remarks
Investor opportunity in the heart of Johnson City 154 St. Charles Street is offered at just $129,900 and is currently the second most affordable multi-family property on the market in Johnson City today. This fully occupied multi-family features long term tenants with current rents of $850 and $725 per month, generating steady cash flow from day one. Tenants pay all utilities except water, helping keep owner expenses low. Current annual taxes are approximately $4,700. Based on current rents and taxes, the property offers an approximate 11% cap rate before additional operating expenses. Whether you are looking to expand your portfolio, start investing, or secure a cash-flowing property in a
Key facts
- 0.32 acre lot
- Built 1904
- Listed 35 days
Property features AI
Finance
- Other: Zoning: res1
- Financial info: Two residential units with current rents: one unit rents for $850, the other for $725
Exterior
- Utilities: Public water; Public sewer
- Home design: Duplex residential income property; Level lot
- Construction: Wood siding; Stone foundation; Built above grade finished area: 2,026
- Exterior features: Covered, enclosed porch
Interior
- Kitchen: Refrigerator
- Bedrooms: One unit with 3 bedrooms; One unit with 2 bedrooms
- Flooring: Carpet; Hardwood
- Bathrooms: Two full bathrooms (total)
- Heating & cooling: Forced air heating; Ceiling fans
- Interior features: Gas water heater; Refrigerator; Carpet and hardwood flooring; Basement
- Laundry & utility: Gas water heater
Neighborhood map
What this means for you Summary
Snapshot
- This is a 2-bed/2.0-bath multifamily listed at $110k.
Deal economics
- At list price, monthly cash flow is $1k ($13k/yr) — positive.
- The deal already cash-flows at list — no discount required.
- Meets the 1% rule at list price ($3k rent vs $110k).
- Recommended offer: $107k (3.0% below list) — sets the bar for market timing.
- Cap rate 17.9% vs local median 6.2% in Johnson City — top-decile yield for the area; either an underpriced asset or a hidden risk that comps aren't pricing in. Stress-test before assuming the spread holds.
Location & tenants
- Location reads 76/100 on livability (#238 in NY, #3,739 nationally) — a middle-class / working-renter tenant base. Strengths: cost of living A+, housing A+, health & safety A+; Watch: crime F, employment D-.
- Johnson City Central School District (suburban): math 38% / reading 41% proficiency, ranked #535 of 590 in NY (top 91%) — families likely to look elsewhere, expect single-tenant / working-renter base with shorter leases.
- Zoned schools: Johnson City Elementary/Primary School (496 students, 55% FRL) — zoned schools at 55% FRL track the district average.
- Market conditions: Rents rising fast (+9.5%/yr); 99 active listings in the ZIP; 6 comparable units currently listed for rent nearby; rentals at typical pace (median 21d on market — plan ~3-4 weeks tenant-placement turnaround); 340 units permitted in Broome County in 2024 (269 in 5+ unit buildings).
- At $2,625/mo this rent would consume 53% of the median local household income ($59k/yr) (locally 1233% of renters already pay >50% of income on rent) — very limited rent-growth headroom before tenants either downsize or default.
Forward outlook
- In year one you build about $12k of equity ($760 loan paydown + $11k appreciation (10.0% local appreciation)).
- Broome County population projected at -13% by 2050 — secular population decline; favor cash flow + early exit over multi-decade hold.
- At projected returns (10.0% appreciation + 8.0% rent growth), your $31k cash investment doubles in ~2 years — after that, you're playing with house money.
- By year 4, paydown + projected appreciation supports a ~$42k cash-out refi (75% LTV) — recoverable capital for the next deal without selling this one.
Negotiation context
- It's been on market 36 days — a 3% lower offer ($107k) is reasonable based on typical stale-listing flexibility.
Risks & watch-outs
- Watch-outs: property tax is 4.3% of price; built in 1904 — expect roof / HVAC / electrical / plumbing capex.
Questions for the listing agent
- It's been on market 36 days. Have you received any prior offers? Is the seller open to a 3% concession, seller financing, or rate buy-down credit?
- Built in 1904 — when were the roof, HVAC, electrical panel, plumbing, and water heater last replaced?
- Property tax is high relative to price — has the assessment been appealed recently, and will the sale trigger a re-assessment?
- Is there a deadline driving the sale (1031 exchange, divorce, estate, relocation)? That informs how much negotiation room exists.
- Crime grade is F in this area — have there been break-ins, vandalism, or insurance claims at this property in the last 3 years? What carrier currently insures it and at what premium?
- What's the average days-on-market for RENTAL listings here right now (not sales)? A rising rental-DOM trend means longer vacancies and softer asking-rent achievability than the comps imply.
- What's the recent tenant-quality profile in this submarket — average credit score on applications, eviction rate, late-payment / NSF rate, and stable-employment percentage? A property-management company in the area should have these aggregated.
- How much new apartment / multifamily construction is in the pipeline within 1–3 miles? Heavy new supply (>2% of stock underway) typically softens rents 12–24 months out; light construction supports rent growth.
Investment metrics
- 1% rule
- 2.39% ✓
- Cap rate
- 17.85%
- Cash-on-cash
- 41.29%
- DSCR
- 2.84
- GRM
- 3.5
CMA / ARV
- ARV (median comp)
- $197,667
- List price
- $109,900
- Delta
- -44.40%
- Verdict
- UNDERPRICED
- Comps
- 20 within 1.0 mi
Show comp detail 1 sale within ~0.75 mi
| Address | Dist | Beds/Ba | Sqft | Sold | Price | $/sf | Match |
|---|---|---|---|---|---|---|---|
| 203 Hudson St | 0.13mi | 3/3.0 (+1) | 2,206 (+9%) | 8mo | $54,000 | $24 | 63 |
Match score weights: distance 35% · size 25% · config 20% · recency 20%. Top-matched comps best support the ARV.
Projected returns pro-forma
10.0% appreciation · 8.0% rent growth · sell at horizon
- IRR
- 60.4%
- Equity multiple
- 5.59×
- Total profit
- $141,364
- Equity at exit
- $99,007
- IRR
- 56.2%
- Equity multiple
- 13.93×
- Total profit
- $398,017
- Equity at exit
- $213,512
Cash invested: $30,772 (down + closing). Projections, not guarantees.
Landlord ↔ Tenant lean methodology
- Overall (STATE)
- 15 Strongly Tenant-Friendly
- State New York
- 15 Strongly Tenant-Friendly · D+10
- County
- — inherits STATE
- City
- — inherits STATE
ZIP-level market 13790
- Home prices YoY
- 6.8%
- Rents YoY
- 9.5%
- Active inventory
- 99
- Price-to-rent
- 7.0×
Monthly cashflow live
- Estimated rent
- $2,625 high interval (Pro) →
- Mortgage (P&I)
- −$576
- Tax from tax record
- −$393 /mo · $4,713/yr
- Insurance
- −$46
- HOA
- −$0
- Vacancy / Maint / Mgmt
- −$551
- Net cashflow
- $1,059
Break-even live
2-unit breakdown (identical units grouped — click to expand)
| Units | Beds | Baths | Est. rent |
|---|---|---|---|
| 2× units | 2 | 1 | $2,626 |
| #1 | 2 | 1 | $1,313 |
| #2 | 2 | 1 | $1,313 |
| Total (2 units) | $2,625 | ||
UW: 25.0% down · 7.5% · 30yr · 1.5% tax · 5.0% vac · 8.0% maint · 8.0% mgmt
Financing live
Cash to close
- Down payment
- $27,475
- Closing costs
- $3,297
- Reserves months
- —
- Total cash needed
- —
Loan-product check · same deal, 3 products live
Conventional
25% down · 7.5% · 30yr
- Down + closing
- —
- Monthly P&I
- —
- Monthly cashflow
- —
- DSCR
- —
- Eligible?
- —
Personal DTI + credit; lowest rate.
DSCR
20% down · 8.5% · 30yr
- Down + closing
- —
- Monthly P&I
- —
- Monthly cashflow
- —
- DSCR
- —
- Eligible?
- —
No personal income docs; deal must DSCR.
Hard money
10% down · 12.0% · 12mo
- Down + closing
- —
- Monthly P&I
- —
- Monthly cashflow
- —
- DSCR
- —
- Eligible?
- —
Short-term bridge; refi at stabilization.
Rent comps 6 comps
| Address | Beds | Baths | Sqft | Rent | $/sqft | DOM | Units | Dist |
|---|---|---|---|---|---|---|---|---|
| 248 Main St Unit 2 Johnson City, NY | 2.0 | 1.0 | 1650 | $1,650 | $1.00 | 13d | 1 | 0.40mi |
| 57 Fowler Ave Johnson City, NY | 3.0 | 2.5 | 2497 | $2,000 | $0.80 | 13d | 1 | 0.67mi |
| 74 Matthews St Binghamton, NY | 3.0 | 2.0 | 2510 | $2,300 | $0.92 | 20d | 1 | 1.14mi |
| 16 Highland Ave Unit 1 Binghamton, NY | 3.0 | 1.0 | 1400 | $1,650 | $1.18 | 43d | 1 | 1.43mi |
| 36 Haendel St Unit 1 Binghamton, NY | 3.0 | 1.0 | 1600 | $1,650 | $1.03 | 43d | 1 | 1.44mi |
| 3613 Vestal Rd Vestal, NY | 3.0 | 2.0 | 1590 | $2,000 | $1.26 | 13d | 1 | 1.47mi |
Listing history 18 events
-
2026-06-19days on market $109,900 Active 36 DOM
-
2026-06-18days on market $109,900 Active 35 DOM
-
2026-06-17days on market $109,900 Active 34 DOM
-
2026-06-16days on market $109,900 Active 33 DOM
-
2026-06-15days on market $109,900 Active 32 DOM
-
2026-06-14days on market $109,900 Active 30 DOM
-
2026-06-13days on market $109,900 Active 29 DOM
-
2026-06-10pricedays on market $109,900 Active 27 DOM
-
2026-06-09days on market $129,900 Active 26 DOM
-
2026-06-08days on market $129,900 Active 25 DOM
-
2026-06-07days on market $129,900 Active 24 DOM
-
2026-06-05days on market $129,900 Active 21 DOM
-
2026-06-03days on market $129,900 Active 20 DOM
-
2026-06-02days on market $129,900 Active 19 DOM
-
2026-06-01days on market $129,900 Active 18 DOM
-
2026-05-31days on market $129,900 Active 17 DOM
-
2026-05-30days on market $129,900 Active 16 DOM
-
2026-05-14$129,900 Active 923-char remark
ⓘ Source: listings_history table (triggers on properties + properties_extension) + one-shot
backfill from property_details.listing_events for pre-trigger history.
Tax reassessment forecast NY · Partial reset (capped growth)
- Current annual tax
- $4,713 · $393/mo
- Projected year-2 tax
- $4,713 · $393/mo
- Expected delta
- $0/yr ($0/mo · 0.0%)
ⓘ Screening estimate from a state-policy table — verify with the county assessor before closing.
Climate risk First Street
- Flood 2/10 Low FEMA zone X · 5% chance over 30 yrs
- Wildfire 3/10 Moderate
- Heat 3/10 Moderate 7 d/yr ≥94°F today · 16 d/yr by 30 yrs out
- Wind 2/10 Low 100% chance of damaging wind over 30 yrs
- Air quality 2/10 Low 0 unhealthy d/yr today · 1 by 30 yrs out
Nearby sold comps map
Loading sold comps map…
Walkable amenities ~0.75 mi
Loading nearby amenities…
Taxation est. · year 1
- Rental income
- $31,500
- − Mortgage interest
- −$6,156
- − Property taxes
- −$4,713
- − Insurance
- −$550
- − Repairs & maintenance
- −$2,520
- − Management
- −$2,520
- − Depreciation
- −$3,197
- Taxable income
- $11,844
- Est. tax owed @ 24.0%
- −$2,843
- After-tax cash flow
- $9,864/yr
For passive investors: Depreciation is non-cash, so a rental often shows a tax loss while cash-flowing — sheltering income. Rental losses are passive: they offset passive income freely, and up to $25,000/yr can offset ordinary (W-2) income if you actively participate and your MAGI is under $100k (phasing out to $0 by $150k); unused losses carry forward. On sale, claimed depreciation is recaptured at up to 25%, and gains may owe capital-gains tax (a 1031 exchange can defer both). Figures are a year-1 estimate at your 24.0% rate — not tax advice; consult a CPA.
Schools (NCES district)
- District
- Johnson City Central School District
- NCES district ID
- 3615900
- Math proficiency
- 38% ▼ -8.00%
- Reading proficiency
- 41% ▲ 2.00%
- Median HH income
- $40,514
- Composite
- 33.17/100
- National rank
- #5545
- State rank
- #535 of 590 in NY
Livability — Johnson City
- Score
- 76/100
- State rank
- #238
- US rank
- #3739
Category grades
Schools grade is shown separately in the Schools card above.
Census & demographics
- Census place
- Johnson City, NY
- County
- Broome County · 126,805 people
- City population
- 18,739
- Metro
- Binghamton, NY
- Population (ZIP)
- 18,739
- Household income
- $59,045
- Rent vs Own
- Severe rent burden
- 1233.0
Population outlook (Broome County) Hauer SSP2
- Today (2025)
- 187,989 people
- By 2030
- 183,066 · -2.6%
- By 2040
- 172,228 · -8.4%
- By 2050
- 163,161 · -13.2%
- By 2075
- 153,641 · -18.3%
- By 2100
- 140,851 · -25.1%
Race, ethnicity, and origin ACS 2023
- Neighborhood character
- Predominantly White (75%)
- Race & ethnicity
- White 75% Two or more races 9% Asian 8% Black 6% Hispanic / Latino 4%
- Common ancestry
- Romanian 6% Lithuanian 3% Scotch-Irish 2%
- Foreign-born
- 9% · Canada, China, Vietnam
- Languages at home
- 88% English-only · Other Indo-European 4% French/Haitian/Cajun 2% Spanish 2%
Political lean MEDSL · Broome
- 2024 margin
- Toss-up / Even · D 50.2% · R 49.8%
- 2008→2024 swing
- -7.6pp toward R · 2008: 8.0pp · 2024: 0.4pp
- All cycles
- 2024: D+0.4 2020: D+3.5 2016: R+3.7 2012: D+4.6 2008: D+8.0
Not yet ingested
- Civics
- —
Market trends
- HPI YoY
- ▲ 18.06%
- Current HPI
- 285.3668
- Rent YoY
- ▲ 9.47%
- Metro
- Binghamton, NY
- State GDP YoY
- ▲ 2.60%
- F500 in state
- 92
Industry mix (Fortune 500 HQ in NY)
| Industry | F500 HQs | Revenue |
|---|---|---|
| Financial Services | 10 | $950B |
|
||
| Consumer Goods | 9 | $162B |
|
||
| Insurance | 4 | $225B |
|
||
| Telecommunications | 2 | $144B |
|
||
| Pharmaceuticals | 2 | $112B |
|
||
| Media / Entertainment | 2 | $69B |
|
||
Price history
-15.4% since first listed2 events — show timeline
- 2026-06-09 Price Changed $109,900 GBAOR
- 2026-05-14 Listed $129,900 GBAOR
Property tax history
+3.8%/yrLatest (2025): $4,713 · +7.1% YoY. Source: county tax records.
Cash-flow waterfall
monthlySold comps — $/sqft
last 12 mo · ≤1 miLoading sold comps…