1337 Solana Rd Unit K9 · Naples, FL
Flood risk 4/10 · Minor
- FEMA flood zone
- X (unshaded)
- Chance of flooding over 30 yrs
- 0.17%
- Est. flood insurance / yr
- $507 – $1,088
Fire risk 1/10 · Minimal
- Est. fire insurance / yr
- $947 – $1,759
Heat risk 10/10 · Severe
- Hot days now (above 107°F)
- 7 days/yr
- Hot days in 30 yrs
- 30 days/yr
Wind risk 10/10 · Severe
- Chance of severe wind over 30 yrs
- 99.0%
Air-quality risk 2/10 · Minimal
- Unhealthy air days now
- 2 days/yr
- Unhealthy air days in 30 yrs
- 2 days/yr
Risk factors via First Street. Map © Google.
Why this score? — see what drove the C+ grade
The composite is a weighted blend of 9 inputs, each scored 0–100. Each bar is that input's sub-score; the figure is the points it added to the 100-point composite (weight × sub-score).
- Cash flow +22.8/30.0
- 1% rule +7.6/10.0
- ARV discount +7.5/15.0
- DSCR +7.3/10.0
- Rent growth +5.0/5.0
- Schools +5.0/10.0
- Livability +4.0/5.0
- Condition / age +2.5/5.0
- Appreciation +0.0/10.0
$495,000
🖨 Deal sheet 📄 Offer letter ✓ Due diligence
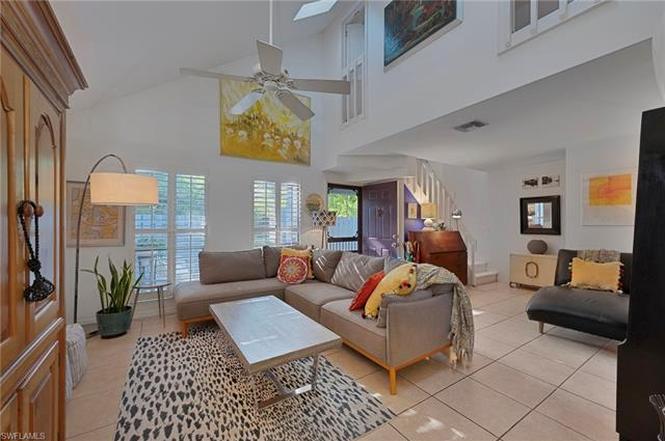
Listing remarks
Discover this enchanting oasis in vibrant Naples, where paradise awaits with a stunning community pool and serene lake views! This in town location immerses you in a quiet botanical tropical environment, an artist's retreat. There are two private patios for relaxation and for dining alfresco. Step inside this spacious floor plan in Bent Pines and discover high vaulted ceilings that has an open great room which seamlessly connects to the generous dining area and kitchen which is a chef’s delight. There are two Primary Bedroom options one on the first level or on the second level, plus a third bedroom/den on the first level, this home perfectly balances space and style, making it your i
Key facts
- Two patios
- Lake views
- Chef's delight
Tags
Property features AI
Finance
- Other: Part of Bent Pines Villas Condo (57 units in complex, 5 units in building)
- HOA & community: Quarterly condo fee; Community pool; Internet access; Sidewalks and streetlights; Underground utilities; Professional management; Maintenance covers insurance, lawn/land, manager, pest control (interior & exterior), reserves, sewer, trash removal, and water; Non-gated community; Total annual recurring fees listed; One-time fees listed
Exterior
- Parking: 1 assigned parking space; Deeded parking; Guest parking; Paved parking
- Utilities: Central water; Central sewer; Cable available
- Home design: Attached villa (2 story); Residential property; Rear exposure faces southwest; Unit 9 in complex
- Construction: Wood frame construction; Wood siding exterior finish; Shingle roof; Built in 1988
- Exterior features: Courtyard; Patio; Landscaped area view; Sliding windows; Paved roads and dead-end access; No RV allowed (deeded restriction)
Interior
- Kitchen: Dishwasher; Self-cleaning oven; Refrigerator
- Bedrooms: 3 bedrooms; Master bedroom upstairs
- Flooring: Tile; Wood
- Bathrooms: 2 full bathrooms; Master bath with tub and shower combo
- Heating & cooling: Central electric heating; Central electric cooling
- Interior features: Foyer; High-speed internet available; Smoke detectors; Vaulted ceiling; Walk-in closet; Window coverings; Great room; Dining in family room; Loft; Open porch/lanai; Storage
- Laundry & utility: Washer; Dryer; Laundry in residence
Neighborhood map
What this means for you Summary
Snapshot
- This is a 3-bed/2.0-bath condo listed at $495k.
Deal economics
- At list price, monthly cash flow is $865 ($10k/yr) — positive.
- The deal already cash-flows at list — no discount required.
- Meets the 1% rule at list price ($6k rent vs $495k).
- Recommended offer: $436k (12.0% below list) — sets the bar for market timing.
Location & tenants
- Location reads 80/100 on livability (#126 in FL, #1,903 nationally) — a professional / high-income tenant draw. Strengths: crime A+, amenities A+, employment A+; Watch: commute D+, cost of living F.
- Collier (suburban): math 60% / reading 56% proficiency, ranked #16 of 73 in FL (top 22%) — acceptable for families but not a draw, mixed tenant base, ~2y average lease.
- Market conditions: Rents rising fast (+14.6%/yr); 479 active listings in the ZIP; 40 comparable units currently listed for rent nearby; rentals at typical pace (median 23d on market — plan ~3-4 weeks tenant-placement turnaround); high-income renter base; 3,520 units permitted in Collier County in 2024 (959 in 5+ unit buildings).
- At $6,241/mo this rent would consume 64% of the median local household income ($117k/yr) (locally 311% of renters already pay >50% of income on rent) — very limited rent-growth headroom before tenants either downsize or default.
Forward outlook
- Local home prices are declining (-3.0%/yr); year-one equity from $3k of loan paydown is wiped out by about $15k of value loss. Plan a longer hold.
- Collier County population projected at +30% by 2050 — long-run rental-demand tailwind backs the buy-and-hold thesis.
- At projected returns (-3.0% appreciation + 8.0% rent growth), your $139k cash investment doubles in ~8 years — after that, you're playing with house money.
Negotiation context
- It's been on market 163 days — a 12% lower offer ($436k) is reasonable based on typical stale-listing flexibility.
- Current owner paid $350k; 41% above their basis — modest negotiation headroom, anchor on the comps not their cost.
Risks & watch-outs
- Climate carrying-cost: severe wind risk, 99% chance of damaging wind over 30y; extreme-heat days projected 7→30/yr by 2055 (HVAC capex compounding) — expect insurance premiums to compound above CPI over the hold.
Questions for the listing agent
- It's been on market 163 days. Have you received any prior offers? Is the seller open to a 12% concession, seller financing, or rate buy-down credit?
- What does the HOA fee cover, when was the last increase, and are there any pending special assessments or reserve-fund shortfalls?
- Any open or pending special assessments — roof, HVAC, plumbing, elevator, façade? What's the per-unit balance and payoff schedule, and is the seller paying it off at close or rolling it to the buyer?
- Why hasn't it sold? Are there any deal-killer items the seller is aware of (foundation, flood, title, zoning, code violations)?
- Is there a deadline driving the sale (1031 exchange, divorce, estate, relocation)? That informs how much negotiation room exists.
- Schools are B-rated — typically a magnet for longer-tenancy family renters. What's the average tenant stay here, and is there a school-zone premium baked into asking?
- What's the average days-on-market for RENTAL listings here right now (not sales)? A rising rental-DOM trend means longer vacancies and softer asking-rent achievability than the comps imply.
- What's the recent tenant-quality profile in this submarket — average credit score on applications, eviction rate, late-payment / NSF rate, and stable-employment percentage? A property-management company in the area should have these aggregated.
- How much new apartment / multifamily construction is in the pipeline within 1–3 miles? Heavy new supply (>2% of stock underway) typically softens rents 12–24 months out; light construction supports rent growth.
Investment metrics
- 1% rule
- 1.26% ✓
- Cap rate
- 8.39%
- Cash-on-cash
- 7.49%
- DSCR
- 1.33
- GRM
- 6.6
CMA / ARV
No comps found within radius.
Projected returns pro-forma
-3.0% appreciation · 8.0% rent growth · sell at horizon
- IRR
- 1.5%
- Equity multiple
- 1.06×
- Total profit
- $8,335
- Equity at exit
- $73,806
- IRR
- 16.1%
- Equity multiple
- 2.66×
- Total profit
- $230,279
- Equity at exit
- $42,799
Cash invested: $138,600 (down + closing). Projections, not guarantees.
Landlord ↔ Tenant lean methodology
- Overall (STATE)
- 87 Strongly Landlord-Friendly
- State Florida
- 87 Strongly Landlord-Friendly · R+3
- County
- — inherits STATE
- City
- — inherits STATE
ZIP-level market 34103
- Rents YoY
- 14.6%
- Active inventory
- 479
- Price-to-rent
- 6.6×
Monthly cashflow live
- Estimated rent
- $6,241 medium interval (Pro) →
- Mortgage (P&I)
- −$2,596
- Tax from tax record
- −$368 /mo · $4,421/yr
- Insurance
- −$206
- HOA
- −$895
- Vacancy / Maint / Mgmt
- −$1,311
- Net cashflow
- $865
Break-even live
UW: 25.0% down · 7.5% · 30yr · 1.5% tax · 5.0% vac · 8.0% maint · 8.0% mgmt
Financing live
Cash to close
- Down payment
- $123,750
- Closing costs
- $14,850
- Reserves months
- —
- Total cash needed
- —
Loan-product check · same deal, 3 products live
Conventional
25% down · 7.5% · 30yr
- Down + closing
- —
- Monthly P&I
- —
- Monthly cashflow
- —
- DSCR
- —
- Eligible?
- —
Personal DTI + credit; lowest rate.
DSCR
20% down · 8.5% · 30yr
- Down + closing
- —
- Monthly P&I
- —
- Monthly cashflow
- —
- DSCR
- —
- Eligible?
- —
No personal income docs; deal must DSCR.
Hard money
10% down · 12.0% · 12mo
- Down + closing
- —
- Monthly P&I
- —
- Monthly cashflow
- —
- DSCR
- —
- Eligible?
- —
Short-term bridge; refi at stabilization.
Rent comps 40 comps
| Address | Beds | Baths | Sqft | Rent | $/sqft | DOM | Units | Dist |
|---|---|---|---|---|---|---|---|---|
| 1240 Shady Rest Ln #102 Naples, FL | 3.0 | 2.0 | 1619 | $6,000 | $3.71 | 13d | 1 | 0.09mi |
| 1082 Capri Dr Naples, FL | 3.0 | 2.0 | 1500 | $9,000 | $6.00 | 23d | 1 | 0.33mi |
| 1097 Frank Whiteman Blvd Naples, FL | 4.0 | 3.0 | 1590 | $10,900 | $6.86 | 23d | 1 | 0.43mi |
| 4082 Belair Ln #11 Naples, FL | 3.0 | 2.0 | 1600 | $6,000 | $3.75 | 23d | 1 | 0.44mi |
| 4092 Belair Ln #15 Naples, FL | 3.0 | 3.0 | 1500 | $6,200 | $4.13 | 23d | 1 | 0.46mi |
| 3930 Belair Ln Naples, FL | 2.0 | 2.0 | 1300 | $6,000 | $4.62 | 23d | 1 | 0.47mi |
| 4083 Belair Ln Naples, FL | 3.0 | 3.5 | 2600 | $25,000 | $9.62 | 23d | 1 | 0.49mi |
| 3722 Rachel Ln Naples, FL | 3.0 | 3.0 | 2141 | $20,000 | $9.34 | 13d | 1 | 0.57mi |
| 718 Old Trail Dr Naples, FL | 3.0 | 3.0 | 2286 | $34,500 | $15.09 | 23d | 1 | 0.59mi |
| 740 Park Shore Dr Naples, FL | 3.0 | 2.0 | 1964 | $22,500 | $11.46 | 23d | 1 | 0.61mi |
| 4200 Belair Ln Naples, FL | 2.0–3.0 | 2.0 | 1406 | $9,000 | $6.40 | 23d | 5 | 0.64mi |
| 723 Willowhead Dr Naples, FL | 3.0 | 3.0 | 1776 | $18,000 | $10.14 | 23d | 1 | 0.66mi |
| 569 Park Shore Dr Unit G5 Naples, FL | 2.0 | 2.5 | 1921 | $15,000 | $7.81 | 23d | 1 | 0.68mi |
| 571 Park Shore Dr Unit G6 Naples, FL | 2.0 | 2.0 | 2221 | $14,000 | $6.30 | 23d | 1 | 0.68mi |
| 735 Parkview Ln Naples, FL | 2.0 | 2.0 | 1918 | $11,000 | $5.74 | 23d | 1 | 0.69mi |
| 4706 West Blvd Unit W3 Naples, FL | 3.0 | 3.0 | 1933 | $7,000 | $3.62 | 23d | 1 | 0.71mi |
| 4180 Crayton Rd Unit E7 Naples, FL | 3.0 | 2.0 | 1600 | $8,900 | $5.56 | 23d | 1 | 0.74mi |
| 261 Colonade Cir #2701 Naples, FL | 2.0 | 2.5 | 1991 | $11,000 | $5.52 | 23d | 1 | 0.76mi |
| 1265 Pompei Ln Naples, FL | 3.0 | 2.0 | 1650 | $3,495 | $2.12 | 13d | 1 | 0.80mi |
| 635 Fountainhead Ln Naples, FL | 4.0 | 3.0 | 2566 | $19,000 | $7.40 | 23d | 1 | 0.82mi |
| 656 Binnacle Dr Naples, FL | 3.0 | 2.0 | 1808 | $10,000 | $5.53 | 23d | 1 | 0.84mi |
| 587 Parkwood Ln Naples, FL | 4.0 | 2.0 | 2114 | $6,000 | $2.84 | 23d | 1 | 0.85mi |
| 4155 Crayton Rd #203 Naples, FL | 3.0 | 3.0 | 1940 | $14,000 | $7.22 | 23d | 1 | 0.85mi |
| 1119 Ridge St Naples, FL | 3.0 | 3.5 | 2221 | $9,000 | $4.05 | 23d | 1 | 0.86mi |
| 355 Park Shore Dr Unit 1-114 Naples, FL | 2.0 | 2.0 | 1574 | $13,000 | $8.26 | 23d | 1 | 0.90mi |
| 3105 Riviera Dr Unit A201 Naples, FL | 2.0 | 2.0 | 1625 | $8,000 | $4.92 | 23d | 1 | 0.95mi |
| 535 Anchor Rode Dr Naples, FL | 4.0 | 3.0 | 2422 | $35,000 | $14.45 | 23d | 1 | 0.95mi |
| 250 Park Shore Dr #803 Naples, FL | 3.0 | 2.0 | 1690 | $15,000 | $8.88 | 23d | 1 | 0.95mi |
| 707 Port Side Dr Naples, FL | 4.0 | 3.0 | 2490 | $20,000 | $8.03 | 23d | 1 | 0.99mi |
| 4856 Crayton Rd Naples, FL | 3.0 | 2.0 | 2329 | $20,000 | $8.59 | 13d | 1 | 1.06mi |
| 4916 Crayton Rd Naples, FL | 3.0 | 2.0 | 1932 | $25,000 | $12.94 | 23d | 1 | 1.08mi |
| 1614 Forest Lakes Blvd Naples, FL | 3.0 | 2.0 | 1869 | $10,000 | $5.35 | 23d | 1 | 1.10mi |
| 4530 Gulf Shore Blvd N Unit 2-122 Naples, FL | 3.0 | 2.5 | 1786 | $15,000 | $8.40 | 23d | 1 | 1.15mi |
| 4031 Gulf Shore Blvd N #55 Naples, FL | 2.0 | 2.0 | 2150 | $6,500 | $3.02 | 23d | 1 | 1.17mi |
| 3520 Bolero Way Unit 1325569P Naples, FL | 3.0 | 2.0 | 1399 | $5,021 | $3.59 | 13d | 1 | 1.17mi |
| 4031 Gulf Shore Blvd N Unit 7D Naples, FL | 3.0 | 3.0 | 2500 | $18,000 | $7.20 | 23d | 1 | 1.17mi |
| 4560 Gulf Shore Blvd N Unit 3-213 Naples, FL | 2.0 | 2.0 | 1321 | $8,500 | $6.43 | 23d | 1 | 1.18mi |
| 5934 Premier Way Naples, FL | 1.0–3.0 | 1.0–3.0 | 1350 | $4,882 | $3.62 | 13d | 29 | 1.18mi |
| 1719 Camelia Ln Naples, FL | 3.0 | 2.0 | 1534 | $3,900 | $2.54 | 23d | 1 | 1.19mi |
| 4255 Gulf Shore Blvd N #1403 Naples, FL | 2.0 | 2.0 | 1536 | $12,500 | $8.14 | 23d | 1 | 1.19mi |
HOA detail condo
- Monthly dues
- $895 · $10,740/yr
- Likely covers
- pool
- Assessments
- None detected in remarks — confirm with the listing agent.
Listing history 19 events
-
2026-06-18days on market $495,000 Active 163 DOM
-
2026-06-17days on market $495,000 Active 162 DOM
-
2026-06-16days on market $495,000 Active 161 DOM
-
2026-06-15days on market $495,000 Active 160 DOM
-
2026-06-14days on market $495,000 Active 158 DOM
-
2026-06-10days on market $495,000 Active 155 DOM
-
2026-06-09days on market $495,000 Active 154 DOM
-
2026-06-08days on market $495,000 Active 153 DOM
-
2026-06-07days on market $495,000 Active 152 DOM
-
2026-06-03days on market $495,000 Active 148 DOM
-
2026-06-02days on market $495,000 Active 147 DOM
-
2026-06-01days on market $495,000 Active 146 DOM
-
2026-05-31days on market $495,000 Active 145 DOM
-
2026-05-30days on market $495,000 Active 144 DOM
-
2026-05-05price $495,000
-
2026-04-10price $500,000
-
2026-01-06$515,000 Active
-
2005-11-30soldstatus $350,000
-
1998-01-16soldstatus $120,500
ⓘ Source: listings_history table (triggers on properties + properties_extension) + one-shot
backfill from property_details.listing_events for pre-trigger history.
Tax reassessment forecast FL · Resets to sale price
- Current annual tax
- $4,421 · $368/mo
- Projected year-2 tax
- $4,421 · $368/mo
- Expected delta
- $0/yr ($0/mo · 0.0%)
ⓘ Screening estimate from a state-policy table — verify with the county assessor before closing.
Climate risk First Street
- Flood 4/10 Moderate FEMA zone X (unshaded) · 17% chance over 30 yrs
- Wildfire 1/10 Low
- Heat 10/10 Extreme 7 d/yr ≥107°F today · 30 d/yr by 30 yrs out
- Wind 10/10 Extreme 99% chance of damaging wind over 30 yrs
- Air quality 2/10 Low 2 unhealthy d/yr today · 2 by 30 yrs out
Nearby sold comps map
Loading sold comps map…
Walkable amenities ~0.75 mi
Loading nearby amenities…
Taxation est. · year 1
- Rental income
- $74,890
- − Mortgage interest
- −$27,728
- − Property taxes
- −$4,421
- − Insurance
- −$2,475
- − Repairs & maintenance
- −$5,991
- − Management
- −$5,991
- − HOA
- −$10,740
- − Depreciation
- −$14,400
- Taxable income
- $3,144
- Est. tax owed @ 24.0%
- −$754
- After-tax cash flow
- $9,622/yr
For passive investors: Depreciation is non-cash, so a rental often shows a tax loss while cash-flowing — sheltering income. Rental losses are passive: they offset passive income freely, and up to $25,000/yr can offset ordinary (W-2) income if you actively participate and your MAGI is under $100k (phasing out to $0 by $150k); unused losses carry forward. On sale, claimed depreciation is recaptured at up to 25%, and gains may owe capital-gains tax (a 1031 exchange can defer both). Figures are a year-1 estimate at your 24.0% rate — not tax advice; consult a CPA.
Schools (NCES district)
- District
- Collier
- NCES district ID
- 1200330
- Math proficiency
- 60% ▼ -4.00%
- Reading proficiency
- 56% ▼ -2.00%
- Median HH income
- $58,275
- Composite
- 50.23/100
- National rank
- #1892
- State rank
- #16 of 73 in FL
Livability — Naples
- Score
- 80/100
- State rank
- #126
- US rank
- #1903
Category grades
Schools grade is shown separately in the Schools card above.
Census & demographics
- County
- Collier County · 396,295 people
- City population
- 344,941
- Metro
- Naples-Marco Island, FL
- Population (ZIP)
- 11,299
- Household income
- $116,875
- Rent vs Own
- Severe rent burden
- 311.0
Population outlook (Collier County) Hauer SSP2
- Today (2025)
- 420,858 people
- By 2030
- 450,054 · +6.9%
- By 2040
- 502,232 · +19.3%
- By 2050
- 544,932 · +29.5%
- By 2075
- 627,203 · +49.0%
- By 2100
- 659,015 · +56.6%
Race, ethnicity, and origin ACS 2023
- Neighborhood character
- Predominantly White (87%)
- Race & ethnicity
- White 87% Hispanic / Latino 10% Two or more races 8% Asian 1%
- Hispanic origin (detail)
- Common ancestry
- Romanian 4% Lithuanian 2% Portuguese 2%
- Foreign-born
- 13% · Canada
- Languages at home
- 87% English-only · Spanish 9% Other Indo-European 2% German/W. Germanic 1%
Political lean MEDSL · Collier
- 2024 margin
- Solid R (+33.1) · D 33.1% · R 66.2%
- 2008→2024 swing
- -10.6pp toward R · 2008: -22.5pp · 2024: -33.1pp
- All cycles
- 2024: R+33.1 2020: R+24.7 2016: R+26.0 2012: R+30.1 2008: R+22.5
Not yet ingested
- Civics
- —
Market trends
- HPI YoY
- ▼ -327.53%
- Current HPI
- 315.1396
- Rent YoY
- ▲ 14.55%
- Metro
- Naples-Marco Island, FL
- State GDP YoY
- ▲ 3.28%
- F500 in state
- 36
Industry mix (Fortune 500 HQ in FL)
| Industry | F500 HQs | Revenue |
|---|---|---|
| Industrial Technology | 2 | $29B |
|
||
| Insurance | 2 | $17B |
|
||
| Retail | 1 | $60B |
|
||
| Technology Distribution | 1 | $58B |
|
||
| Homebuilding | 1 | $35B |
|
||
| Technology Manufacturing | 1 | $35B |
|
||
Price history
+310.8% since first listed5 events — show timeline
- 2026-05-05 Price Changed $495,000 NAPLESMLS
- 2026-04-10 Price Changed $500,000 NAPLESMLS
- 2026-01-06 Listed $515,000 NAPLESMLS
- 2005-11-30 Sold (Public Records) $350,000 Public Records
- 1998-01-16 Sold (Public Records) $120,500 Public Records
Property tax history
+9.8%/yrLatest (2025): $4,421 · +9.6% YoY. Source: county tax records.
Cash-flow waterfall
monthlySold comps — $/sqft
last 12 mo · ≤1 miLoading sold comps…