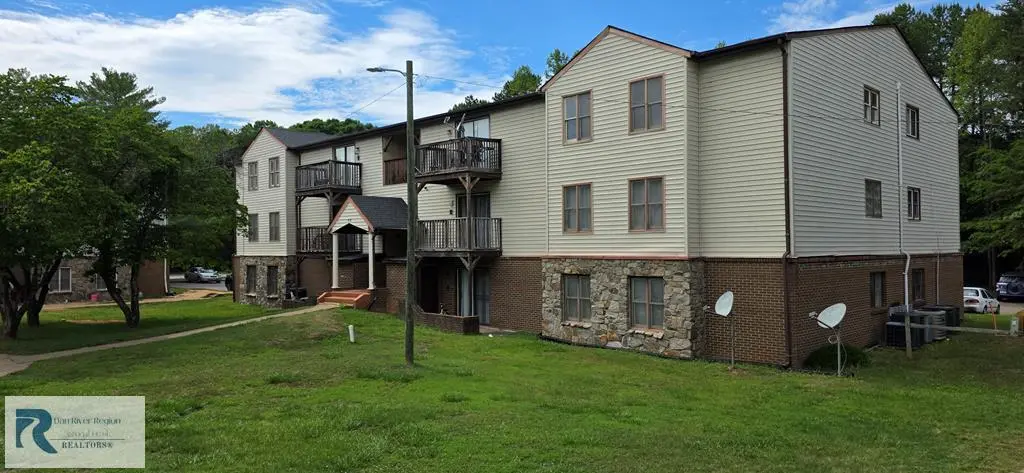
215 A Seminole Trl Unit A · Danville, VA
Flood risk 1/10 · Minimal
- FEMA flood zone
- X (unshaded)
- Chance of flooding over 30 yrs
- 0.0%
- Est. flood insurance / yr
- $507 – $1,088
Fire risk 3/10 · Minor
- Est. fire insurance / yr
- $666 – $1,236
Heat risk 6/10 · Moderate
- Hot days now (above 105°F)
- 7 days/yr
- Hot days in 30 yrs
- 18 days/yr
Wind risk 3/10 · Minor
- Chance of severe wind over 30 yrs
- 7.0%
Air-quality risk 2/10 · Minimal
- Unhealthy air days now
- 0 days/yr
- Unhealthy air days in 30 yrs
- 1 days/yr
Risk factors via First Street. Map © Google.
Why this score? — see what drove the B- grade
The composite is a weighted blend of 9 inputs, each scored 0–100. Each bar is that input's sub-score; the figure is the points it added to the 100-point composite (weight × sub-score).
- Cash flow +30.0/30.0
- 1% rule +10.0/10.0
- DSCR +10.0/10.0
- ARV discount +7.5/15.0
- Livability +3.9/5.0
- Schools +3.0/10.0
- Rent growth +2.5/5.0
- Condition / age +2.5/5.0
- Appreciation +0.0/10.0
$70,000
🖨 Deal sheet (PDF) 📄 Offer letter ✓ Due diligence
Listing remarks
Being sold AS IS CONDITION. Seller to make no repairs or improvements. UOA is currently $250/ monthly covering water, sewer, and exterior maintenance.
Key facts
- Built 1975
- Listed 18 days
Property features AI
Exterior
- Parking: No garage
- Utilities: Public water; Public sewer
- Home design: Residential condominium; Multi-unit residential zoning (MR)
- Construction: Vinyl siding; Approximately 1,200 above-grade finished area
- Exterior features: Composition roof
Interior
- Kitchen: Refrigerator
- Bedrooms: Three main-level bedrooms
- Flooring: Vinyl flooring; Carpet flooring
- Bathrooms: Two full bathrooms, both on the main level
- Heating & cooling: Electric heating; Heat pump
- Interior features: Refrigerator included; Vinyl and carpet flooring; Six total rooms
Neighborhood map
What this means for you Summary
Snapshot
- This is a 3-bed/2.0-bath other listed at $70k.
Deal economics
- At list price, monthly cash flow is $654 ($8k/yr) — positive.
- The deal already cash-flows at list — no discount required.
- Meets the 1% rule at list price ($1k rent vs $70k).
- Recommended offer: $69k (1.5% below list) — sets the bar for market timing.
- Cap rate 17.5% vs local median 5.2% in Danville — top-decile yield for the area; either an underpriced asset or a hidden risk that comps aren't pricing in. Stress-test before assuming the spread holds.
Location & tenants
- Location reads 77/100 on livability (#91 in VA, #2,952 nationally) — a middle-class / working-renter tenant base. Strengths: cost of living A+, housing A+, health & safety A+; Watch: amenities D+, crime D-, commute F.
- Danville City Public School District (town): math 30% / reading 44% proficiency, ranked #128 of 131 in VA (top 98%) — families likely to look elsewhere, expect single-tenant / working-renter base with shorter leases; 71% free/reduced lunch — lower-income household profile, screen leases tightly.
- Zoned schools: G.L.H. Johnson Elementary (math 34% / reading 24%, grade F, #1,011 of 1,108 statewide, top 92%, 545 students, 122% FRL); O. Trent Bonner Middle (math 33% / reading 53%, grade D-, #288 of 342 statewide, top 85%, 678 students, 91% FRL); George Washington High (math 44% / reading 54%, grade D, #300 of 319 statewide, top 94%, 1,309 students, 88% FRL) — zoned schools average 100% FRL vs 71% district-wide (29 pts higher); higher-poverty schools than district average — tighter screening recommended.
- Market conditions: 212 active listings in the ZIP; 6 comparable units currently listed for rent nearby; rentals lingering (median 45d on market — plan ~5-8 weeks vacancy on turnover, expect pricing pressure); 83% of comp listings sitting > 30 days — soft ceiling on asking rent; 54 units permitted in Danville city in 2024 (40 in 5+ unit buildings).
- This rent runs 34% of the median local income ($48k/yr) — at the standard rent-burdened threshold; future hikes will face affordability resistance.
Forward outlook
- Local home prices are declining (-3.0%/yr); year-one equity from $484 of loan paydown is wiped out by about $2k of value loss. Plan a longer hold.
- Danville County population projected to shrink 7% by 2050 — rents likely to lag national; underwrite the cash flow, not the appreciation.
- At projected returns (-3.0% appreciation + 3.0% rent growth), your $20k cash investment doubles in ~3 years — after that, you're playing with house money.
Negotiation context
- It's been on market 19 days — a 2% lower offer ($69k) is reasonable based on typical stale-listing flexibility.
Risks & watch-outs
- Climate carrying-cost: extreme-heat days projected 7→18/yr by 2055 (HVAC capex compounding) — expect insurance premiums to compound above CPI over the hold.
Questions for the listing agent
- Built in 1975 — when were the roof, HVAC, electrical panel, plumbing, and water heater last replaced?
- Is there a deadline driving the sale (1031 exchange, divorce, estate, relocation)? That informs how much negotiation room exists.
- Schools are B-rated — typically a magnet for longer-tenancy family renters. What's the average tenant stay here, and is there a school-zone premium baked into asking?
- Crime grade is D in this area — have there been break-ins, vandalism, or insurance claims at this property in the last 3 years? What carrier currently insures it and at what premium?
- What's the average days-on-market for RENTAL listings here right now (not sales)? A rising rental-DOM trend means longer vacancies and softer asking-rent achievability than the comps imply.
- What's the recent tenant-quality profile in this submarket — average credit score on applications, eviction rate, late-payment / NSF rate, and stable-employment percentage? A property-management company in the area should have these aggregated.
- How much new for-sale + rental construction is in the pipeline within 1–3 miles? Heavy new supply typically softens prices + rents 12–24 months out; constrained supply supports both.
Investment metrics
- 1% rule
- 1.94% ✓
- Cap rate
- 17.50%
- Cash-on-cash
- 40.03%
- DSCR
- 2.78
- GRM
- 4.3
CMA / ARV
No comps found within radius.
Projected returns pro-forma
-3.0% appreciation · 3.0% rent growth · sell at horizon
- IRR
- 36.4%
- Equity multiple
- 2.54×
- Total profit
- $30,276
- Equity at exit
- $10,437
- IRR
- 43.0%
- Equity multiple
- 5.08×
- Total profit
- $79,897
- Equity at exit
- $6,052
Cash invested: $19,600 (down + closing). Projections, not guarantees.
Landlord ↔ Tenant lean methodology
- Overall (STATE)
- 55 Moderately Landlord-Leaning
- State Virginia
- 55 Moderately Landlord-Leaning · D+2
- County
- — inherits STATE
- City
- — inherits STATE
ZIP-level market 24540
- Home prices YoY
- -20.0%
- Active inventory
- 212
- Price-to-rent
- 4.3×
Monthly cashflow live
- Estimated rent
- $1,355 high interval (Pro) →
- Mortgage (P&I)
- −$367
- Tax from tax record
- −$20 /mo · $243/yr
- Insurance
- −$29
- HOA
- −$0
- Vacancy / Maint / Mgmt
- −$285
- Net cashflow
- $654
Break-even live
Sensitivity live
| Price | -10% $693 | -5% $674 | +0% $654 | +5% $634 | +10% $614 |
|---|---|---|---|---|---|
| Rent | -10% $547 | -5% $600 | +0% $654 | +5% $707 | +10% $761 |
| Rate | -1.0pp $689 | -0.5pp $672 | base $654 | +0.5pp $636 | +1.0pp $617 |
UW: 25.0% down · 7.5% · 30yr · 1.5% tax · 5.0% vac · 8.0% maint · 8.0% mgmt
Financing live
Cash to close
- Down payment
- $17,500
- Closing costs
- $2,100
- Reserves months
- —
- Total cash needed
- —
Loan-product check · same deal, 3 products live
Conventional
25% down · 7.5% · 30yr
- Down + closing
- —
- Monthly P&I
- —
- Monthly cashflow
- —
- DSCR
- —
- Eligible?
- —
Personal DTI + credit; lowest rate.
DSCR
20% down · 8.5% · 30yr
- Down + closing
- —
- Monthly P&I
- —
- Monthly cashflow
- —
- DSCR
- —
- Eligible?
- —
No personal income docs; deal must DSCR.
Hard money
10% down · 12.0% · 12mo
- Down + closing
- —
- Monthly P&I
- —
- Monthly cashflow
- —
- DSCR
- —
- Eligible?
- —
Short-term bridge; refi at stabilization.
Rent comps 6 comps
| Address | Beds | Baths | Sqft | Rent | $/sqft | DOM | Units | Dist |
|---|---|---|---|---|---|---|---|---|
| 713 Springfield Rd Unit K Danville, VA | 3.0 | 2.0 | 1200 | $1,200 | $1.00 | 45d | 1 | 0.14mi |
| 248 Lakeside Dr Danville, VA | 3.0 | 1.5 | 1134 | $2,200 | $1.94 | 45d | 1 | 0.77mi |
| 357 Terry Ave Danville, VA | 3.0 | 1.0 | 900 | $1,165 | $1.29 | 45d | 1 | 0.81mi |
| 119 Crosland Ave Danville, VA | 2.0 | 1.5 | 776 | $910 | $1.17 | 22d | 1 | 1.05mi |
| 117 Ida St Danville, VA | 3.0 | 1.0 | 925 | $1,163 | $1.26 | 45d | 1 | 1.10mi |
| 1300 Franklin Tpke Danville, VA | 2.0 | 1.5 | 1000 | $1,265 | $1.26 | 45d | 1 | 1.35mi |
Listing history 15 events
-
2026-06-21days on market $70,000 Active 19 DOM
-
2026-06-19days on market $70,000 Active 17 DOM
-
2026-06-18days on market $70,000 Active 16 DOM
-
2026-06-17days on market $70,000 Active 15 DOM
-
2026-06-16days on market $70,000 Active 14 DOM
-
2026-06-15days on market $70,000 Active 13 DOM
-
2026-06-14days on market $70,000 Active 11 DOM
-
2026-06-13days on market $70,000 Active 10 DOM
-
2026-06-10days on market $70,000 Active 8 DOM
-
2026-06-09days on market $70,000 Active 7 DOM
-
2026-06-08days on market $70,000 Active 6 DOM
-
2026-06-07days on market $70,000 Active 5 DOM
-
2026-06-05days on market $70,000 Active 2 DOM
-
2026-06-03remarks 150-char remark
-
2026-06-03$70,000 Active 1 DOM
ⓘ Source: listings_history table (triggers on properties + properties_extension) + one-shot
backfill from property_details.listing_events for pre-trigger history.
Tax reassessment forecast VA · Resets to sale price
- Current annual tax
- $243 · $20/mo
- Projected year-2 tax
- $574 · $48/mo
- Expected delta
- +$331/yr (+$28/mo · 136.0%)
ⓘ Screening estimate from a state-policy table — verify with the county assessor before closing.
Climate risk First Street
- Flood 1/10 Low FEMA zone X (unshaded) · 0% chance over 30 yrs
- Wildfire 3/10 Moderate
- Heat 6/10 Major 7 d/yr ≥105°F today · 18 d/yr by 30 yrs out
- Wind 3/10 Moderate 7% chance of damaging wind over 30 yrs
- Air quality 2/10 Low 0 unhealthy d/yr today · 1 by 30 yrs out
Nearby sold comps map
Loading sold comps map…
Walkable amenities ~0.75 mi
Loading nearby amenities…
Taxation est. · year 1
- Rental income
- $16,258
- − Mortgage interest
- −$3,921
- − Property taxes
- −$243
- − Insurance
- −$350
- − Repairs & maintenance
- −$1,301
- − Management
- −$1,301
- − Depreciation
- −$2,036
- Taxable income
- $7,106
- Est. tax owed @ 24.0%
- −$1,705
- After-tax cash flow
- $6,140/yr
For passive investors: Depreciation is non-cash, so a rental often shows a tax loss while cash-flowing — sheltering income. Rental losses are passive: they offset passive income freely, and up to $25,000/yr can offset ordinary (W-2) income if you actively participate and your MAGI is under $100k (phasing out to $0 by $150k); unused losses carry forward. On sale, claimed depreciation is recaptured at up to 25%, and gains may owe capital-gains tax (a 1031 exchange can defer both). Figures are a year-1 estimate at your 24.0% rate — not tax advice; consult a CPA.
Schools (NCES district)
- District
- Danville City Public School District
- NCES district ID
- 5101110
- Math proficiency
- 30% ▼ -22.00%
- Reading proficiency
- 44% ▼ -8.00%
- Median HH income
- $31,952
- Composite
- 30.23/100
- National rank
- #6298
- State rank
- #128 of 131 in VA
Livability — Danville
- Score
- 77/100
- State rank
- #91
- US rank
- #2952
Category grades
Schools grade is shown separately in the Schools card above.
Census & demographics
- Census place
- Danville, VA
- County
- Danville City · 59,055 people
- City population
- 59,055
- Metro
- Danville, VA
- Population (ZIP)
- 31,013
- Household income
- $47,924
- Rent vs Own
- Severe rent burden
- 1170.0
Population outlook (Danville County) Hauer SSP2
- Today (2025)
- 40,989 people
- By 2030
- 40,432 · -1.4%
- By 2040
- 39,255 · -4.2%
- By 2050
- 38,035 · -7.2%
- By 2075
- 35,612 · -13.1%
- By 2100
- 30,365 · -25.9%
Race, ethnicity, and origin ACS 2023
- Neighborhood character
- Diverse neighborhood (Simpson 0.57)
- Race & ethnicity
- White 50% Black 42% Two or more races 5% Hispanic / Latino 4%
- Common ancestry
- Slovak 1% Lithuanian 1% Serbian 1%
- Foreign-born
- 2% · Canada
- Languages at home
- 97% English-only · Spanish 2%
Political lean MEDSL · Danville
- 2024 margin
- Strong D (+21.1) · D 60.1% · R 39.0%
- 2008→2024 swing
- +1.9pp toward D · 2008: 19.1pp · 2024: 21.1pp
- All cycles
- 2024: D+21.1 2020: D+22.1 2016: D+19.9 2012: D+22.1 2008: D+19.1
Not yet ingested
- Civics
- —
Market trends
- HPI YoY
- ▼ -58.79%
- Current HPI
- 235.1746
- Rent YoY
- —
- Metro
- Danville, VA
- State GDP YoY
- ▲ 2.40%
- F500 in state
- 50
Industry mix (Fortune 500 HQ in VA)
| Industry | F500 HQs | Revenue |
|---|---|---|
| Aerospace / Defense | 4 | $236B |
|
||
| Technology / Defense | 3 | $32B |
|
||
| Financial Services | 2 | $176B |
|
||
| Utilities | 2 | $27B |
|
||
| Insurance | 2 | $25B |
|
||
| Technology | 2 | $15B |
|
||
Price history
-41.7% since first listed2 events — show timeline
- 2026-06-02 Listed $70,000 DRRAR
- 2014-10-28 Sold (Public Records) $120,000 Public Records
Property tax history
-0.7%/yrLatest (2025): $243 · +0.0% YoY. Source: county tax records.
Cash-flow waterfall
monthlySold comps — $/sqft
last 12 mo · ≤1 miLoading sold comps…