22 Roosevelt Unit 22 Roo · Cathedral City, CA
Flood risk 1/10 · Minimal
- FEMA flood zone
- X (shaded)
- Chance of flooding over 30 yrs
- 0.0%
- Est. flood insurance / yr
- $507 – $1,088
Fire risk 5/10 · Moderate
- Est. fire insurance / yr
- $659 – $1,223
Heat risk 9/10 · Severe
- Hot days now (above 112°F)
- 7 days/yr
- Hot days in 30 yrs
- 22 days/yr
Wind risk 1/10 · Minimal
- Chance of severe wind over 30 yrs
- —
Air-quality risk 5/10 · Moderate
- Unhealthy air days now
- 6 days/yr
- Unhealthy air days in 30 yrs
- 8 days/yr
Risk factors via First Street. Map © Google.
Why this score? — see what drove the B grade
The composite is a weighted blend of 9 inputs, each scored 0–100. Each bar is that input's sub-score; the figure is the points it added to the 100-point composite (weight × sub-score).
- Cash flow +30.0/30.0
- 1% rule +10.0/10.0
- DSCR +10.0/10.0
- ARV discount +7.5/15.0
- Condition / age +4.0/5.0
- Rent growth +3.3/5.0
- Livability +3.3/5.0
- Schools +2.7/10.0
- Appreciation +0.0/10.0
$62,500
🖨 Deal sheet (PDF) 📄 Offer letter ✓ Due diligence
Listing remarks MLS
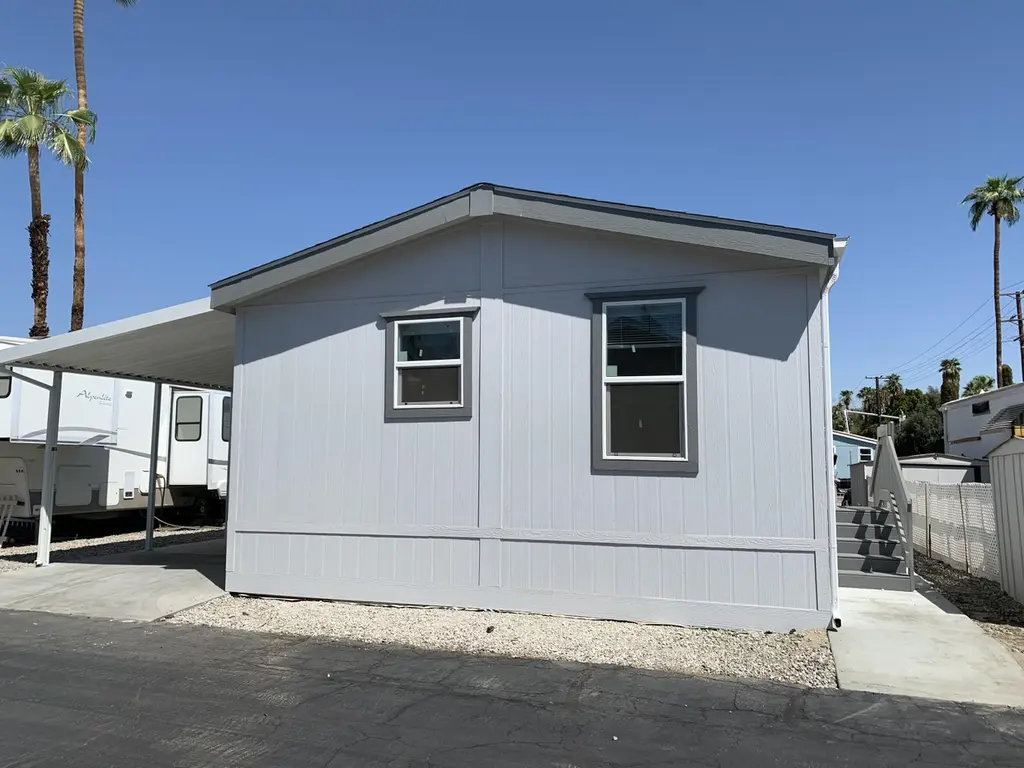
This brand new Fleetwood manufactured home has 1 bedroom, 1 bathroom and is approximately 620 sq ft. The kitchen has been upgraded with shaker style hardwood cabinets, granite countertops and backsplash, undermount stainless steel sink. The appliance package includes 18 CF refrigerator with icemaker, gas range, over-range microwave, dishwasher, and a garbage disposal. The bedroom and living room are carpeted; there is vinyl flooring throughout the remainder of the house. The bathroom has a glass enclosed tub/shower, granite countertop and backsplash, and undermount sink. Canned lighting, 3-door linen closet, area for stackable washer and dryer, covered carport parking and more!
Key facts
- Garbage disposal
- Over-range microwave
- Dishwasher
Tags
Neighborhood map
What this means for you Summary
Snapshot
- This is a 1-bed/1.0-bath manufactured listed at $62k. Condition is rated good.
Deal economics
- At list price, monthly cash flow is $923 ($11k/yr) — positive.
- The deal already cash-flows at list — no discount required.
- Meets the 1% rule at list price ($2k rent vs $62k).
- Recommended offer: $59k (6.0% below list) — sets the bar for market timing.
- Cap rate 24.0% vs local median 5.1% in Cathedral City — top-decile yield for the area; either an underpriced asset or a hidden risk that comps aren't pricing in. Stress-test before assuming the spread holds.
Location & tenants
- Location reads 66/100 on livability (#344 in CA) — a middle-class / working-renter tenant base. Strengths: commute A+, housing B+; Watch: employment D+, amenities D-, cost of living F.
- Palm Springs Unified (suburban): math 21% / reading 42% proficiency, ranked #328 of 517 in CA (top 63%) — families likely to look elsewhere, expect single-tenant / working-renter base with shorter leases; 73% free/reduced lunch — lower-income household profile, screen leases tightly.
- Zoned schools: Cathedral City Elementary (math 12% / reading 24%, grade F, #1,322 of 1,571 statewide, top 85%, 653 students, 98% FRL); Nellie N. Coffman Middle (953 students, 98% FRL); Cathedral City High (math 25% / reading 61%, grade F, #460 of 1,170 statewide, top 40%, 1,395 students, 98% FRL) — zoned schools average 98% FRL vs 73% district-wide (25 pts higher); higher-poverty schools than district average — tighter screening recommended.
- Market conditions: Rents rising (+3.2%/yr); 529 active listings in the ZIP; 24 comparable units currently listed for rent nearby; rentals at typical pace (median 24d on market — plan ~3-4 weeks tenant-placement turnaround); 9,195 units permitted in Riverside County in 2024 (1,512 in 5+ unit buildings).
Forward outlook
- Local home prices are declining (-3.0%/yr); year-one equity from $432 of loan paydown is wiped out by about $2k of value loss. Plan a longer hold.
- Riverside County population projected at +22% by 2050 — long-run rental-demand tailwind backs the buy-and-hold thesis.
- At projected returns (-3.0% appreciation + 3.2% rent growth), your $18k cash investment doubles in ~2 years — after that, you're playing with house money.
Negotiation context
- It's been on market 62 days — a 6% lower offer ($59k) is reasonable based on typical stale-listing flexibility.
- 4 sale attempts since 2y ago with the ask held roughly flat each time — persistent listings suggest the price (not the market) is what's stuck; bring a comps-based counter.
Risks & watch-outs
- Climate carrying-cost: moderate wildfire risk; extreme-heat days projected 7→22/yr by 2055 (HVAC capex compounding) — expect insurance premiums to compound above CPI over the hold.
Questions for the listing agent
- It's been on market 62 days. Have you received any prior offers? Is the seller open to a 6% concession, seller financing, or rate buy-down credit?
- Why hasn't it sold? Are there any deal-killer items the seller is aware of (foundation, flood, title, zoning, code violations)?
- Is there a deadline driving the sale (1031 exchange, divorce, estate, relocation)? That informs how much negotiation room exists.
- Schools are F-rated, which usually means shorter tenancies and higher turnover. Who's the typical renter profile here, and what's been the actual vacancy rate?
- What's the average days-on-market for RENTAL listings here right now (not sales)? A rising rental-DOM trend means longer vacancies and softer asking-rent achievability than the comps imply.
- What's the recent tenant-quality profile in this submarket — average credit score on applications, eviction rate, late-payment / NSF rate, and stable-employment percentage? A property-management company in the area should have these aggregated.
- How much new for-sale + rental construction is in the pipeline within 1–3 miles? Heavy new supply typically softens prices + rents 12–24 months out; constrained supply supports both.
Investment metrics
- 1% rule
- 2.74% ✓
- Cap rate
- 24.01%
- Cash-on-cash
- 63.29%
- DSCR
- 3.82
- GRM
- 3.0
CMA / ARV
- ARV (median comp)
- $23,633
- List price
- $62,500
- Delta
- 164.46%
- Verdict
- OVERPRICED
- Comps
- 5 within 1.0 mi
Show comp detail 3 sales within ~0.75 mi
| Address | Dist | Beds/Ba | Sqft | Sold | Price | $/sf | Match |
|---|---|---|---|---|---|---|---|
| 15 Garfield | 0.21mi | 1/1.0 | 576 (-6%) | 9mo | $16,500 | $29 | 73 |
| 17 Arthur Dr | 0.17mi | 2/1.0 (+1) | 672 (+10%) | 0mo | $23,000 | $34 | 70 |
| 9 Hayes | 0.25mi | 1/1.0 | 700 (+14%) | 14mo | $45,000 | $64 | 53 |
Match score weights: distance 35% · size 25% · config 20% · recency 20%. Top-matched comps best support the ARV.
Projected returns pro-forma
-3.0% appreciation · 3.22% rent growth · sell at horizon
- IRR
- 62.6%
- Equity multiple
- 3.80×
- Total profit
- $49,066
- Equity at exit
- $9,319
- IRR
- 67.2%
- Equity multiple
- 7.86×
- Total profit
- $120,098
- Equity at exit
- $5,404
Cash invested: $17,500 (down + closing). Projections, not guarantees.
Landlord ↔ Tenant lean methodology
- Overall (STATE)
- 18 Strongly Tenant-Friendly
- State California
- 18 Strongly Tenant-Friendly · D+13
- County
- — inherits STATE
- City
- — inherits STATE
ZIP-level market 92234
- Home prices YoY
- -27.7%
- Rents YoY
- 3.2%
- Active inventory
- 529
- Price-to-rent
- 3.0×
Monthly cashflow live
- Estimated rent
- $1,715 high interval (Pro) →
- Mortgage (P&I)
- −$328
- Tax est. 1.5%
- −$78 /mo · $938/yr
- Insurance
- −$26
- HOA
- −$0
- Vacancy / Maint / Mgmt
- −$360
- Net cashflow
- $923
Break-even live
Sensitivity live
| Price | -10% $966 | -5% $945 | +0% $923 | +5% $901 | +10% $880 |
|---|---|---|---|---|---|
| Rent | -10% $788 | -5% $855 | +0% $923 | +5% $991 | +10% $1,059 |
| Rate | -1.0pp $954 | -0.5pp $939 | base $923 | +0.5pp $907 | +1.0pp $890 |
UW: 25.0% down · 7.5% · 30yr · 1.5% tax · 5.0% vac · 8.0% maint · 8.0% mgmt
Financing live
Cash to close
- Down payment
- $15,625
- Closing costs
- $1,875
- Reserves months
- —
- Total cash needed
- —
Loan-product check · same deal, 3 products live
Conventional
25% down · 7.5% · 30yr
- Down + closing
- —
- Monthly P&I
- —
- Monthly cashflow
- —
- DSCR
- —
- Eligible?
- —
Personal DTI + credit; lowest rate.
DSCR
20% down · 8.5% · 30yr
- Down + closing
- —
- Monthly P&I
- —
- Monthly cashflow
- —
- DSCR
- —
- Eligible?
- —
No personal income docs; deal must DSCR.
Hard money
10% down · 12.0% · 12mo
- Down + closing
- —
- Monthly P&I
- —
- Monthly cashflow
- —
- DSCR
- —
- Eligible?
- —
Short-term bridge; refi at stabilization.
Rent comps 24 comps
| Address | Beds | Baths | Sqft | Rent | $/sqft | DOM | Units | Dist |
|---|---|---|---|---|---|---|---|---|
| 36953 Bankside Dr Unit 5 Cathedral City, CA | 1.0 | 1.0 | 700 | $1,595 | $2.28 | 3d | 1 | 0.50mi |
| 36953 Bankside Dr Unit A Cathedral City, CA | 1.0 | 1.0 | 700 | $1,495 | $2.14 | 26d | 1 | 0.50mi |
| 36953 Bankside Dr Unit 10 Cathedral City, CA | 1.0 | 1.0 | 700 | $1,495 | $2.14 | 23d | 1 | 0.50mi |
| 36957 Melrose Dr Unit 7 Cathedral City, CA | 1.0 | 1.0 | 700 | $1,495 | $2.14 | 23d | 1 | 0.53mi |
| 36957 Melrose Dr Unit C Cathedral City, CA | 1.0 | 1.0 | 700 | $1,495 | $2.14 | 26d | 1 | 0.53mi |
| 36947 Melrose Dr Unit 4 Cathedral City, CA | 1.0 | 1.0 | 700 | $1,595 | $2.28 | 26d | 1 | 0.54mi |
| 36947 Melrose Dr Unit D Cathedral City, CA | 1.0 | 1.0 | 700 | $1,595 | $2.28 | 23d | 1 | 0.54mi |
| 36947 Melrose Dr Unit 4 Cathedral City, CA | 1.0 | 1.0 | 700 | $1,595 | $2.28 | 4d | 1 | 0.54mi |
| 68365 Tahquitz Rd Unit 6 Cathedral City, CA | 1.0 | 1.0 | 600 | $1,695 | $2.83 | 23d | 1 | 0.64mi |
| 68365 Tahquitz Rd Unit 8 Cathedral City, CA | 1.0 | 1.0 | 600 | $1,695 | $2.83 | 4d | 1 | 0.64mi |
| 37112 Palo Verde Dr Unit 4 Cathedral City, CA | 1.0 | 1.0 | 600 | $1,595 | $2.66 | 4d | 1 | 0.68mi |
| 37112 Palo Verde Dr Unit 4 Cathedral City, CA | 1.0 | 1.0 | 600 | $1,595 | $2.66 | 26d | 1 | 0.68mi |
| 37112 Palo Verde Dr Unit 3 Cathedral City, CA | 1.0 | 1.0 | 600 | $1,595 | $2.66 | 23d | 1 | 0.68mi |
| 37156 Palo Verde Dr Unit D Cathedral City, CA | 1.0 | 1.0 | 600 | $1,595 | $2.66 | 26d | 1 | 0.69mi |
| 37156 Palo Verde Dr Cathedral City, CA | 1.0 | 1.0 | 600 | $1,595 | $2.66 | 4d | 1 | 0.69mi |
| 37156 Palo Verde Dr Unit 5 Cathedral City, CA | 1.0 | 1.0 | 600 | $1,595 | $2.66 | 23d | 1 | 0.69mi |
| 68460 Kings Rd Unit 3 Cathedral City, CA | 1.0 | 1.0 | 600 | $1,695 | $2.83 | 4d | 1 | 0.70mi |
| 68460 Kings Rd Unit C Cathedral City, CA | 1.0 | 1.0 | 600 | $1,695 | $2.83 | 23d | 1 | 0.70mi |
| 37111 Cathedral Canyon Dr Unit B Cathedral City, CA | 1.0 | 1.0 | 600 | $1,595 | $2.66 | 3d | 1 | 0.71mi |
| 37111 Cathedral Canyon Dr Unit A Cathedral City, CA | 1.0 | 1.0 | 600 | $1,595 | $2.66 | 26d | 1 | 0.71mi |
| 37111 Cathedral Canyon Dr Unit 2 Cathedral City, CA | 1.0 | 1.0 | 600 | $1,595 | $2.66 | 23d | 1 | 0.71mi |
| 37700 Van Fleet St Unit 3 Cathedral City, CA | 1.0 | 1.0 | 525 | $1,395 | $2.66 | 45d | 1 | 1.11mi |
| 38501 Bel Air Dr Cathedral City, CA | 1.0 | 1.0 | 468 | $1,600 | $3.42 | 19d | 1 | 1.26mi |
| 69333 E Palm Canyon Dr Spc 176 Cathedral City, CA | 1.0 | 1.0 | 560 | $1,500 | $2.68 | 1d | 1 | 1.36mi |
Listing history 27 events
-
2026-06-21days on market $62,500 Active 62 DOM
-
2026-06-18days on market $62,500 Active 59 DOM
-
2026-06-17days on market $62,500 Active 58 DOM
-
2026-06-16days on market $62,500 Active 57 DOM
-
2026-06-15days on market $62,500 Active 56 DOM
-
2026-06-13days on market $62,500 Active 54 DOM
-
2026-06-13days on market $62,500 Active 53 DOM
-
2026-06-09days on market $62,500 Active 50 DOM
-
2026-06-08days on market $62,500 Active 49 DOM
-
2026-06-07days on market $62,500 Active 48 DOM
-
2026-06-04days on market $62,500 Active 45 DOM
-
2026-06-03days on market $62,500 Active 44 DOM
-
2026-06-02remarks 699-char remark
-
2026-06-02days on market $62,500 Active 43 DOM
-
2026-06-01days on market $62,500 Active 42 DOM
-
2026-05-31days on market $62,500 Active 41 DOM
-
2026-04-20$62,500 Active 686-char remark
Show marketing remark (686 chars)
This brand new Fleetwood manufactured home has 1 bedroom, 1 bathroom and is approximately 620 sq ft. The kitchen has been upgraded with shaker style hardwood cabinets, granite countertops and backsplash, undermount stainless steel sink. The appliance package includes 18 CF refrigerator with icemaker, gas range, over-range microwave, dishwasher, and a garbage disposal. The bedroom and living room are carpeted; there is vinyl flooring throughout the remainder of the house. The bathroom has a glass enclosed tub/shower, granite countertop and backsplash, and undermount sink. Canned lighting, 3-door linen closet, area for stackable washer and dryer, covered carport parking and more!
-
2025-09-19historical
-
2025-07-09$74,900 Active
-
2025-07-08historical
-
2025-01-15price $74,900
-
2025-01-06$84,900 Active
-
2024-12-13historical
-
2024-11-23price $84,900
-
2024-10-26price $105,900
-
2024-08-07price $114,900
-
2024-06-13$119,900 Active
ⓘ Source: listings_history table (triggers on properties + properties_extension) + one-shot
backfill from property_details.listing_events for pre-trigger history.
Climate risk First Street
- Flood 1/10 Low FEMA zone X (shaded) · 0% chance over 30 yrs
- Wildfire 5/10 Major
- Heat 9/10 Extreme 7 d/yr ≥112°F today · 22 d/yr by 30 yrs out
- Wind 1/10 Low
- Air quality 5/10 Major 6 unhealthy d/yr today · 8 by 30 yrs out
Nearby sold comps map
Loading sold comps map…
Walkable amenities ~0.75 mi
Loading nearby amenities…
Taxation est. · year 1
- Rental income
- $20,581
- − Mortgage interest
- −$3,501
- − Property taxes
- −$938
- − Insurance
- −$312
- − Repairs & maintenance
- −$1,647
- − Management
- −$1,647
- − Depreciation
- −$1,818
- Taxable income
- $10,719
- Est. tax owed @ 24.0%
- −$2,573
- After-tax cash flow
- $8,504/yr
For passive investors: Depreciation is non-cash, so a rental often shows a tax loss while cash-flowing — sheltering income. Rental losses are passive: they offset passive income freely, and up to $25,000/yr can offset ordinary (W-2) income if you actively participate and your MAGI is under $100k (phasing out to $0 by $150k); unused losses carry forward. On sale, claimed depreciation is recaptured at up to 25%, and gains may owe capital-gains tax (a 1031 exchange can defer both). Figures are a year-1 estimate at your 24.0% rate — not tax advice; consult a CPA.
Condition & rehab AI · 12 photos
This Fleetwood manufactured home is in good condition with recent upgrades and a fresh paint job, making it a great investment for both resale and rental.
Value-add opportunities
- Both Paint exterior and interior walls — Fresh paint enhances curb appeal and interior aesthetics.
- Both Replace carpet with hardwood flooring in living room — Hardwood flooring is more durable and adds value.
- Both Install smart home devices — Smart home devices improve convenience and energy efficiency, attracting buyers and renters.
- Both Upgrade lighting fixtures — Modern lighting fixtures enhance the home's ambiance and energy efficiency.
Renovation cost estimate screening
Value-add ROI direction
- Both Paint exterior and interior walls — Fresh paint enhances curb appeal and interior aesthetics. ↑
- Both Replace carpet with hardwood flooring in living room — Hardwood flooring is more durable and adds value. ↑
- Both Install smart home devices — Smart home devices improve convenience and energy efficiency, attracting buyers and renters. ↑
- Both Upgrade lighting fixtures — Modern lighting fixtures enhance the home's ambiance and energy efficiency. ↑
ⓘ Cost ranges are severity-bucket heuristics (US national rule-of-thumb). Get contractor quotes + a written scope before underwriting a rehab budget.
Schools (NCES district)
- District
- Palm Springs Unified
- NCES district ID
- 0629550
- Math proficiency
- 21% ▼ -7.00%
- Reading proficiency
- 42% ▬ 0.00%
- Median HH income
- $43,638
- Composite
- 26.76/100
- National rank
- #7131
- State rank
- #328 of 517 in CA
Livability — Cathedral City
- Score
- 66/100
- State rank
- #344
- US rank
- #11749
Category grades
Schools grade is shown separately in the Schools card above.
Census & demographics
- Census place
- Cathedral City, CA
- County
- Riverside County · 2,287,001 people
- City population
- 52,267
- Metro
- Riverside-San Bernardino-Ontario, CA
- Population (ZIP)
- 52,267
- Household income
- $73,572
- Rent vs Own
- Severe rent burden
- 1682.0
Population outlook (Riverside County) Hauer SSP2
- Today (2025)
- 2,664,475 people
- By 2030
- 2,802,692 · +5.2%
- By 2040
- 3,050,904 · +14.5%
- By 2050
- 3,256,783 · +22.2%
- By 2075
- 3,655,058 · +37.2%
- By 2100
- 3,766,594 · +41.4%
Race, ethnicity, and origin ACS 2023
- Neighborhood character
- Diverse neighborhood (Simpson 0.56)
- Race & ethnicity
- Hispanic / Latino 59% White 30% Two or more races 27% Asian 6% Native American 2% Black 2%
- Hispanic origin (detail)
- Mexican 51%
- Common ancestry
- Lithuanian 2% Romanian 1% Italian 1%
- Foreign-born
- 28% · Canada, Vietnam
- Languages at home
- 48% English-only · Spanish 46% Tagalog/Filipino 3% Other Asian/Pacific 1%
Political lean MEDSL · Riverside
- 2024 margin
- Toss-up / Even · D 48.0% · R 49.3% · Other 2.6%
- 2008→2024 swing
- -3.6pp toward R · 2008: 2.3pp · 2024: -1.3pp
- All cycles
- 2024: R+1.3 2020: D+8.0 2016: D+4.3 2012: R+0.4 2008: D+2.3
Not yet ingested
- Civics
- —
Market trends
- HPI YoY
- ▼ -136.57%
- Current HPI
- 356.9845
- Rent YoY
- ▲ 3.22%
- Metro
- Riverside-San Bernardino-Ontario, CA
- State GDP YoY
- ▲ 3.21%
- F500 in state
- 116
Industry mix (Fortune 500 HQ in CA)
| Industry | F500 HQs | Revenue |
|---|---|---|
| Technology | 27 | $1,492B |
|
||
| Financial Services | 3 | $174B |
|
||
| Retail | 3 | $44B |
|
||
| Insurance | 3 | $26B |
|
||
| Media / Entertainment | 2 | $115B |
|
||
| Pharmaceuticals / Biotech | 2 | $62B |
|
||
Price history
-47.9% since first listed11 events — show timeline
- 2026-04-20 Listed $62,500 GPSMLS
- 2025-09-19 Listing Removed — GPSMLS
- 2025-07-09 Listed $74,900 GPSMLS
- 2025-07-08 Listing Removed — GPSMLS
- 2025-01-15 Price Changed $74,900 GPSMLS
- 2025-01-06 Listed $84,900 GPSMLS
- 2024-12-13 Listing Removed — GPSMLS
- 2024-11-23 Price Changed $84,900 GPSMLS
- 2024-10-26 Price Changed $105,900 GPSMLS
- 2024-08-07 Price Changed $114,900 GPSMLS
- 2024-06-13 Listed $119,900 GPSMLS
Cash-flow waterfall
monthlySold comps — $/sqft
last 12 mo · ≤1 miLoading sold comps…