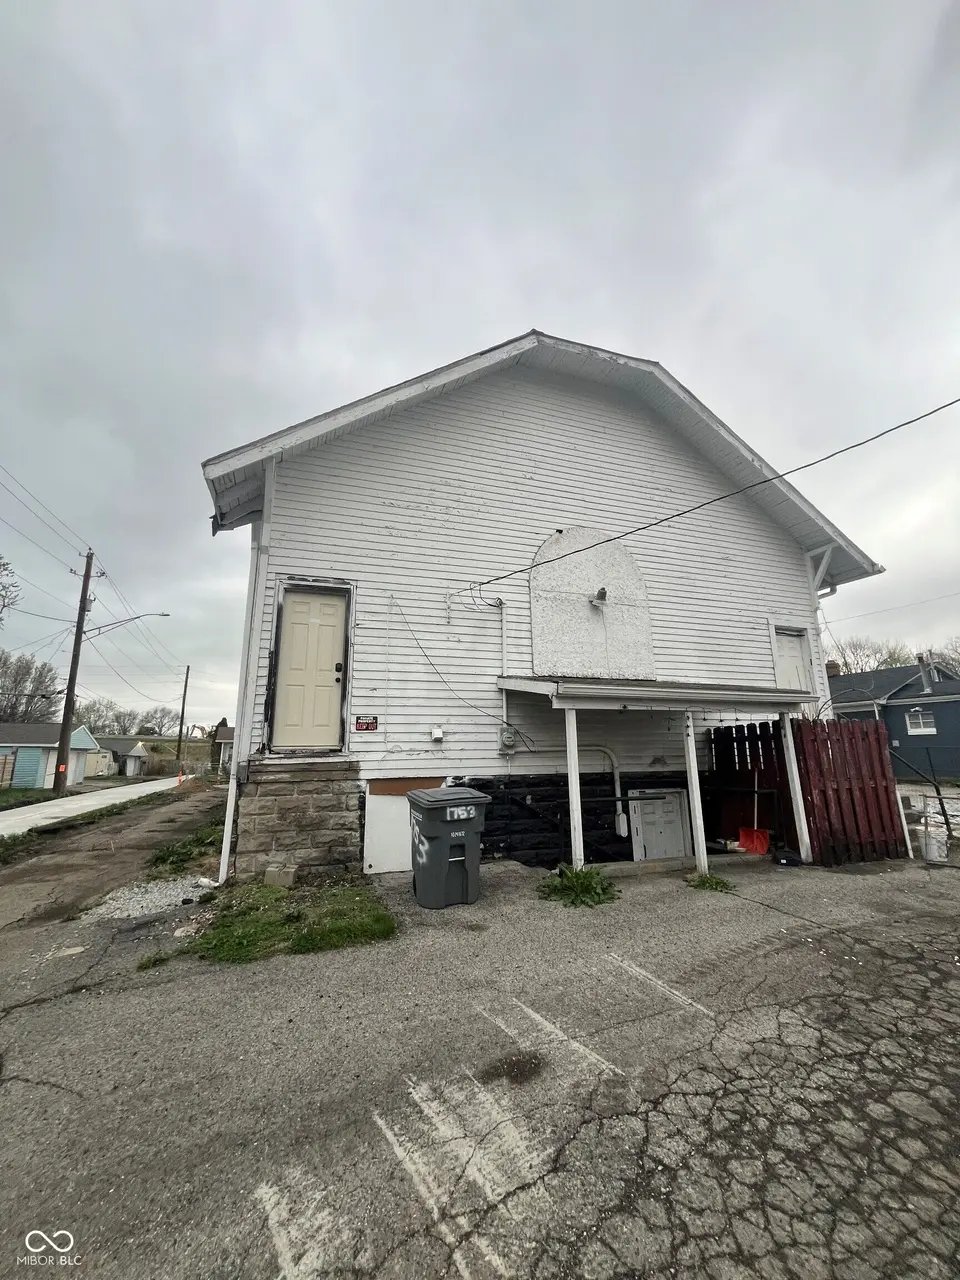
1753 Linden St · Indianapolis city (balance), IN
Flood risk No data
- FEMA flood zone
- —
- Chance of flooding over 30 yrs
- —
- Est. flood insurance / yr
- —
Fire risk No data
- Est. fire insurance / yr
- —
Heat risk No data
- Hot days now (above threshold)
- —
- Hot days in 30 yrs
- —
Wind risk No data
- Chance of severe wind over 30 yrs
- —
Air-quality risk No data
- Unhealthy air days now
- —
- Unhealthy air days in 30 yrs
- —
Risk factors via First Street. Map © Google.
Why this score? — see what drove the C- grade
The composite is a weighted blend of 9 inputs, each scored 0–100. Each bar is that input's sub-score; the figure is the points it added to the 100-point composite (weight × sub-score).
- Cash flow +22.1/30.0
- ARV discount +7.5/15.0
- DSCR +7.1/10.0
- 1% rule +5.8/10.0
- Rent growth +3.2/5.0
- Livability +2.5/5.0
- Schools +1.4/10.0
- Condition / age +1.0/5.0
- Appreciation +0.0/10.0
$155,000
🖨 Deal sheet 📄 Offer letter ✓ Due diligence
Listing remarks MLS
Investor special with serious upside in the 46203. Formerly a church and now zoned residential, this unique property offers a large footprint, flexible layout, and plenty of space to bring your vision to life. Located near downtown with access to major roads and close to the momentum of Fountain Square, Bates-Hendricks, and Garfield Park, this is a strong opportunity for redevelopment, resale, or long-term hold. Potential for creative residential reconfiguration, subject to zoning and approvals.
Key facts
- Zoned residential
- Flexible layout
- Near downtown
Tags
Neighborhood map
What this means for you Summary
Snapshot
- This is a 2-bed/1.0-bath other listed at $155k. Condition is rated poor.
Deal economics
- At list price, monthly cash flow is $248 ($3k/yr) — positive.
- The deal already cash-flows at list — no discount required.
- Meets the 1% rule at list price ($2k rent vs $155k).
- Recommended offer: $150k (3.0% below list) — sets the bar for market timing.
- Cap rate 8.2% vs local median 4.4% in Indianapolis city (balance) — top-decile yield for the area; either an underpriced asset or a hidden risk that comps aren't pricing in. Stress-test before assuming the spread holds.
Location & tenants
- Location reads: area grade C — affects rentability + tenant quality, not the cash-flow math above.
- Indianapolis Public Schools (urban): math 14% / reading 20% proficiency, ranked #286 of 301 in IN (top 95%) — low school quality limits family demand, transient renter base, plan for 1-2y turnover; 77% free/reduced lunch — lower-income household profile, screen leases tightly.
- Market conditions: Rents rising (+2.9%/yr); 493 active listings in the ZIP; 7 comparable units currently listed for rent nearby; rentals leasing fast (median 11d on market — plan ~1-2 weeks tenant-placement turnaround); 1,906 units permitted in Marion County in 2024 (621 in 5+ unit buildings).
- This rent runs 35% of the median local income ($57k/yr) — at the standard rent-burdened threshold; future hikes will face affordability resistance.
Forward outlook
- Local home prices are declining (-3.0%/yr); year-one equity from $1k of loan paydown is wiped out by about $5k of value loss. Plan a longer hold.
- Marion County population projected at +18% by 2050 — long-run rental-demand tailwind backs the buy-and-hold thesis.
Negotiation context
- It's been on market 57 days — a 3% lower offer ($150k) is reasonable based on typical stale-listing flexibility.
Risks & watch-outs
- Watch-outs: built in 1900 — expect roof / HVAC / electrical / plumbing capex.
Questions for the listing agent
- It's been on market 57 days. Have you received any prior offers? Is the seller open to a 3% concession, seller financing, or rate buy-down credit?
- Have any recent inspections been done? Can we get a copy of the seller's disclosures and any deferred-maintenance estimates?
- Built in 1900 — when were the roof, HVAC, electrical panel, plumbing, and water heater last replaced?
- Is there a deadline driving the sale (1031 exchange, divorce, estate, relocation)? That informs how much negotiation room exists.
- What's the average days-on-market for RENTAL listings here right now (not sales)? A rising rental-DOM trend means longer vacancies and softer asking-rent achievability than the comps imply.
- What's the recent tenant-quality profile in this submarket — average credit score on applications, eviction rate, late-payment / NSF rate, and stable-employment percentage? A property-management company in the area should have these aggregated.
- How much new for-sale + rental construction is in the pipeline within 1–3 miles? Heavy new supply typically softens prices + rents 12–24 months out; constrained supply supports both.
Investment metrics
- 1% rule
- 1.08% ✓
- Cap rate
- 8.22%
- Cash-on-cash
- 6.87%
- DSCR
- 1.31
- GRM
- 7.7
CMA / ARV
- ARV (median comp)
- $363,099
- List price
- $155,000
- Delta
- -57.31%
- Verdict
- UNDERPRICED
- Comps
- 20 within 1.0 mi
Projected returns pro-forma
-3.0% appreciation · 2.88% rent growth · sell at horizon
- IRR
- -5.9%
- Equity multiple
- 0.78×
- Total profit
- $-9,478
- Equity at exit
- $23,111
- IRR
- 3.6%
- Equity multiple
- 1.26×
- Total profit
- $11,388
- Equity at exit
- $13,402
Cash invested: $43,400 (down + closing). Projections, not guarantees.
Landlord ↔ Tenant lean methodology
- Overall (STATE)
- 90 Strongly Landlord-Friendly
- State Indiana
- 90 Strongly Landlord-Friendly · R+11
- County
- — inherits STATE
- City
- — inherits STATE
ZIP-level market 46203
- Home prices YoY
- -26.7%
- Rents YoY
- 2.9%
- Active inventory
- 493
- Price-to-rent
- 7.7×
Monthly cashflow live
- Estimated rent
- $1,670 high interval (Pro) →
- Mortgage (P&I)
- −$813
- Tax est. 1.5%
- −$194 /mo · $2,325/yr
- Insurance
- −$65
- HOA
- −$0
- Vacancy / Maint / Mgmt
- −$351
- Net cashflow
- $248
Break-even live
UW: 25.0% down · 7.5% · 30yr · 1.5% tax · 5.0% vac · 8.0% maint · 8.0% mgmt
Financing live
Cash to close
- Down payment
- $38,750
- Closing costs
- $4,650
- Reserves months
- —
- Total cash needed
- —
Loan-product check · same deal, 3 products live
Conventional
25% down · 7.5% · 30yr
- Down + closing
- —
- Monthly P&I
- —
- Monthly cashflow
- —
- DSCR
- —
- Eligible?
- —
Personal DTI + credit; lowest rate.
DSCR
20% down · 8.5% · 30yr
- Down + closing
- —
- Monthly P&I
- —
- Monthly cashflow
- —
- DSCR
- —
- Eligible?
- —
No personal income docs; deal must DSCR.
Hard money
10% down · 12.0% · 12mo
- Down + closing
- —
- Monthly P&I
- —
- Monthly cashflow
- —
- DSCR
- —
- Eligible?
- —
Short-term bridge; refi at stabilization.
Rent comps 7 comps
| Address | Beds | Baths | Sqft | Rent | $/sqft | DOM | Units | Dist |
|---|---|---|---|---|---|---|---|---|
| 1337 Barth Ave Indianapolis, IN | 3.0 | 1.0 | 2468 | $1,700 | $0.69 | 7d | 1 | 0.44mi |
| 1337 Barth Ave Indianapolis, IN | 3.0 | 1.0 | 2468 | $1,700 | $0.69 | 10d | 1 | 0.44mi |
| 1337 Barth Ave Indianapolis, IN | 3.0 | 1.0 | 2468 | $1,700 | $0.69 | 16d | 1 | 0.44mi |
| 1337 Barth Ave Unit NA Indianapolis, IN | 3.0 | 1.0 | 2468 | $1,700 | $0.69 | 4d | 1 | 0.44mi |
| 1301 Ringgold Ave Unit 1303750P Indianapolis, IN | 3.0 | 3.0 | 2884 | $6,514 | $2.26 | 43d | 1 | 0.50mi |
| 1441 Prospect St Indianapolis, IN | 2.0 | 1.0–2.0 | 2840 | $2,000 | $0.70 | 1d | 13 | 0.57mi |
| 117 S Arsenal Ave Indianapolis, IN | 3.0 | 2.0 | 2592 | $1,800 | $0.69 | 43d | 1 | 1.48mi |
Listing history 14 events
-
2026-06-18days on market $155,000 Active 57 DOM
-
2026-06-17days on market $155,000 Active 56 DOM
-
2026-06-16days on market $155,000 Active 55 DOM
-
2026-06-15days on market $155,000 Active 54 DOM
-
2026-06-13days on market $155,000 Active 52 DOM
-
2026-06-13days on market $155,000 Active 51 DOM
-
2026-06-09days on market $155,000 Active 48 DOM
-
2026-06-08days on market $155,000 Active 47 DOM
-
2026-06-07days on market $155,000 Active 46 DOM
-
2026-06-03days on market $155,000 Active 42 DOM
-
2026-06-02days on market $155,000 Active 41 DOM
-
2026-06-01days on market $155,000 Active 40 DOM
-
2026-05-31days on market $155,000 Active 39 DOM
-
2026-04-22$155,000 Active 500-char remark
Show marketing remark (500 chars)
Investor special with serious upside in the 46203. Formerly a church and now zoned residential, this unique property offers a large footprint, flexible layout, and plenty of space to bring your vision to life. Located near downtown with access to major roads and close to the momentum of Fountain Square, Bates-Hendricks, and Garfield Park, this is a strong opportunity for redevelopment, resale, or long-term hold. Potential for creative residential reconfiguration, subject to zoning and approvals.
ⓘ Source: listings_history table (triggers on properties + properties_extension) + one-shot
backfill from property_details.listing_events for pre-trigger history.
Nearby sold comps map
Loading sold comps map…
Walkable amenities ~0.75 mi
Loading nearby amenities…
Taxation est. · year 1
- Rental income
- $20,043
- − Mortgage interest
- −$8,682
- − Property taxes
- −$2,325
- − Insurance
- −$775
- − Repairs & maintenance
- −$1,603
- − Management
- −$1,603
- − Depreciation
- −$4,509
- Taxable income
- $544
- Est. tax owed @ 24.0%
- −$131
- After-tax cash flow
- $2,849/yr
For passive investors: Depreciation is non-cash, so a rental often shows a tax loss while cash-flowing — sheltering income. Rental losses are passive: they offset passive income freely, and up to $25,000/yr can offset ordinary (W-2) income if you actively participate and your MAGI is under $100k (phasing out to $0 by $150k); unused losses carry forward. On sale, claimed depreciation is recaptured at up to 25%, and gains may owe capital-gains tax (a 1031 exchange can defer both). Figures are a year-1 estimate at your 24.0% rate — not tax advice; consult a CPA.
Condition & rehab AI · 2 photos
This property requires extensive repairs and structural stabilization, making it a significant investment opportunity with high potential for value appreciation.
Repairs flagged
- Major roof — Significant damage to the roof structure
- Major exterior siding — Weathered and damaged
- Major structural beams — Exposed and damaged
- Major landscaping — Overgrown vegetation and debris
Value-add opportunities
- Both structural repairs — Stabilizing the structure is crucial for both resale and rental
- Both exterior siding replacement — Aesthetic improvement and increased curb appeal
- Both roof repair/replacement — Critical for both safety and property value
- Both landscaping and curb appeal — Enhances property value and attracts potential buyers/tenants
Renovation cost estimate screening
| Repair item | Severity | Est. cost |
|---|---|---|
| roof · Significant damage to the roof structure | Major | $15,000–50,000 |
| exterior siding · Weathered and damaged | Major | $15,000–50,000 |
| structural beams · Exposed and damaged | Major | $15,000–50,000 |
| landscaping · Overgrown vegetation and debris | Major | $15,000–50,000 |
| Total estimated repair cost · 4 items | $60,000–200,000 |
Value-add ROI direction
- Both structural repairs — Stabilizing the structure is crucial for both resale and rental ↑
- Both exterior siding replacement — Aesthetic improvement and increased curb appeal ↑
- Both roof repair/replacement — Critical for both safety and property value ↑
- Both landscaping and curb appeal — Enhances property value and attracts potential buyers/tenants ↑
ⓘ Cost ranges are severity-bucket heuristics (US national rule-of-thumb). Get contractor quotes + a written scope before underwriting a rehab budget.
Schools (NCES district)
- District
- Indianapolis Public Schools
- NCES district ID
- 1804770
- Math proficiency
- 14% ▼ -7.00%
- Reading proficiency
- 20% ▼ -3.00%
- Median HH income
- $32,034
- Composite
- 13.69/100
- National rank
- #9499
- State rank
- #286 of 301 in IN
Livability — Indianapolis city (balance)
No livability data for this city. (Only ~50 U.S. cities are tracked.)
Census & demographics
- Census place
- Indianapolis city (balance), IN
- County
- Marion County · 998,460 people
- City population
- 881,119
- Metro
- Indianapolis-Carmel-Anderson, IN
- Population (ZIP)
- 37,758
- Household income
- $57,393
- Rent vs Own
- Severe rent burden
- 1499.0
Population outlook (Marion County) Hauer SSP2
- Today (2025)
- 1,025,572 people
- By 2030
- 1,065,727 · +3.9%
- By 2040
- 1,141,577 · +11.3%
- By 2050
- 1,208,920 · +17.9%
- By 2075
- 1,367,288 · +33.3%
- By 2100
- 1,438,201 · +40.2%
Race, ethnicity, and origin ACS 2023
- Neighborhood character
- Predominantly White (69%)
- Race & ethnicity
- White 69% Hispanic / Latino 14% Black 12% Two or more races 8% Asian 2% Native American 1%
- Hispanic origin (detail)
- Mexican 12% Puerto Rican 1%
- Common ancestry
- Slovak 2% Lithuanian 2% Italian 1%
- Foreign-born
- 8% · Canada
- Languages at home
- 88% English-only · Spanish 10% Other Indo-European 1%
Political lean MEDSL · Marion
- 2024 margin
- Strong D (+27.7) · D 63.0% · R 35.3% · Other 1.7%
- 2008→2024 swing
- -0.7pp no change · 2008: 28.4pp · 2024: 27.7pp
- All cycles
- 2024: D+27.7 2020: D+29.1 2016: D+22.8 2012: D+22.2 2008: D+28.4
Not yet ingested
- Civics
- —
Market trends
- HPI YoY
- ▼ -127.37%
- Current HPI
- 349.579
- Rent YoY
- ▲ 2.88%
- Metro
- Indianapolis-Carmel-Anderson, IN
- State GDP YoY
- ▲ 2.90%
- F500 in state
- 18
Industry mix (Fortune 500 HQ in IN)
| Industry | F500 HQs | Revenue |
|---|---|---|
| Industrial Machinery | 2 | $37B |
|
||
| Healthcare | 1 | $177B |
|
||
| Pharmaceuticals | 1 | $45B |
|
||
| Metals / Steel | 1 | $18B |
|
||
| Agriculture | 1 | $17B |
|
||
| Packaging | 1 | $12B |
|
||
Price history
1 event — show timeline
- 2026-04-22 Listed $155,000 MIBOR as Distributed by MLS Grid
Cash-flow waterfall
monthlySold comps — $/sqft
last 12 mo · ≤1 miLoading sold comps…