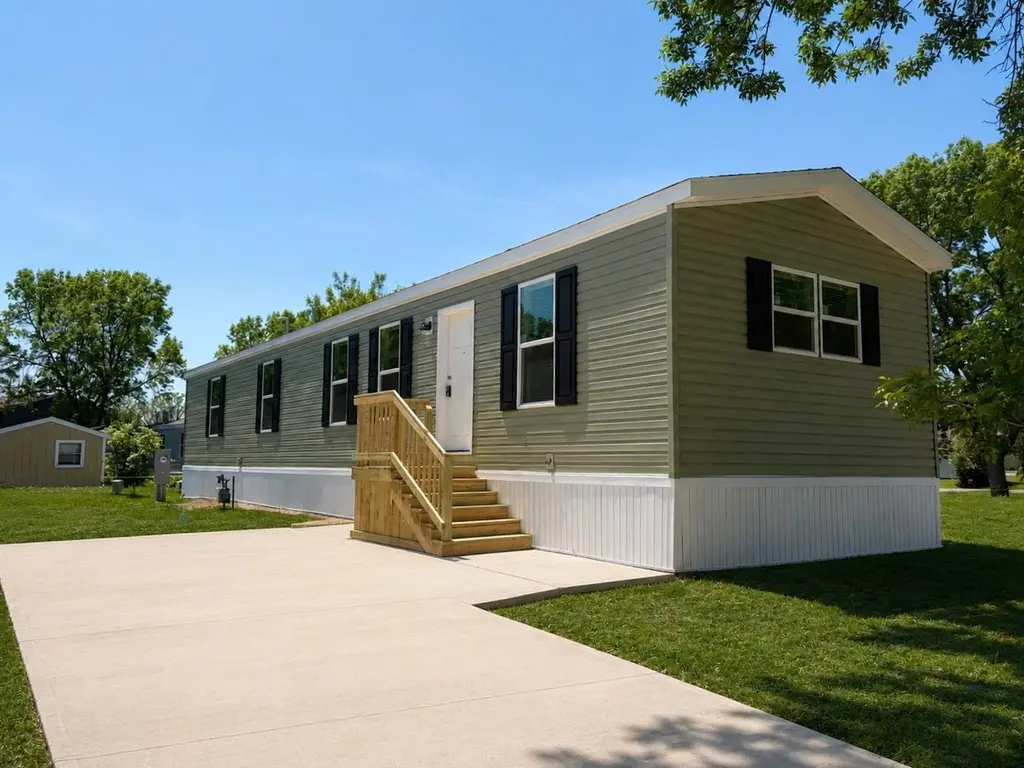
2136-20 1/8th Avenue Site #114 · Stanfold, WI
Flood risk 1/10 · Minimal
- FEMA flood zone
- X (unshaded)
- Chance of flooding over 30 yrs
- 0.0%
- Est. flood insurance / yr
- $473 – $860
Fire risk 1/10 · Minimal
- Est. fire insurance / yr
- $636 – $1,182
Heat risk 1/10 · Minimal
- Hot days now (above 96°F)
- 6 days/yr
- Hot days in 30 yrs
- 11 days/yr
Wind risk 1/10 · Minimal
- Chance of severe wind over 30 yrs
- —
Air-quality risk 2/10 · Minimal
- Unhealthy air days now
- 0 days/yr
- Unhealthy air days in 30 yrs
- 1 days/yr
Risk factors via First Street. Map © Google.
Why this score? — see what drove the B grade
The composite is a weighted blend of 9 inputs, each scored 0–100. Each bar is that input's sub-score; the figure is the points it added to the 100-point composite (weight × sub-score).
- Cash flow +30.0/30.0
- 1% rule +10.0/10.0
- DSCR +10.0/10.0
- ARV discount +7.5/15.0
- Condition / age +5.0/5.0
- Schools +3.3/10.0
- Rent growth +2.5/5.0
- Livability +2.5/5.0
- Appreciation +0.0/10.0
$66,900
🖨 Deal sheet 📄 Offer letter ✓ Due diligence
Listing remarks
Your brand new 3 bedroom, 2 bathroom home is waiting for you to move in! This comfortable home features premium entry doors, a modern bathroom, as well as new brand name appliances. In the community, enjoy with your friends and family all the amenities we have to offer such as community events. This home won't be on the market long, so call us today for more information or to schedule a tour. Deposits & Fees are subject to change.
Key facts
- Modern bathroom
- Premium entry doors
- Built 2026
Tags
Property features AI
Finance
- Financial info: List price $66,900
Exterior
- Utilities: Natural gas; Central air
- Home design: Spec new-construction plan 94254; Address: 2136-20 1/8th Avenue Site #114, Rice Lake, WI
- Exterior features: Living area of 1,056 (listed)
Interior
- Bedrooms: 3 bedrooms
- Bathrooms: 2 full bathrooms
- Heating & cooling: Natural gas heating; Central air conditioning
- Interior features: Active status
Neighborhood map
What this means for you Summary
Snapshot
- This is a 3-bed/2.0-bath manufactured listed at $67k. Condition is rated excellent.
Deal economics
- At list price, monthly cash flow is $578 ($7k/yr) — positive.
- The deal already cash-flows at list — no discount required.
- Meets the 1% rule at list price ($1k rent vs $67k).
Location & tenants
- Location reads: area grade B — affects rentability + tenant quality, not the cash-flow math above.
- Rice Lake Area School District (town): math 41% / reading 37% proficiency, ranked #184 of 342 in WI (top 54%) — families likely to look elsewhere, expect single-tenant / working-renter base with shorter leases.
- Market conditions: 135 active listings in the ZIP; 156 units permitted in Barron County in 2024 (0 in 5+ unit buildings).
Forward outlook
- Local home prices are declining (-3.0%/yr); year-one equity from $463 of loan paydown is wiped out by about $2k of value loss. Plan a longer hold.
- Barron County population projected at -18% by 2050 — secular population decline; favor cash flow + early exit over multi-decade hold.
- At projected returns (-3.0% appreciation + 3.0% rent growth), your $19k cash investment doubles in ~4 years — after that, you're playing with house money.
Negotiation context
- Only 6 days on market — expect competitive offers; lowballing is unlikely to land.
Questions for the listing agent
- Is there a deadline driving the sale (1031 exchange, divorce, estate, relocation)? That informs how much negotiation room exists.
- What's the average days-on-market for RENTAL listings here right now (not sales)? A rising rental-DOM trend means longer vacancies and softer asking-rent achievability than the comps imply.
- What's the recent tenant-quality profile in this submarket — average credit score on applications, eviction rate, late-payment / NSF rate, and stable-employment percentage? A property-management company in the area should have these aggregated.
- How much new for-sale + rental construction is in the pipeline within 1–3 miles? Heavy new supply typically softens prices + rents 12–24 months out; constrained supply supports both.
Investment metrics
- 1% rule
- 1.97% ✓
- Cap rate
- 16.67%
- Cash-on-cash
- 37.05%
- DSCR
- 2.65
- GRM
- 4.2
CMA / ARV
No comps found within radius.
Projected returns pro-forma
-3.0% appreciation · 3.0% rent growth · sell at horizon
- IRR
- 32.9%
- Equity multiple
- 2.39×
- Total profit
- $26,010
- Equity at exit
- $9,975
- IRR
- 39.9%
- Equity multiple
- 4.75×
- Total profit
- $70,155
- Equity at exit
- $5,784
Cash invested: $18,732 (down + closing). Projections, not guarantees.
Landlord ↔ Tenant lean methodology
- Overall (STATE)
- 73 Landlord-Friendly
- State Wisconsin
- 73 Landlord-Friendly · R+2
- County
- — inherits STATE
- City
- — inherits STATE
ZIP-level market 54868
- Home prices YoY
- -33.3%
- Active inventory
- 135
- Price-to-rent
- 4.2×
Monthly cashflow live
- Estimated rent
- $1,317 medium interval (Pro) →
- Mortgage (P&I)
- −$351
- Tax est. 1.5%
- −$84 /mo · $1,004/yr
- Insurance
- −$28
- HOA
- −$0
- Vacancy / Maint / Mgmt
- −$277
- Net cashflow
- $578
Break-even live
UW: 25.0% down · 7.5% · 30yr · 1.5% tax · 5.0% vac · 8.0% maint · 8.0% mgmt
Financing live
Cash to close
- Down payment
- $16,725
- Closing costs
- $2,007
- Reserves months
- —
- Total cash needed
- —
Loan-product check · same deal, 3 products live
Conventional
25% down · 7.5% · 30yr
- Down + closing
- —
- Monthly P&I
- —
- Monthly cashflow
- —
- DSCR
- —
- Eligible?
- —
Personal DTI + credit; lowest rate.
DSCR
20% down · 8.5% · 30yr
- Down + closing
- —
- Monthly P&I
- —
- Monthly cashflow
- —
- DSCR
- —
- Eligible?
- —
No personal income docs; deal must DSCR.
Hard money
10% down · 12.0% · 12mo
- Down + closing
- —
- Monthly P&I
- —
- Monthly cashflow
- —
- DSCR
- —
- Eligible?
- —
Short-term bridge; refi at stabilization.
Listing history 7 events
-
2026-06-18days on market $66,900 Active 6 DOM
-
2026-06-17days on market $66,900 Active 5 DOM
-
2026-06-16days on market $66,900 Active 4 DOM
-
2026-06-15days on market $66,900 Active 3 DOM
-
2026-06-15days on market $66,900 Active 2 DOM
-
2026-06-12remarks 436-char remark
-
2026-06-12$66,900 Active 1 DOM
ⓘ Source: listings_history table (triggers on properties + properties_extension) + one-shot
backfill from property_details.listing_events for pre-trigger history.
Climate risk First Street
- Flood 1/10 Low FEMA zone X (unshaded) · 0% chance over 30 yrs
- Wildfire 1/10 Low
- Heat 1/10 Low 6 d/yr ≥96°F today · 11 d/yr by 30 yrs out
- Wind 1/10 Low
- Air quality 2/10 Low 0 unhealthy d/yr today · 1 by 30 yrs out
Nearby sold comps map
Loading sold comps map…
Walkable amenities ~0.75 mi
Loading nearby amenities…
Taxation est. · year 1
- Rental income
- $15,807
- − Mortgage interest
- −$3,747
- − Property taxes
- −$1,004
- − Insurance
- −$334
- − Repairs & maintenance
- −$1,265
- − Management
- −$1,265
- − Depreciation
- −$1,946
- Taxable income
- $6,246
- Est. tax owed @ 24.0%
- −$1,499
- After-tax cash flow
- $5,440/yr
For passive investors: Depreciation is non-cash, so a rental often shows a tax loss while cash-flowing — sheltering income. Rental losses are passive: they offset passive income freely, and up to $25,000/yr can offset ordinary (W-2) income if you actively participate and your MAGI is under $100k (phasing out to $0 by $150k); unused losses carry forward. On sale, claimed depreciation is recaptured at up to 25%, and gains may owe capital-gains tax (a 1031 exchange can defer both). Figures are a year-1 estimate at your 24.0% rate — not tax advice; consult a CPA.
Condition & rehab AI · 10 photos
This brand new 3-bedroom, 2-bathroom home is move-in ready with modern finishes and a great location. It's a perfect investment opportunity with minimal updates needed to maximize its value.
Value-add opportunities
- Both Painting the exterior and interior walls — Fresh paint can enhance curb appeal and interior aesthetics.
- Both Replacing the carpet with hardwood flooring in the bedrooms — Hardwood flooring is more durable and can increase the home's value.
- Both Upgrading the kitchen appliances to more modern models — Modern appliances can attract more buyers and renters.
- Both Adding a smart home system — Smart home features can increase the home's appeal and value.
- Both Landscaping the front yard — A well-maintained front yard can improve curb appeal and attract more buyers and renters.
Renovation cost estimate screening
Value-add ROI direction
- Both Painting the exterior and interior walls — Fresh paint can enhance curb appeal and interior aesthetics. ↑
- Both Replacing the carpet with hardwood flooring in the bedrooms — Hardwood flooring is more durable and can increase the home's value. ↑
- Both Upgrading the kitchen appliances to more modern models — Modern appliances can attract more buyers and renters. ↑
- Both Adding a smart home system — Smart home features can increase the home's appeal and value. ↑
- Both Landscaping the front yard — A well-maintained front yard can improve curb appeal and attract more buyers and renters. ↑
ⓘ Cost ranges are severity-bucket heuristics (US national rule-of-thumb). Get contractor quotes + a written scope before underwriting a rehab budget.
Schools (NCES district)
- District
- Rice Lake Area School District
- NCES district ID
- 5512810
- Math proficiency
- 41% ▼ -9.00%
- Reading proficiency
- 37% ▼ -8.00%
- Median HH income
- $43,299
- Composite
- 33.05/100
- National rank
- #5571
- State rank
- #184 of 342 in WI
Livability — Stanfold
No livability data for this city. (Only ~50 U.S. cities are tracked.)
Census & demographics
- Population (ZIP)
- 16,054
Population outlook (Barron County) Hauer SSP2
- Today (2025)
- 44,046 people
- By 2030
- 42,731 · -3.0%
- By 2040
- 39,513 · -10.3%
- By 2050
- 36,157 · -17.9%
- By 2075
- 29,204 · -33.7%
- By 2100
- 22,649 · -48.6%
Race, ethnicity, and origin ACS 2023
- Neighborhood character
- Predominantly White (93%)
- Race & ethnicity
- White 93% Hispanic / Latino 3% Two or more races 2%
- Common ancestry
- Portuguese 17% Lithuanian 6% Romanian 5%
- Foreign-born
- 2% · Canada
- Languages at home
- 98% English-only · Spanish 1%
Political lean MEDSL · Barron
- 2024 margin
- Strong R (+29.1) · D 33.4% · R 62.5% · Other 4.1%
- 2008→2024 swing
- -36.2pp toward R · 2008: 7.1pp · 2024: -29.1pp
- All cycles
- 2024: R+29.1 2020: R+26.1 2016: R+25.4 2012: R+2.4 2008: D+7.1
Not yet ingested
- Civics
- —
Market trends
- HPI YoY
- ▼ -110.44%
- Current HPI
- 221.0095
- Rent YoY
- —
- Metro
- —
- State GDP YoY
- ▲ 2.10%
- F500 in state
- 20
Industry mix (Fortune 500 HQ in WI)
| Industry | F500 HQs | Revenue |
|---|---|---|
| Industrial Machinery | 4 | $23B |
|
||
| Industrial Technology | 2 | $36B |
|
||
| Insurance | 1 | $36B |
|
||
| Professional Services | 1 | $19B |
|
||
| Utilities | 1 | $9B |
|
||
| Consumer Goods | 1 | $3B |
|
||
Cash-flow waterfall
monthlySold comps — $/sqft
last 12 mo · ≤1 miLoading sold comps…