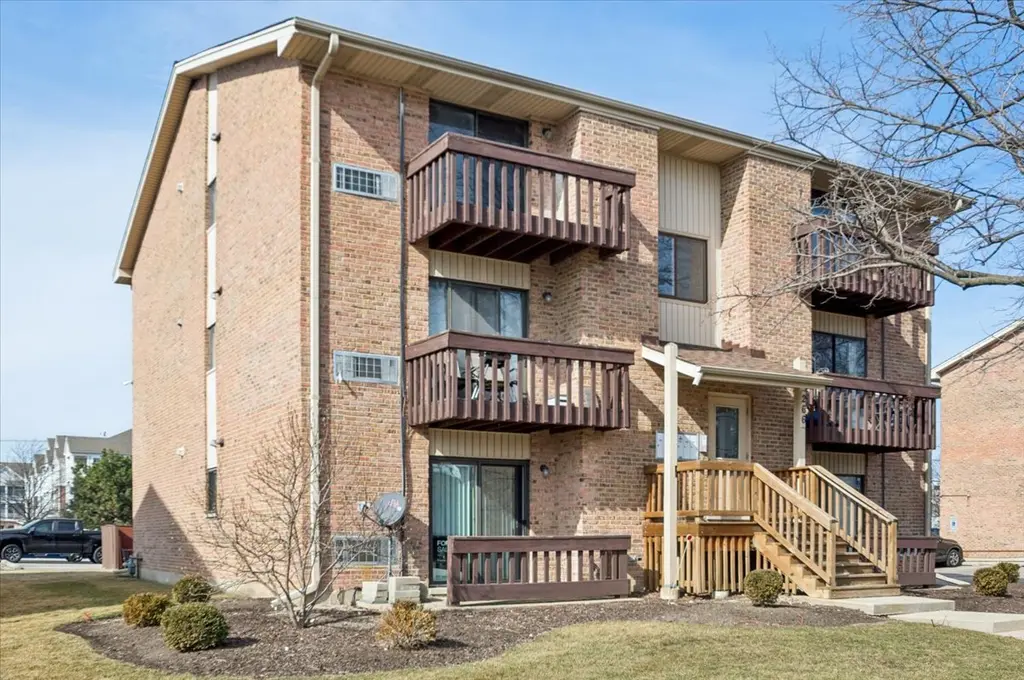
266 12th St Unit 3A · Wheeling, IL
Flood risk 1/10 · Minimal
- FEMA flood zone
- X (shaded)
- Chance of flooding over 30 yrs
- 0.0%
- Est. flood insurance / yr
- $507 – $1,088
Fire risk 1/10 · Minimal
- Est. fire insurance / yr
- $804 – $1,492
Heat risk 3/10 · Minor
- Hot days now (above 99°F)
- 7 days/yr
- Hot days in 30 yrs
- 14 days/yr
Wind risk 2/10 · Minimal
- Chance of severe wind over 30 yrs
- —
Air-quality risk 4/10 · Minor
- Unhealthy air days now
- 4 days/yr
- Unhealthy air days in 30 yrs
- 4 days/yr
Risk factors via First Street. Map © Google.
Why this score? — see what drove the C- grade
The composite is a weighted blend of 9 inputs, each scored 0–100. Each bar is that input's sub-score; the figure is the points it added to the 100-point composite (weight × sub-score).
- Cash flow +18.1/30.0
- ARV discount +7.5/15.0
- 1% rule +6.6/10.0
- DSCR +5.7/10.0
- Schools +3.9/10.0
- Livability +3.6/5.0
- Rent growth +2.9/5.0
- Condition / age +2.5/5.0
- Appreciation +0.0/10.0
$165,000
🖨 Deal sheet 📄 Offer letter ✓ Due diligence
Listing remarks
Charming 1-bd, 1-bath first-floor condo in Wheeling! Features laminate flooring, updated bath, new dishwasher, walk-in closet and in-unit washer/dryer. Enjoy the outdoors in your own private balcony. Pet-friendly building with 2 parking spots and storage. Conveniently located near train, bus, Recreation Center, shopping, and restaurants. Perfect for investors or owner-occupants!
Key facts
- 2 parking spots
- Updated bath
- Storage
Tags
Property features AI
Finance
- Other: Not currently leased; Possession: Immediate
- HOA & community: Monthly association fee of $336; HOA covers water, parking, insurance, exterior maintenance, lawn care, trash (scavenger) and snow removal; Association amenities include storage; Manager off-site; Pets allowed (cats and dogs)
Exterior
- Parking: 2 parking spaces (unassigned and other)
- Utilities: Water source: Lake Michigan; Public sewer; Electric service with circuit breakers
- Home design: Attached single, condominium; Entry at level 1; Part of a 6-unit building; Brick construction; Estimated living area; Building age approximately 41–50 years; School bus, commuter bus, and commuter train nearby
- Construction: Brick exterior
- Exterior features: Balcony
Interior
- Kitchen: Galley kitchen on main level (12 x 11) with blinds and wood laminate flooring; Range; Dishwasher; Refrigerator
- Bedrooms: Master bedroom on main level (15 x 12) with blinds and carpet; Additional bedroom(s) present
- Flooring: Laminate flooring; Carpet; Vinyl in laundry
- Bathrooms: 1 full bathroom
- Heating & cooling: Electric heat; Wall cooling unit(s)
- Interior features: First-floor bedroom; Storage; L-shaped dining area; Total of 4 rooms
- Laundry & utility: In-unit laundry with washer hookup; Washer; Dryer; Laundry room on main level (5 x 5) with vinyl flooring
Neighborhood map
What this means for you Summary
Snapshot
- This is a 1-bed/1.0-bath condo listed at $165k.
Deal economics
- At list price, monthly cash flow is $146 ($2k/yr) — positive.
- The deal already cash-flows at list — no discount required.
- Meets the 1% rule at list price ($2k rent vs $165k).
- Recommended offer: $163k (1.5% below list) — sets the bar for market timing.
- Cap rate 7.4% vs local median 3.8% in Wheeling — top-decile yield for the area; either an underpriced asset or a hidden risk that comps aren't pricing in. Stress-test before assuming the spread holds.
Location & tenants
- Location reads 71/100 on livability (#335 in IL) — a middle-class / working-renter tenant base. Strengths: crime A+, commute A+, employment A+; Watch: schools F, amenities F, health & safety F.
- Township Hsd 214 (suburban): math 42% / reading 45% proficiency, ranked #103 of 620 in IL (top 17%) — families likely to look elsewhere, expect single-tenant / working-renter base with shorter leases.
- Market conditions: Rents rising (+1.8%/yr); 63 active listings in the ZIP; 33 comparable units currently listed for rent nearby; rentals leasing fast (median 2d on market — plan ~1-2 weeks tenant-placement turnaround); solid renter incomes; 6,272 units permitted in Cook County in 2024 (4,658 in 5+ unit buildings).
Forward outlook
- Local home prices are declining (-3.0%/yr); year-one equity from $1k of loan paydown is wiped out by about $5k of value loss. Plan a longer hold.
Negotiation context
- It's been on market 29 days — a 2% lower offer ($163k) is reasonable based on typical stale-listing flexibility.
- 3 sale attempts since 8y ago with the ask held roughly flat each time — persistent listings suggest the price (not the market) is what's stuck; bring a comps-based counter.
- Current owner paid $85k; list at $165k implies a 94% gain — meaningful room to come down on a strong offer.
Questions for the listing agent
- What does the HOA fee cover, when was the last increase, and are there any pending special assessments or reserve-fund shortfalls?
- Any open or pending special assessments — roof, HVAC, plumbing, elevator, façade? What's the per-unit balance and payoff schedule, and is the seller paying it off at close or rolling it to the buyer?
- Is there a deadline driving the sale (1031 exchange, divorce, estate, relocation)? That informs how much negotiation room exists.
- Schools are F-rated, which usually means shorter tenancies and higher turnover. Who's the typical renter profile here, and what's been the actual vacancy rate?
- What's the average days-on-market for RENTAL listings here right now (not sales)? A rising rental-DOM trend means longer vacancies and softer asking-rent achievability than the comps imply.
- What's the recent tenant-quality profile in this submarket — average credit score on applications, eviction rate, late-payment / NSF rate, and stable-employment percentage? A property-management company in the area should have these aggregated.
- How much new apartment / multifamily construction is in the pipeline within 1–3 miles? Heavy new supply (>2% of stock underway) typically softens rents 12–24 months out; light construction supports rent growth.
Investment metrics
- 1% rule
- 1.16% ✓
- Cap rate
- 7.35%
- Cash-on-cash
- 3.79%
- DSCR
- 1.17
- GRM
- 7.2
CMA / ARV
No comps found within radius.
Projected returns pro-forma
-3.0% appreciation · 1.75% rent growth · sell at horizon
- IRR
- -11.9%
- Equity multiple
- 0.57×
- Total profit
- $-19,669
- Equity at exit
- $24,602
- IRR
- -4.9%
- Equity multiple
- 0.70×
- Total profit
- $-14,021
- Equity at exit
- $14,266
Cash invested: $46,200 (down + closing). Projections, not guarantees.
Landlord ↔ Tenant lean methodology
- Overall (STATE)
- 43 Moderately Tenant-Leaning
- State Illinois
- 43 Moderately Tenant-Leaning · D+7
- County
- — inherits STATE
- City
- — inherits STATE
ZIP-level market 60090
- Rents YoY
- 1.8%
- Active inventory
- 63
- Price-to-rent
- 7.2×
Monthly cashflow live
- Estimated rent
- $1,918 high interval (Pro) →
- Mortgage (P&I)
- −$865
- Tax from tax record
- −$100 /mo · $1,197/yr
- Insurance
- −$69
- HOA
- −$336
- Vacancy / Maint / Mgmt
- −$403
- Net cashflow
- $146
Break-even live
UW: 25.0% down · 7.5% · 30yr · 1.5% tax · 5.0% vac · 8.0% maint · 8.0% mgmt
Financing live
Cash to close
- Down payment
- $41,250
- Closing costs
- $4,950
- Reserves months
- —
- Total cash needed
- —
Loan-product check · same deal, 3 products live
Conventional
25% down · 7.5% · 30yr
- Down + closing
- —
- Monthly P&I
- —
- Monthly cashflow
- —
- DSCR
- —
- Eligible?
- —
Personal DTI + credit; lowest rate.
DSCR
20% down · 8.5% · 30yr
- Down + closing
- —
- Monthly P&I
- —
- Monthly cashflow
- —
- DSCR
- —
- Eligible?
- —
No personal income docs; deal must DSCR.
Hard money
10% down · 12.0% · 12mo
- Down + closing
- —
- Monthly P&I
- —
- Monthly cashflow
- —
- DSCR
- —
- Eligible?
- —
Short-term bridge; refi at stabilization.
Rent comps 33 comps
| Address | Beds | Baths | Sqft | Rent | $/sqft | DOM | Units | Dist |
|---|---|---|---|---|---|---|---|---|
| 200 Hudson Ct Wheeling, IL | 1.0–2.0 | 1.0–2.0 | 954 | $2,005 | $2.10 | 1d | 11 | 0.13mi |
| 500 W Dundee Rd Wheeling, IL | 2.0 | 1.0–2.0 | 1013 | $2,508 | $2.48 | 1d | 30 | 0.29mi |
| 24 Wheeling Rd Unit 111 Wheeling, IL | 2.0 | 1.0 | 910 | $1,900 | $2.09 | 1d | 1 | 0.46mi |
| 250 McHenry Rd Wheeling, IL | 1.0–3.0 | 1.0–2.0 | 1185 | $2,156 | $1.82 | 1d | 33 | 0.48mi |
| 375 W Dundee Rd Wheeling, IL | 3.0 | 1.0–2.0 | 1060 | $2,438 | $2.30 | 1d | 20 | 0.50mi |
| 160 Arbor Ct Apt 158 Wheeling, IL | 2.0 | 1.0 | 910 | $1,700 | $1.87 | 1d | 1 | 0.77mi |
| 164 Arbor Ct Unit 171 Wheeling, IL | 2.0 | 1.0 | 842 | $1,700 | $2.02 | 1d | 1 | 0.77mi |
| 164 Arbor Ct Wheeling, IL | 2.0 | 1.0 | 842 | $1,700 | $2.02 | 10d | 1 | 0.77mi |
| 169 Arbor Ct Wheeling, IL | 2.0 | 1.0 | 842 | $1,700 | $2.02 | 7d | 1 | 0.78mi |
| 169 Arbor Ct Apt 153 Wheeling, IL | 2.0 | 1.0 | 842 | $1,700 | $2.02 | 1d | 1 | 0.78mi |
| 173 Arbor Ct Unit 148 Wheeling, IL | 2.0 | 1.0 | 842 | $1,800 | $2.14 | 16d | 1 | 0.79mi |
| 173 Arbor Ct Unit 146 Wheeling, IL | 2.0 | 1.0 | 842 | $1,700 | $2.02 | 16d | 1 | 0.79mi |
| 173 Arbor Ct Wheeling, IL | 2.0 | 1.0 | 842 | $1,750 | $2.08 | 1d | 2 | 0.81mi |
| 177 Arbor Ct Wheeling, IL | 2.0 | 1.0 | 840 | $1,700 | $2.02 | 1d | 1 | 0.82mi |
| 185 Arbor Ct Wheeling, IL | 2.0 | 1.0 | 842 | $1,650 | $1.96 | 16d | 3 | 0.83mi |
| 185 Arbor Ct Apt 128 Wheeling, IL | 2.0 | 1.0 | 842 | $1,600 | $1.90 | 1d | 1 | 0.83mi |
| 185 Arbor Ct Apt 130 Wheeling, IL | 2.0 | 1.0 | 842 | $1,700 | $2.02 | 1d | 1 | 0.83mi |
| 733 Plum Tree Ct Unit C2 Wheeling, IL | 2.0 | 1.0 | 1100 | $2,150 | $1.95 | 1d | 1 | 0.98mi |
| 1106 Wildberry Ct Unit B1 Wheeling, IL | 2.0 | 2.0 | 1100 | $2,500 | $2.27 | 10d | 1 | 1.05mi |
| 1106 Wildberry Ct Unit B1 Wheeling, IL | 2.0 | 2.0 | 1100 | $2,350 | $2.14 | 2d | 1 | 1.05mi |
| 1411 Johnson Dr Unit 1326 Buffalo Grove, IL | 1.0 | 1.0 | 715 | $1,660 | $2.32 | 21d | 1 | 1.07mi |
| 1701 Johnson Dr Buffalo Grove, IL | 1.0–2.0 | 1.0–2.0 | 795 | $1,750 | $2.20 | 2d | 38 | 1.08mi |
| 536 Inverrary Ln Deerfield, IL | 2.0 | 1.5 | 1000 | $2,450 | $2.45 | 24d | 1 | 1.10mi |
| 544 Inverrary Ln Deerfield, IL | 2.0 | 1.5 | 922 | $2,650 | $2.87 | 24d | 1 | 1.11mi |
| 746 Inverrary Ln Deerfield, IL | 2.0 | 1.5 | 992 | $2,500 | $2.52 | 24d | 1 | 1.11mi |
| 360 W Inverrary Ln Deerfield, IL | 2.0 | 2.5 | 1090 | $2,600 | $2.39 | 24d | 1 | 1.15mi |
| 450 Manda Ln Wheeling, IL | 1.0–2.0 | 1.0–2.0 | 806 | $1,640 | $2.03 | 1d | 38 | 1.15mi |
| 146 W Inverrary Ln Unit 146 Deerfield, IL | 2.0 | 1.0 | 992 | $2,349 | $2.37 | 7d | 1 | 1.15mi |
| 146 W Inverrary Ln Unit 146 Deerfield, IL | 2.0 | 1.0 | 992 | $2,400 | $2.42 | 24d | 1 | 1.15mi |
| 1128 Johnson Dr Unit 3521 Buffalo Grove, IL | 2.0 | 2.0 | 975 | $2,150 | $2.21 | 21d | 1 | 1.16mi |
| 1216 Inverrary Ln #1216 Deerfield, IL | 2.0 | 1.0 | 1100 | $2,075 | $1.89 | 24d | 1 | 1.23mi |
| 470 Foxboro Dr Wheeling, IL | 1.0–2.0 | 1.0–1.5 | 791 | $1,536 | $1.94 | 1d | 21 | 1.29mi |
| 1533 Baldwin Ct Wheeling, IL | 1.0–2.0 | 1.0–1.5 | 850 | $1,755 | $2.06 | 1d | 16 | 1.49mi |
HOA detail condo
- Monthly dues
- $336 · $4,032/yr
- Assessments
- None detected in remarks — confirm with the listing agent.
Listing history 12 events
-
2026-05-31status $165,000 Pending 29 DOM
-
2026-05-06historical Contingent - Continue to Show
-
2026-05-01$165,000 Active
-
2026-03-05historical Contingent - No Showings
-
2026-03-04historical
-
2026-02-27Active
-
2026-02-25historical
-
2018-08-24soldstatus $85,000
-
2018-08-20soldstatus $85,000 Closed Sale
-
2018-08-02historical Contingent
-
2018-07-21$89,500 New
-
1995-11-28soldstatus $105,000
ⓘ Source: listings_history table (triggers on properties + properties_extension) + one-shot
backfill from property_details.listing_events for pre-trigger history.
Tax reassessment forecast IL · Partial reset (capped growth)
- Current annual tax
- $1,197 · $100/mo
- Projected year-2 tax
- $2,471 · $206/mo
- Expected delta
- +$1,274/yr (+$106/mo · 106.4%)
ⓘ Screening estimate from a state-policy table — verify with the county assessor before closing.
Climate risk First Street
- Flood 1/10 Low FEMA zone X (shaded) · 0% chance over 30 yrs
- Wildfire 1/10 Low
- Heat 3/10 Moderate 7 d/yr ≥99°F today · 14 d/yr by 30 yrs out
- Wind 2/10 Low
- Air quality 4/10 Moderate 4 unhealthy d/yr today · 4 by 30 yrs out
Nearby sold comps map
Loading sold comps map…
Walkable amenities ~0.75 mi
Loading nearby amenities…
Taxation est. · year 1
- Rental income
- $23,021
- − Mortgage interest
- −$9,243
- − Property taxes
- −$1,197
- − Insurance
- −$825
- − Repairs & maintenance
- −$1,842
- − Management
- −$1,842
- − HOA
- −$4,032
- − Depreciation
- −$4,800
- Taxable loss
- −$759
- Est. tax savings @ 24.0%
- +$182
- After-tax cash flow
- $1,931/yr
For passive investors: Depreciation is non-cash, so a rental often shows a tax loss while cash-flowing — sheltering income. Rental losses are passive: they offset passive income freely, and up to $25,000/yr can offset ordinary (W-2) income if you actively participate and your MAGI is under $100k (phasing out to $0 by $150k); unused losses carry forward. On sale, claimed depreciation is recaptured at up to 25%, and gains may owe capital-gains tax (a 1031 exchange can defer both). Figures are a year-1 estimate at your 24.0% rate — not tax advice; consult a CPA.
Schools (NCES district)
- District
- Township Hsd 214
- NCES district ID
- 1704170
- Math proficiency
- 42% ▼ -10.00%
- Reading proficiency
- 45% ▼ -4.00%
- Median HH income
- $68,267
- Composite
- 39.13/100
- National rank
- #4035
- State rank
- #103 of 620 in IL
Livability — Wheeling
- Score
- 71/100
- State rank
- #335
- US rank
- #6685
Category grades
Schools grade is shown separately in the Schools card above.
Census & demographics
- Census place
- Wheeling, IL
- County
- Cook County · 4,486,803 people
- City population
- 38,298
- Metro
- Chicago-Naperville-Elgin, IL-IN-WI
- Population (ZIP)
- 38,298
- Household income
- $85,355
- Rent vs Own
- Severe rent burden
- 1325.0
Population outlook (Cook County) Hauer SSP2
- Today (2025)
- 5,347,519 people
- By 2030
- 5,357,703 · +0.2%
- By 2040
- 5,324,924 · -0.4%
- By 2050
- 5,230,762 · -2.2%
- By 2075
- 4,785,735 · -10.5%
- By 2100
- 4,188,836 · -21.7%
Race, ethnicity, and origin ACS 2023
- Neighborhood character
- Diverse neighborhood (Simpson 0.65)
- Race & ethnicity
- White 47% Hispanic / Latino 32% Asian 16% Two or more races 9% Black 2% Native American 2%
- Hispanic origin (detail)
- Mexican 27%
- Common ancestry
- Romanian 6% Scotch-Irish 5% Subsaharan African 5%
- Foreign-born
- 45% · Canada, South Korea, China
- Languages at home
- 37% English-only · Spanish 29% Russian/Polish/Slavic 17% Other Indo-European 5%
Political lean MEDSL · Cook
- 2024 margin
- Solid D (+42.0) · D 70.4% · R 28.4% · Other 1.2%
- 2008→2024 swing
- -11.4pp toward R · 2008: 53.4pp · 2024: 42.0pp
- All cycles
- 2024: D+42.0 2020: D+50.3 2016: D+53.0 2012: D+49.4 2008: D+53.4
Not yet ingested
- Civics
- —
Market trends
- HPI YoY
- ▼ -238.28%
- Current HPI
- 209.9251
- Rent YoY
- ▲ 1.75%
- Metro
- Chicago-Naperville-Elgin, IL-IN-WI
- State GDP YoY
- ▲ 1.59%
- F500 in state
- 60
Industry mix (Fortune 500 HQ in IL)
| Industry | F500 HQs | Revenue |
|---|---|---|
| Insurance | 4 | $201B |
|
||
| Consumer Goods | 4 | $87B |
|
||
| Industrial Machinery | 3 | $64B |
|
||
| Healthcare | 2 | $55B |
|
||
| Retail / Pharmacy | 1 | $148B |
|
||
| Agriculture / Food | 1 | $86B |
|
||
Price history
+57.1% since first listed11 events — show timeline
- 2026-05-06 Contingent — MRED as Distributed by MLS Grid
- 2026-05-01 Listed $165,000 MRED as Distributed by MLS Grid
- 2026-03-05 Contingent — MRED as Distributed by MLS Grid
- 2026-03-04 Listing Removed — MRED as Distributed by MLS Grid
- 2026-02-27 Listed — MRED as Distributed by MLS Grid
- 2026-02-25 Listing Removed — MRED as Distributed by MLS Grid
- 2018-08-24 Sold (Public Records) $85,000 Public Records
- 2018-08-20 Sold (MLS) $85,000 MRED as Distributed by MLS Grid
- 2018-08-02 Contingent — MRED as Distributed by MLS Grid
- 2018-07-21 Listed $89,500 MRED as Distributed by MLS Grid
- 1995-11-28 Sold (Public Records) $105,000 Public Records
Property tax history
-3.7%/yrLatest (2023): $1,197 · +10.7% YoY. Source: county tax records.
Cash-flow waterfall
monthlySold comps — $/sqft
last 12 mo · ≤1 miLoading sold comps…