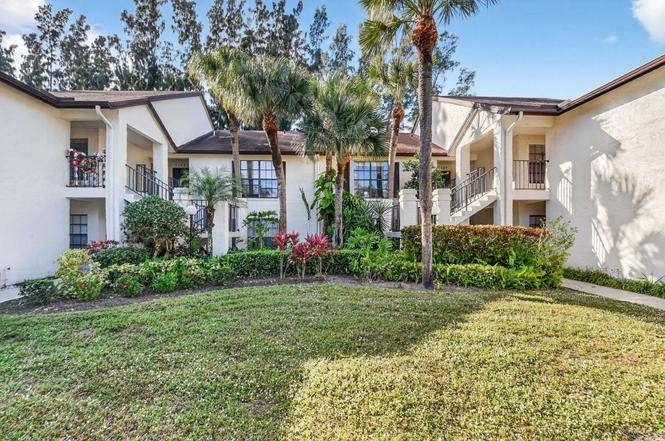
3227 Perimeter Dr · Greenacres, FL
Flood risk 1/10 · Minimal
- FEMA flood zone
- X (unshaded)
- Chance of flooding over 30 yrs
- 0.0%
- Est. flood insurance / yr
- $507 – $1,088
Fire risk 1/10 · Minimal
- Est. fire insurance / yr
- $947 – $1,759
Heat risk 9/10 · Severe
- Hot days now (above 106°F)
- 7 days/yr
- Hot days in 30 yrs
- 24 days/yr
Wind risk 10/10 · Severe
- Chance of severe wind over 30 yrs
- 99.0%
Air-quality risk 2/10 · Minimal
- Unhealthy air days now
- 0 days/yr
- Unhealthy air days in 30 yrs
- 2 days/yr
Risk factors via First Street. Map © Google.
Why this score? — see what drove the D grade
The composite is a weighted blend of 9 inputs, each scored 0–100. Each bar is that input's sub-score; the figure is the points it added to the 100-point composite (weight × sub-score).
- Cash flow +11.5/30.0
- 1% rule +7.5/10.0
- ARV discount +7.5/15.0
- Schools +4.3/10.0
- Livability +3.5/5.0
- DSCR +3.4/10.0
- Condition / age +2.5/5.0
- Rent growth +2.4/5.0
- Appreciation +0.0/10.0
$175,000
🖨 Deal sheet (PDF) 📄 Offer letter ✓ Due diligence
Listing remarks
Located within the desirable 55+ community of Park Pointe in Greenacres, this second-floor Aruba model condo offers generous living space and an excellent opportunity to customize and add value. The open and airy layout is enhanced by vaulted ceilings, creating a bright and welcoming atmosphere throughout the home. The residence features two bedrooms and two full bathrooms, ideal for comfortable everyday living or hosting visiting guests. Recent mechanical updates provide peace of mind, including a new AC system and hot water heater installed in 2021. Additional 2021 improvements include a new garbage disposal, kitchen faucet, and shut-off valve under the kitchen sink, along with a new refr
Key facts
- Pickleball courts
- Tennis courts
- Hurricane protection
Tags
Property features AI
Finance
- Financial info: Pets allowed with limits
- HOA & community: Community has an association; Monthly HOA fee; Association amenities include clubhouse, fitness center, pool, sauna, billiard room, shuffleboard, tennis and pickleball courts, parking, and internet included; HOA payments cover cable TV, grounds maintenance, sewer, trash and water; Senior community
Exterior
- Parking: Assigned parking; Guest parking; 1 open parking space
- Utilities: Public water; Public sewer; Sewer and water available
- Home design: Condominium; Multi/split levels; 2 total stories; East-facing
- Construction: Built with CBS (concrete block) construction; Composition/shingle roof
- Exterior features: No waterfront; Entry-level living area
Interior
- Kitchen: Dishwasher; Electric range; Microwave; Refrigerator; Electric water heater
- Bedrooms: 2 bedrooms on the main level
- Flooring: Carpet; Blinds and sliding window coverings
- Bathrooms: 2 full bathrooms
- Heating & cooling: Central electric heating; Central air conditioning; Ceiling fans
- Interior features: Built-in features; Cathedral and vaulted ceilings; Entrance foyer; Walk-in closets; Split bedroom layout
- Laundry & utility: Inside laundry in a laundry closet
Neighborhood map
What this means for you Summary
Snapshot
- This is a 2-bed/2.0-bath condo listed at $175k.
Deal economics
- At list price, monthly cash flow is $-59 ($-703/yr) — negative.
- To cash-flow at today's rent, offer at most $165k (5.9% below list).
- Meets the 1% rule at list price ($2k rent vs $175k).
- Recommended offer: $154k (12.0% below list) — sets the bar for market timing.
Location & tenants
- Location reads 69/100 on livability (#490 in FL) — a middle-class / working-renter tenant base. Strengths: cost of living A+, housing A+, health & safety A; Watch: employment D, amenities F, commute F.
- Palm Beach (suburban): math 46% / reading 53% proficiency, ranked #34 of 73 in FL (top 47%) — families likely to look elsewhere, expect single-tenant / working-renter base with shorter leases.
- Zoned schools: Liberty Park Elementary School (math 25% / reading 38%, grade F, #1,841 of 2,144 statewide, top 86%, 845 students, 76% FRL); Okeeheelee Middle School (math 34% / reading 40%, grade F, #399 of 571 statewide, top 71%, 1,377 students, 68% FRL); John I. Leonard High School (math 17% / reading 35%, grade F, #494 of 667 statewide, top 75%, 3,549 students, 67% FRL) — zoned schools average 70% FRL vs 52% district-wide (18 pts higher); higher-poverty schools than district average — tighter screening recommended.
- Zoned-school proficiency averages 32% at this address vs 50% district-wide (-18 pts) — the specific schools serving this property underperform the Palm Beach average; the district grade overstates school quality for this exact location.
- Market conditions: Rents soft (-0.4%/yr); 666 active listings in the ZIP; 40 comparable units currently listed for rent nearby; rentals at typical pace (median 22d on market — plan ~3-4 weeks tenant-placement turnaround); solid renter incomes; 3,974 units permitted in Palm Beach County in 2024 (1,012 in 5+ unit buildings).
Forward outlook
- Local home prices are declining (-3.0%/yr); year-one equity from $1k of loan paydown is wiped out by about $5k of value loss. Plan a longer hold.
- Palm Beach County population projected at +30% by 2050 — long-run rental-demand tailwind backs the buy-and-hold thesis.
Negotiation context
- It's been on market 185 days — a 12% lower offer ($154k) is reasonable based on typical stale-listing flexibility.
- 3 sale attempts since 23y ago with the ask held roughly flat each time — persistent listings suggest the price (not the market) is what's stuck; bring a comps-based counter.
- Current owner paid $118k; 48% above their basis — modest negotiation headroom, anchor on the comps not their cost.
Risks & watch-outs
- Watch-outs: HOA is 34% of rent.
- Climate carrying-cost: severe wind risk, 99% chance of damaging wind over 30y; extreme-heat days projected 7→24/yr by 2055 (HVAC capex compounding) — expect insurance premiums to compound above CPI over the hold.
Questions for the listing agent
- What do current leases actually rent for vs. the listed asking? Can we see a recent rent roll and the last 12 months of T-12 income?
- It's been on market 185 days. Have you received any prior offers? Is the seller open to a 12% concession, seller financing, or rate buy-down credit?
- What does the HOA fee cover, when was the last increase, and are there any pending special assessments or reserve-fund shortfalls?
- Any open or pending special assessments — roof, HVAC, plumbing, elevator, façade? What's the per-unit balance and payoff schedule, and is the seller paying it off at close or rolling it to the buyer?
- Why hasn't it sold? Are there any deal-killer items the seller is aware of (foundation, flood, title, zoning, code violations)?
- Is there a deadline driving the sale (1031 exchange, divorce, estate, relocation)? That informs how much negotiation room exists.
- Schools are D-rated, which usually means shorter tenancies and higher turnover. Who's the typical renter profile here, and what's been the actual vacancy rate?
- The area grade is low — what's the realistic commute time and amenity access for the typical tenant pool here? Any planned neighborhood developments (good or bad) we should know about?
- What's the average days-on-market for RENTAL listings here right now (not sales)? A rising rental-DOM trend means longer vacancies and softer asking-rent achievability than the comps imply.
- What's the recent tenant-quality profile in this submarket — average credit score on applications, eviction rate, late-payment / NSF rate, and stable-employment percentage? A property-management company in the area should have these aggregated.
- How much new apartment / multifamily construction is in the pipeline within 1–3 miles? Heavy new supply (>2% of stock underway) typically softens rents 12–24 months out; light construction supports rent growth.
Investment metrics
- 1% rule
- 1.25% ✓
- Cap rate
- 5.89%
- Cash-on-cash
- -1.44%
- DSCR
- 0.94
- GRM
- 6.6
CMA / ARV
No comps found within radius.
Projected returns pro-forma
-3.0% appreciation · 0.0% rent growth · sell at horizon
- IRR
- -23.6%
- Equity multiple
- 0.22×
- Total profit
- $-38,131
- Equity at exit
- $26,093
- IRR
- -40.2%
- Equity multiple
- -0.25×
- Total profit
- $-61,276
- Equity at exit
- $15,131
Cash invested: $49,000 (down + closing). Projections, not guarantees.
Landlord ↔ Tenant lean methodology
- Overall (STATE)
- 87 Strongly Landlord-Friendly
- State Florida
- 87 Strongly Landlord-Friendly · R+3
- County
- — inherits STATE
- City
- — inherits STATE
ZIP-level market 33467
- Rents YoY
- -0.4%
- Active inventory
- 666
- Price-to-rent
- 6.6×
Monthly cashflow live
- Estimated rent
- $2,195 high interval (Pro) →
- Mortgage (P&I)
- −$918
- Tax from tax record
- −$62 /mo · $741/yr
- Insurance
- −$73
- HOA
- −$740
- Vacancy / Maint / Mgmt
- −$461
- Net cashflow
- $-59
Break-even live
Sensitivity live
| Price | -10% $40 | -5% $-9 | +0% $-59 | +5% $-108 | +10% $-158 |
|---|---|---|---|---|---|
| Rent | -10% $-232 | -5% $-145 | +0% $-59 | +5% $28 | +10% $115 |
| Rate | -1.0pp $30 | -0.5pp $-14 | base $-59 | +0.5pp $-104 | +1.0pp $-150 |
UW: 25.0% down · 7.5% · 30yr · 1.5% tax · 5.0% vac · 8.0% maint · 8.0% mgmt
Financing live
Cash to close
- Down payment
- $43,750
- Closing costs
- $5,250
- Reserves months
- —
- Total cash needed
- —
Loan-product check · same deal, 3 products live
Conventional
25% down · 7.5% · 30yr
- Down + closing
- —
- Monthly P&I
- —
- Monthly cashflow
- —
- DSCR
- —
- Eligible?
- —
Personal DTI + credit; lowest rate.
DSCR
20% down · 8.5% · 30yr
- Down + closing
- —
- Monthly P&I
- —
- Monthly cashflow
- —
- DSCR
- —
- Eligible?
- —
No personal income docs; deal must DSCR.
Hard money
10% down · 12.0% · 12mo
- Down + closing
- —
- Monthly P&I
- —
- Monthly cashflow
- —
- DSCR
- —
- Eligible?
- —
Short-term bridge; refi at stabilization.
Rent comps 40 comps
| Address | Beds | Baths | Sqft | Rent | $/sqft | DOM | Units | Dist |
|---|---|---|---|---|---|---|---|---|
| 3386 Lucerne Park Dr Greenacres, FL | 2.0 | 2.0 | 1059 | $1,950 | $1.84 | 26d | 1 | 0.03mi |
| 3350 Perimeter Dr #1323 Greenacres, FL | 2.0 | 2.0 | 1059 | $1,975 | $1.86 | 3d | 1 | 0.03mi |
| 3043 Grandiflora Dr Lake Worth, FL | 3.0 | 2.0 | 1316 | $2,700 | $2.05 | 13d | 1 | 0.11mi |
| 3258 Jog Park Dr Greenacres, FL | 2.0 | 2.0 | 1415 | $2,300 | $1.63 | 26d | 1 | 0.17mi |
| 720 Sunny Pine Way Unit G1 Greenacres, FL | 2.0 | 2.0 | 1111 | $2,000 | $1.80 | 21d | 1 | 0.27mi |
| 718 Sunny Pine Way Unit H2 Greenacres, FL | 2.0 | 2.0 | 1111 | $2,000 | $1.80 | 7d | 1 | 0.29mi |
| 718 Sunny Pine Way Unit H2 Greenacres, FL | 2.0 | 2.0 | 1111 | $2,000 | $1.80 | 22d | 1 | 0.29mi |
| 3154 Via Poinciana #214 Lake Worth, FL | 2.0 | 2.0 | 1092 | $1,500 | $1.37 | 26d | 1 | 0.31mi |
| 1600 Island Shores Dr Greenacres, FL | 1.0–2.0 | 1.0–2.0 | 889 | $1,925 | $2.17 | 26d | 2 | 0.33mi |
| 3146 Via Poinciana #301 Lake Worth, FL | 2.0 | 2.0 | 1080 | $1,500 | $1.39 | 22d | 1 | 0.36mi |
| 712 Sunny Pine Way Greenacres, FL | 2.0 | 2.0 | 1068 | $2,150 | $2.01 | 26d | 1 | 0.37mi |
| 724 Sunny Pine Way Unit D2 Greenacres, FL | 2.0 | 2.0 | 1111 | $1,950 | $1.76 | 26d | 1 | 0.42mi |
| 3178 Via Poinciana #303 Lake Worth, FL | 2.0 | 2.0 | 1145 | $1,600 | $1.40 | 26d | 1 | 0.44mi |
| 726 Sunny Pine Way Unit B2 Greenacres, FL | 3.0 | 2.0 | 1254 | $2,200 | $1.75 | 5d | 1 | 0.44mi |
| 703 Sunny Pine Way Greenacres, FL | 2.0 | 2.0 | 1068 | $1,900 | $1.78 | 26d | 2 | 0.45mi |
| 6115 Seven Springs Blvd Greenacres, FL | 2.0 | 2.5 | 1325 | $2,500 | $1.89 | 20d | 1 | 0.46mi |
| 6115 Seven Springs Blvd Greenacres, FL | 2.0 | 2.5 | 1325 | $2,475 | $1.87 | 7d | 1 | 0.46mi |
| 812 Sky Pine Way Greenacres, FL | 2.0 | 2.0 | 1064 | $2,100 | $1.97 | 26d | 1 | 0.46mi |
| 6134 Seven Springs Blvd Unit 40d Greenacres, FL | 3.0 | 3.0 | 1321 | $2,400 | $1.82 | 5d | 1 | 0.47mi |
| 811 Sky Pine Way Unit F2 Greenacres, FL | 2.0 | 2.0 | 1064 | $1,550 | $1.46 | 22d | 1 | 0.48mi |
| 6273 Tall Cypress Cir Greenacres, FL | 3.0 | 2.0 | 1360 | $2,400 | $1.76 | 26d | 1 | 0.51mi |
| 504 Shady Pine Way Unit 2 Greenacres, FL | 2.0 | 2.0 | 1111 | $2,000 | $1.80 | 26d | 1 | 0.51mi |
| 703 Sunny Pine Way Unit G2 Greenacres, FL | 2.0 | 2.0 | 1068 | $2,000 | $1.87 | 17d | 1 | 0.51mi |
| 802 Sky Pine Way Unit E2 Greenacres, FL | 2.0 | 2.0 | 1111 | $1,750 | $1.58 | 9d | 1 | 0.51mi |
| 3212 Strawflower Way Greenacres, FL | 2.0 | 2.0 | 1017 | $2,200 | $2.16 | 12d | 1 | 0.52mi |
| 3212 Strawflower Way #207 Lake Worth, FL | 2.0 | 2.0 | 1017 | $1,850 | $1.82 | 26d | 1 | 0.52mi |
| 3212 Strawflower Way Lake Worth, FL | 2.0 | 2.0 | 1017 | $2,000 | $1.97 | 19d | 2 | 0.52mi |
| 502 Shady Pine Way Unit D2 Greenacres, FL | 2.0 | 1.0 | 991 | $1,900 | $1.92 | 1d | 1 | 0.52mi |
| 817 Sky Pine Way Unit H Greenacres, FL | 2.0 | 2.0 | 1370 | $2,300 | $1.68 | 18d | 1 | 0.54mi |
| 6023 10th Ave N #114 Greenacres, FL | 2.0 | 2.0 | 1050 | $2,000 | $1.90 | 0d | 1 | 0.54mi |
| 826 Sky Pine Way Greenacres, FL | 2.0–3.0 | 2.0 | 1304 | $1,800 | $1.38 | 0d | 2 | 0.55mi |
| 6061 10th Ave N #242 Greenacres, FL | 2.0 | 2.0 | 855 | $2,000 | $2.34 | 6d | 1 | 0.57mi |
| 813 Sky Pine Way Unit F2 Greenacres, FL | 2.0 | 2.0 | 1111 | $1,725 | $1.55 | 4d | 1 | 0.58mi |
| 813 Sky Pine Way Unit F2 Greenacres, FL | 2.0 | 2.0 | 1111 | $1,725 | $1.55 | 16d | 1 | 0.58mi |
| 6031 10th Ave N #219 Greenacres, FL | 3.0 | 2.0 | 1078 | $2,400 | $2.23 | 5d | 1 | 0.58mi |
| 6049 Olivewood Cir Greenacres, FL | 2.0 | 2.0 | 1377 | $2,200 | $1.60 | 26d | 1 | 0.58mi |
| 508 Shady Pine Way Unit D1 Greenacres, FL | 2.0 | 2.0 | 1115 | $1,850 | $1.66 | 23d | 1 | 0.60mi |
| 3590 Via Poinciana #510 Lake Worth, FL | 1.0 | 1.5 | 849 | $1,600 | $1.88 | 26d | 1 | 0.60mi |
| 3286 Arcara Way #413 Lake Worth, FL | 2.0 | 2.0 | 1222 | $1,800 | $1.47 | 1d | 1 | 0.60mi |
| 6043 10th Ave N #130 Greenacres, FL | 3.0 | 2.0 | 1500 | $2,300 | $1.53 | 26d | 1 | 0.61mi |
HOA detail condo
- Monthly dues
- $740 · $8,880/yr
- Likely covers
- watertrash
- Assessments
- None detected in remarks — confirm with the listing agent.
Listing history 19 events
-
2026-06-21days on market $175,000 Active 185 DOM
-
2026-06-18days on market $175,000 Active 182 DOM
-
2026-06-17days on market $175,000 Active 181 DOM
-
2026-06-16days on market $175,000 Active 180 DOM
-
2026-06-15days on market $175,000 Active 179 DOM
-
2026-06-13days on market $175,000 Active 177 DOM
-
2026-06-09days on market $175,000 Active 173 DOM
-
2026-06-07days on market $175,000 Active 171 DOM
-
2026-06-04days on market $175,000 Active 168 DOM
-
2026-06-03days on market $175,000 Active 167 DOM
-
2026-06-01days on market $175,000 Active 165 DOM
-
2026-05-31days on market $175,000 Active 164 DOM
-
2025-12-18$175,000 Active
-
2006-06-02historical
-
2005-09-30$199,900
-
2003-10-30soldstatus $118,000
-
2003-09-27historical
-
2003-07-18$121,900
-
1987-09-01soldstatus $75,000
ⓘ Source: listings_history table (triggers on properties + properties_extension) + one-shot
backfill from property_details.listing_events for pre-trigger history.
Tax reassessment forecast FL · Resets to sale price
- Current annual tax
- $741 · $62/mo
- Projected year-2 tax
- $1,452 · $121/mo
- Expected delta
- +$712/yr (+$59/mo · 96.1%)
ⓘ Screening estimate from a state-policy table — verify with the county assessor before closing.
Climate risk First Street
- Flood 1/10 Low FEMA zone X (unshaded) · 0% chance over 30 yrs
- Wildfire 1/10 Low
- Heat 9/10 Extreme 7 d/yr ≥106°F today · 24 d/yr by 30 yrs out
- Wind 10/10 Extreme 99% chance of damaging wind over 30 yrs
- Air quality 2/10 Low 0 unhealthy d/yr today · 2 by 30 yrs out
Nearby sold comps map
Loading sold comps map…
Walkable amenities ~0.75 mi
Loading nearby amenities…
Taxation est. · year 1
- Rental income
- $26,336
- − Mortgage interest
- −$9,803
- − Property taxes
- −$741
- − Insurance
- −$875
- − Repairs & maintenance
- −$2,107
- − Management
- −$2,107
- − HOA
- −$8,880
- − Depreciation
- −$5,091
- Taxable loss
- −$3,268
- Est. tax savings @ 24.0%
- +$784
- After-tax cash flow
- $81/yr
For passive investors: Depreciation is non-cash, so a rental often shows a tax loss while cash-flowing — sheltering income. Rental losses are passive: they offset passive income freely, and up to $25,000/yr can offset ordinary (W-2) income if you actively participate and your MAGI is under $100k (phasing out to $0 by $150k); unused losses carry forward. On sale, claimed depreciation is recaptured at up to 25%, and gains may owe capital-gains tax (a 1031 exchange can defer both). Figures are a year-1 estimate at your 24.0% rate — not tax advice; consult a CPA.
Schools (NCES district)
- District
- Palm Beach
- NCES district ID
- 1201500
- Math proficiency
- 46% ▼ -16.00%
- Reading proficiency
- 53% ▼ -4.00%
- Median HH income
- $53,943
- Composite
- 42.72/100
- National rank
- #3160
- State rank
- #34 of 73 in FL
Livability — Greenacres
- Score
- 69/100
- State rank
- #490
- US rank
- #9008
Category grades
Schools grade is shown separately in the Schools card above.
Census & demographics
- Census place
- Greenacres, FL
- County
- Palm Beach County · 1,438,312 people
- City population
- 65,478
- Metro
- Miami-Fort Lauderdale-Pompano Beach, FL
- Population (ZIP)
- 58,411
- Household income
- $95,739
- Rent vs Own
- Severe rent burden
- 960.0
Population outlook (Palm Beach County) Hauer SSP2
- Today (2025)
- 1,637,487 people
- By 2030
- 1,743,255 · +6.5%
- By 2040
- 1,948,712 · +19.0%
- By 2050
- 2,132,979 · +30.3%
- By 2075
- 2,530,027 · +54.5%
- By 2100
- 2,706,979 · +65.3%
Race, ethnicity, and origin ACS 2023
- Neighborhood character
- Diverse neighborhood (Simpson 0.59)
- Race & ethnicity
- White 59% Hispanic / Latino 22% Two or more races 13% Black 10% Asian 4%
- Hispanic origin (detail)
- Mexican 2% Puerto Rican 4% Cuban 4% Dominican 2%
- Common ancestry
- Romanian 4% Scotch-Irish 3% Hispanic 3%
- Foreign-born
- 24% · Canada, Jamaica, Vietnam
- Languages at home
- 71% English-only · Spanish 17% French/Haitian/Cajun 5% Other Indo-European 3%
Political lean MEDSL · Palm Beach
- 2024 margin
- Toss-up / Even · D 50.0% · R 49.2%
- 2008→2024 swing
- -22.1pp toward R · 2008: 22.9pp · 2024: 0.8pp
- All cycles
- 2024: D+0.8 2020: D+12.8 2016: D+15.3 2012: D+17.0 2008: D+22.9
Not yet ingested
- Civics
- —
Market trends
- HPI YoY
- ▼ -288.94%
- Current HPI
- 343.7738
- Rent YoY
- ▼ -0.40%
- Metro
- Miami-Fort Lauderdale-Pompano Beach, FL
- State GDP YoY
- ▲ 3.28%
- F500 in state
- 36
Industry mix (Fortune 500 HQ in FL)
| Industry | F500 HQs | Revenue |
|---|---|---|
| Industrial Technology | 2 | $29B |
|
||
| Insurance | 2 | $17B |
|
||
| Retail | 1 | $60B |
|
||
| Technology Distribution | 1 | $58B |
|
||
| Homebuilding | 1 | $35B |
|
||
| Technology Manufacturing | 1 | $35B |
|
||
Price history
+133.3% since first listed7 events — show timeline
- 2025-12-18 Listed $175,000 Beaches MLS
- 2006-06-02 Listing Removed — Beaches MLS
- 2005-09-30 Listed $199,900 Beaches MLS
- 2003-10-30 Sold (Public Records) $118,000 Public Records
- 2003-09-27 Listing Removed — Beaches MLS
- 2003-07-18 Listed $121,900 Beaches MLS
- 1987-09-01 Sold (Public Records) $75,000 Public Records
Property tax history
+0.2%/yrLatest (2025): $741 · +3.6% YoY. Source: county tax records.
Cash-flow waterfall
monthlySold comps — $/sqft
last 12 mo · ≤1 miLoading sold comps…