11186 US 23 · Benton, MI
Flood risk 1/10 · Minimal
- FEMA flood zone
- X (unshaded)
- Chance of flooding over 30 yrs
- 0.0%
- Est. flood insurance / yr
- $473 – $860
Fire risk 2/10 · Minimal
- Est. fire insurance / yr
- $784 – $1,456
Heat risk 1/10 · Minimal
- Hot days now (above 90°F)
- 7 days/yr
- Hot days in 30 yrs
- 14 days/yr
Wind risk 1/10 · Minimal
- Chance of severe wind over 30 yrs
- —
Air-quality risk 1/10 · Minimal
- Unhealthy air days now
- 0 days/yr
- Unhealthy air days in 30 yrs
- 0 days/yr
Risk factors via First Street. Map © Google.
Why this score? — see what drove the C- grade
The composite is a weighted blend of 9 inputs, each scored 0–100. Each bar is that input's sub-score; the figure is the points it added to the 100-point composite (weight × sub-score).
- Cash flow +23.2/30.0
- ARV discount +7.5/15.0
- DSCR +7.4/10.0
- 1% rule +5.2/10.0
- Schools +2.9/10.0
- Rent growth +2.5/5.0
- Livability +2.5/5.0
- Condition / age +2.5/5.0
- Appreciation +0.0/10.0
$75,000
🖨 Deal sheet (PDF) 📄 Offer letter ✓ Due diligence
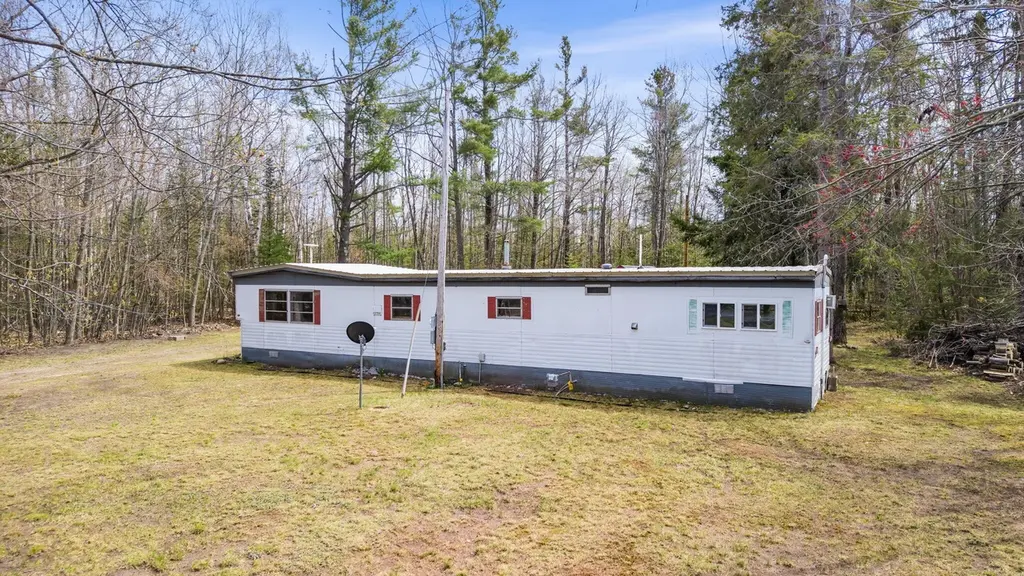
Listing remarks
Great income-producing opportunity! This 3-bedroom, 1-bath home offers some modern updates and plenty of potential. Property includes washer and dryer, plus a versatile outbuilding perfect for a workshop, storage, or additional bunk space for guests. Nestled on a spacious, secluded wooded lot with abundant wildlife, this property offers the perfect Up North setting. Conveniently located near public access to beautiful Lake Huron, making it ideal for year-round living, vacation use, or rental income potential. Don't miss this unique opportunity!
Key facts
- Modern updates
- Spacious wooded lot
- 1.24 acre lot
Tags
Property features AI
Exterior
- Utilities: Well water; Septic tank
- Home design: Single family residence; Residential property
- Construction: Pillar/post/pier foundation
- Exterior features: Paved road access; Lot dimensions approximately 360' x 150'; Approximately 1.24-acre lot
Interior
- Kitchen: Oven; Range; Refrigerator; Dishwasher
- Bathrooms: 1 full bathroom
- Heating & cooling: Forced air heating; Natural gas heating
- Interior features: Blinds on windows
- Laundry & utility: Washer; Dryer; Laundry on main level
Neighborhood map
What this means for you Summary
Snapshot
- This is a 2-bed/1.0-bath single-family listed at $75k.
Deal economics
- At list price, monthly cash flow is $135 ($2k/yr) — positive.
- The deal already cash-flows at list — no discount required.
- Meets the 1% rule at list price ($765 rent vs $75k).
- Recommended offer: $73k (3.0% below list) — sets the bar for market timing.
Location & tenants
- Location reads: area grade C — affects rentability + tenant quality, not the cash-flow math above.
- Cheboygan Area Schools (town): math 27% / reading 43% proficiency, ranked #307 of 540 in MI (top 57%) — families likely to look elsewhere, expect single-tenant / working-renter base with shorter leases.
- Market conditions: 161 active listings in the ZIP; 78 units permitted in Cheboygan County in 2024 (0 in 5+ unit buildings).
Forward outlook
- Local home prices are declining (-3.0%/yr); year-one equity from $519 of loan paydown is wiped out by about $2k of value loss. Plan a longer hold.
- Cheboygan County population projected at -30% by 2050 — secular population decline; favor cash flow + early exit over multi-decade hold.
Negotiation context
- It's been on market 33 days — a 3% lower offer ($73k) is reasonable based on typical stale-listing flexibility.
- Current owner paid $29k; list at $75k implies a 159% gain — meaningful room to come down on a strong offer.
Questions for the listing agent
- It's been on market 33 days. Have you received any prior offers? Is the seller open to a 3% concession, seller financing, or rate buy-down credit?
- Built in 1969 — when were the roof, HVAC, electrical panel, plumbing, and water heater last replaced?
- Is there a deadline driving the sale (1031 exchange, divorce, estate, relocation)? That informs how much negotiation room exists.
- What's the average days-on-market for RENTAL listings here right now (not sales)? A rising rental-DOM trend means longer vacancies and softer asking-rent achievability than the comps imply.
- What's the recent tenant-quality profile in this submarket — average credit score on applications, eviction rate, late-payment / NSF rate, and stable-employment percentage? A property-management company in the area should have these aggregated.
- How much new for-sale + rental construction is in the pipeline within 1–3 miles? Heavy new supply typically softens prices + rents 12–24 months out; constrained supply supports both.
Investment metrics
- 1% rule
- 1.02% ✓
- Cap rate
- 8.46%
- Cash-on-cash
- 7.74%
- DSCR
- 1.34
- GRM
- 8.2
CMA / ARV
No comps found within radius.
Projected returns pro-forma
-3.0% appreciation · 3.0% rent growth · sell at horizon
- IRR
- -4.5%
- Equity multiple
- 0.83×
- Total profit
- $-3,550
- Equity at exit
- $11,183
- IRR
- 5.1%
- Equity multiple
- 1.38×
- Total profit
- $7,936
- Equity at exit
- $6,485
Cash invested: $21,000 (down + closing). Projections, not guarantees.
Landlord ↔ Tenant lean methodology
- Overall (STATE)
- 62 Landlord-Friendly
- State Michigan
- 62 Landlord-Friendly · EVEN
- County
- — inherits STATE
- City
- — inherits STATE
ZIP-level market 49721
- Active inventory
- 161
- Price-to-rent
- 8.2×
Monthly cashflow live
- Estimated rent
- $765 medium interval (Pro) →
- Mortgage (P&I)
- −$393
- Tax from tax record
- −$45 /mo · $537/yr
- Insurance
- −$31
- HOA
- −$0
- Vacancy / Maint / Mgmt
- −$161
- Net cashflow
- $135
Break-even live
Sensitivity live
| Price | -10% $178 | -5% $157 | +0% $135 | +5% $114 | +10% $93 |
|---|---|---|---|---|---|
| Rent | -10% $75 | -5% $105 | +0% $135 | +5% $166 | +10% $196 |
| Rate | -1.0pp $173 | -0.5pp $154 | base $135 | +0.5pp $116 | +1.0pp $96 |
UW: 25.0% down · 7.5% · 30yr · 1.5% tax · 5.0% vac · 8.0% maint · 8.0% mgmt
Financing live
Cash to close
- Down payment
- $18,750
- Closing costs
- $2,250
- Reserves months
- —
- Total cash needed
- —
Loan-product check · same deal, 3 products live
Conventional
25% down · 7.5% · 30yr
- Down + closing
- —
- Monthly P&I
- —
- Monthly cashflow
- —
- DSCR
- —
- Eligible?
- —
Personal DTI + credit; lowest rate.
DSCR
20% down · 8.5% · 30yr
- Down + closing
- —
- Monthly P&I
- —
- Monthly cashflow
- —
- DSCR
- —
- Eligible?
- —
No personal income docs; deal must DSCR.
Hard money
10% down · 12.0% · 12mo
- Down + closing
- —
- Monthly P&I
- —
- Monthly cashflow
- —
- DSCR
- —
- Eligible?
- —
Short-term bridge; refi at stabilization.
Listing history 21 events
-
2026-06-21days on market $75,000 Active 33 DOM
-
2026-06-18days on market $75,000 Active 31 DOM
-
2026-06-17days on market $75,000 Active 30 DOM
-
2026-06-16days on market $75,000 Active 29 DOM
-
2026-06-15days on market $75,000 Active 28 DOM
-
2026-06-13days on market $75,000 Active 26 DOM
-
2026-06-12days on market $75,000 Active 25 DOM
-
2026-06-09days on market $75,000 Active 22 DOM
-
2026-06-08days on market $75,000 Active 21 DOM
-
2026-06-07days on market $75,000 Active 20 DOM
-
2026-06-07days on market $75,000 Active 19 DOM
-
2026-06-04days on market $75,000 Active 16 DOM
-
2026-06-02days on market $75,000 Active 15 DOM
-
2026-06-01days on market $75,000 Active 14 DOM
-
2026-05-31days on market $75,000 Active 13 DOM
-
2026-05-31days on market $75,000 Active 12 DOM
-
2026-05-15$75,000 Active
-
2008-06-13soldstatus $29,000
-
2005-03-24soldstatus $32,500
-
2004-05-05soldstatus $25,000
-
1997-11-14soldstatus $16,000
ⓘ Source: listings_history table (triggers on properties + properties_extension) + one-shot
backfill from property_details.listing_events for pre-trigger history.
Tax reassessment forecast MI · Partial reset (capped growth)
- Current annual tax
- $537 · $45/mo
- Projected year-2 tax
- $846 · $71/mo
- Expected delta
- +$309/yr (+$26/mo · 57.5%)
ⓘ Screening estimate from a state-policy table — verify with the county assessor before closing.
Climate risk First Street
- Flood 1/10 Low FEMA zone X (unshaded) · 0% chance over 30 yrs
- Wildfire 2/10 Low
- Heat 1/10 Low 7 d/yr ≥90°F today · 14 d/yr by 30 yrs out
- Wind 1/10 Low
- Air quality 1/10 Low 0 unhealthy d/yr today · 0 by 30 yrs out
Nearby sold comps map
Loading sold comps map…
Walkable amenities ~0.75 mi
Loading nearby amenities…
Taxation est. · year 1
- Rental income
- $9,185
- − Mortgage interest
- −$4,201
- − Property taxes
- −$537
- − Insurance
- −$375
- − Repairs & maintenance
- −$735
- − Management
- −$735
- − Depreciation
- −$2,182
- Taxable income
- $420
- Est. tax owed @ 24.0%
- −$101
- After-tax cash flow
- $1,524/yr
For passive investors: Depreciation is non-cash, so a rental often shows a tax loss while cash-flowing — sheltering income. Rental losses are passive: they offset passive income freely, and up to $25,000/yr can offset ordinary (W-2) income if you actively participate and your MAGI is under $100k (phasing out to $0 by $150k); unused losses carry forward. On sale, claimed depreciation is recaptured at up to 25%, and gains may owe capital-gains tax (a 1031 exchange can defer both). Figures are a year-1 estimate at your 24.0% rate — not tax advice; consult a CPA.
Schools (NCES district)
- District
- Cheboygan Area Schools
- NCES district ID
- 2608910
- Math proficiency
- 27% ▼ -7.00%
- Reading proficiency
- 43% ▼ -3.00%
- Median HH income
- $37,751
- Composite
- 29.12/100
- National rank
- #6590
- State rank
- #307 of 540 in MI
Livability — Benton
No livability data for this city. (Only ~50 U.S. cities are tracked.)
Census & demographics
- Population (ZIP)
- 13,937
Population outlook (Cheboygan County) Hauer SSP2
- Today (2025)
- 23,773 people
- By 2030
- 22,545 · -5.2%
- By 2040
- 19,526 · -17.9%
- By 2050
- 16,547 · -30.4%
- By 2075
- 11,263 · -52.6%
- By 2100
- 7,290 · -69.3%
Race, ethnicity, and origin ACS 2023
- Neighborhood character
- Predominantly White (91%)
- Race & ethnicity
- White 91% Two or more races 4% Native American 3% Hispanic / Latino 2% Black 1%
- Common ancestry
- Romanian 10% Lithuanian 8% Iranian 3%
- Foreign-born
- 2% · Canada
- Languages at home
- 97% English-only · Spanish 1% German/W. Germanic 1%
Political lean MEDSL · Cheboygan
- 2024 margin
- Solid R (+31.1) · D 33.8% · R 64.9% · Other 1.4%
- 2008→2024 swing
- -29.7pp toward R · 2008: -1.4pp · 2024: -31.1pp
- All cycles
- 2024: R+31.1 2020: R+29.9 2016: R+32.1 2012: R+10.9 2008: R+1.4
Not yet ingested
- Civics
- —
Market trends
- HPI YoY
- ▼ -137.70%
- Current HPI
- 219.6018
- Rent YoY
- —
- Metro
- —
- State GDP YoY
- ▲ 1.37%
- F500 in state
- 28
Industry mix (Fortune 500 HQ in MI)
| Industry | F500 HQs | Revenue |
|---|---|---|
| Automotive Parts | 3 | $48B |
|
||
| Automotive | 2 | $372B |
|
||
| Chemicals | 1 | $45B |
|
||
| Automotive Retail | 1 | $29B |
|
||
| Healthcare / Medical Devices | 1 | $23B |
|
||
| Automotive Technology | 1 | $20B |
|
||
Price history
+368.8% since first listed5 events — show timeline
- 2026-05-15 Listed $75,000 WWMLS
- 2008-06-13 Sold (Public Records) $29,000 Public Records
- 2005-03-24 Sold (Public Records) $32,500 Public Records
- 2004-05-05 Sold (Public Records) $25,000 Public Records
- 1997-11-14 Sold (Public Records) $16,000 Public Records
Property tax history
+4.6%/yrLatest (2025): $537 · -14.2% YoY. Source: county tax records.
Cash-flow waterfall
monthlySold comps — $/sqft
last 12 mo · ≤1 miLoading sold comps…