1032 E 19th St #3 · Bakersfield, CA
Flood risk 1/10 · Minimal
- FEMA flood zone
- X (unshaded)
- Chance of flooding over 30 yrs
- 0.0%
- Est. flood insurance / yr
- $473 – $860
Fire risk 1/10 · Minimal
- Est. fire insurance / yr
- $659 – $1,223
Heat risk 8/10 · Major
- Hot days now (above 105°F)
- 7 days/yr
- Hot days in 30 yrs
- 19 days/yr
Wind risk 1/10 · Minimal
- Chance of severe wind over 30 yrs
- —
Air-quality risk 10/10 · Severe
- Unhealthy air days now
- 39 days/yr
- Unhealthy air days in 30 yrs
- 45 days/yr
Risk factors via First Street. Map © Google.
Why this score? — see what drove the F grade
The composite is a weighted blend of 9 inputs, each scored 0–100. Each bar is that input's sub-score; the figure is the points it added to the 100-point composite (weight × sub-score).
- ARV discount +7.5/15.0
- Cash flow +4.3/30.0
- Rent growth +4.2/5.0
- Schools +3.4/10.0
- Livability +2.9/5.0
- Condition / age +2.2/5.0
- 1% rule +0.4/10.0
- DSCR +0.0/10.0
- Appreciation +0.0/10.0
$308,000
🖨 Deal sheet (PDF) 📄 Offer letter ✓ Due diligence
Listing remarks MLS
This is a great opportunity be come an investor two separates APN 3 units buy only 3 units or both are next with different APN If you buy both come with $200,000 down payment and the seller can finance the rest with 7% interest.
Key facts
- 7,405 sq ft lot
- 3 garage spots
- Built 1914
Neighborhood map
What this means for you Summary
Snapshot
- This is a condo listed at $308k. Condition is rated fair.
Deal economics
- At list price, monthly cash flow is $-816 ($-10k/yr) — negative.
- To cash-flow at today's rent, offer at most $190k (38.3% below list).
- To meet the 1% rule (rent ≥ 1% of price), the offer needs to be $166k (46.0% below list).
- Recommended offer: $166k (46.0% below list) — sets the bar for 1% rule.
Location & tenants
- Location reads 58/100 on livability (#716 in CA) — a working-class tenant base; expect higher turnover. Strengths: housing A+; Watch: health & safety D, schools D-, crime F.
- Kern High (urban): math 21% / reading 51% proficiency, ranked #860 of 1,400 in CA (top 61%) — families likely to look elsewhere, expect single-tenant / working-renter base with shorter leases.
- Market conditions: Rents rising fast (+6.8%/yr); 143 active listings in the ZIP; 6 comparable units currently listed for rent nearby; rentals leasing fast (median 3d on market — plan ~1-2 weeks tenant-placement turnaround); lower-income renter base — watch delinquency; 3,244 units permitted in Kern County in 2024 (73 in 5+ unit buildings).
- At $1,662/mo this rent would consume 46% of the median local household income ($43k/yr) (locally 2376% of renters already pay >50% of income on rent) — very limited rent-growth headroom before tenants either downsize or default.
Forward outlook
- Local home prices are declining (-3.0%/yr); year-one equity from $2k of loan paydown is wiped out by about $9k of value loss. Plan a longer hold.
- Kern County population projected at +17% by 2050 — long-run rental-demand tailwind backs the buy-and-hold thesis.
Negotiation context
- It's been on market 206 days — a 12% lower offer ($271k) is reasonable based on typical stale-listing flexibility.
Risks & watch-outs
- Watch-outs: built in 1914 — expect roof / HVAC / electrical / plumbing capex.
- Climate carrying-cost: extreme-heat days projected 7→19/yr by 2055 (HVAC capex compounding) — expect insurance premiums to compound above CPI over the hold.
Questions for the listing agent
- What do current leases actually rent for vs. the listed asking? Can we see a recent rent roll and the last 12 months of T-12 income?
- It's been on market 206 days. Have you received any prior offers? Is the seller open to a 46% concession, seller financing, or rate buy-down credit?
- Have any recent inspections been done? Can we get a copy of the seller's disclosures and any deferred-maintenance estimates?
- Built in 1914 — when were the roof, HVAC, electrical panel, plumbing, and water heater last replaced?
- Any open or pending special assessments — roof, HVAC, plumbing, elevator, façade? What's the per-unit balance and payoff schedule, and is the seller paying it off at close or rolling it to the buyer?
- Why hasn't it sold? Are there any deal-killer items the seller is aware of (foundation, flood, title, zoning, code violations)?
- Is there a deadline driving the sale (1031 exchange, divorce, estate, relocation)? That informs how much negotiation room exists.
- Schools are D-rated, which usually means shorter tenancies and higher turnover. Who's the typical renter profile here, and what's been the actual vacancy rate?
- Crime grade is F in this area — have there been break-ins, vandalism, or insurance claims at this property in the last 3 years? What carrier currently insures it and at what premium?
- The area grade is low — what's the realistic commute time and amenity access for the typical tenant pool here? Any planned neighborhood developments (good or bad) we should know about?
- What's the average days-on-market for RENTAL listings here right now (not sales)? A rising rental-DOM trend means longer vacancies and softer asking-rent achievability than the comps imply.
- What's the recent tenant-quality profile in this submarket — average credit score on applications, eviction rate, late-payment / NSF rate, and stable-employment percentage? A property-management company in the area should have these aggregated.
- How much new apartment / multifamily construction is in the pipeline within 1–3 miles? Heavy new supply (>2% of stock underway) typically softens rents 12–24 months out; light construction supports rent growth.
Investment metrics
- 1% rule
- 0.54% ✗
- Cap rate
- 3.11%
- Cash-on-cash
- -11.35%
- DSCR
- 0.49
- GRM
- 15.4
CMA / ARV
No comps found within radius.
Projected returns pro-forma
-3.0% appreciation · 6.79% rent growth · sell at horizon
- IRR
- -33.0%
- Equity multiple
- -0.10×
- Total profit
- $-95,258
- Equity at exit
- $45,924
- IRR
- -24.7%
- Equity multiple
- -0.40×
- Total profit
- $-120,556
- Equity at exit
- $26,630
Cash invested: $86,240 (down + closing). Projections, not guarantees.
Landlord ↔ Tenant lean methodology
- Overall (STATE)
- 18 Strongly Tenant-Friendly
- State California
- 18 Strongly Tenant-Friendly · D+13
- County
- — inherits STATE
- City
- — inherits STATE
ZIP-level market 93305
- Home prices YoY
- -29.9%
- Rents YoY
- 6.8%
- Active inventory
- 143
- Price-to-rent
- 15.4×
Monthly cashflow live
- Estimated rent
- $1,662 high interval (Pro) →
- Mortgage (P&I)
- −$1,615
- Tax est. 1.5%
- −$385 /mo · $4,620/yr
- Insurance
- −$128
- HOA
- −$0
- Vacancy / Maint / Mgmt
- −$349
- Net cashflow
- $-816
Break-even live
Sensitivity live
| Price | -10% $-603 | -5% $-709 | +0% $-816 | +5% $-922 | +10% $-1,029 |
|---|---|---|---|---|---|
| Rent | -10% $-947 | -5% $-881 | +0% $-816 | +5% $-750 | +10% $-684 |
| Rate | -1.0pp $-661 | -0.5pp $-737 | base $-816 | +0.5pp $-895 | +1.0pp $-977 |
UW: 25.0% down · 7.5% · 30yr · 1.5% tax · 5.0% vac · 8.0% maint · 8.0% mgmt
Financing live
Cash to close
- Down payment
- $77,000
- Closing costs
- $9,240
- Reserves months
- —
- Total cash needed
- —
Loan-product check · same deal, 3 products live
Conventional
25% down · 7.5% · 30yr
- Down + closing
- —
- Monthly P&I
- —
- Monthly cashflow
- —
- DSCR
- —
- Eligible?
- —
Personal DTI + credit; lowest rate.
DSCR
20% down · 8.5% · 30yr
- Down + closing
- —
- Monthly P&I
- —
- Monthly cashflow
- —
- DSCR
- —
- Eligible?
- —
No personal income docs; deal must DSCR.
Hard money
10% down · 12.0% · 12mo
- Down + closing
- —
- Monthly P&I
- —
- Monthly cashflow
- —
- DSCR
- —
- Eligible?
- —
Short-term bridge; refi at stabilization.
Rent comps 6 comps
| Address | Beds | Baths | Sqft | Rent | $/sqft | DOM | Units | Dist |
|---|---|---|---|---|---|---|---|---|
| 1500 Palm Dr Bakersfield, CA | 3.0 | 2.0 | 2000 | $2,200 | $1.10 | 3d | 1 | 1.06mi |
| 520 Union Ave Unit C Bakersfield, CA | 3.0 | 2.0 | 1610 | $1,195 | $0.74 | 3d | 1 | 1.16mi |
| 136 Clifton St Bakersfield, CA | 3.0 | 1.0 | 1308 | $1,775 | $1.36 | 3d | 1 | 1.16mi |
| 114 Flower St Bakersfield, CA | 3.0 | 1.5 | 1771 | $2,000 | $1.13 | 3d | 1 | 1.17mi |
| 115 Irene St Bakersfield, CA | 3.0 | 1.0 | 1620 | $1,900 | $1.17 | 3d | 1 | 1.35mi |
| 525 Jeffrey St Bakersfield, CA | 2.0 | 1.0 | 1700 | $1,700 | $1.00 | 3d | 1 | 1.39mi |
HOA detail condo
- Monthly dues
- $0 · $0/yr
- Assessments
- None detected in remarks — confirm with the listing agent.
Listing history 16 events
-
2026-06-18days on market $308,000 Active 206 DOM
-
2026-06-17days on market $308,000 Active 205 DOM
-
2026-06-16days on market $308,000 Active 204 DOM
-
2026-06-15days on market $308,000 Active 203 DOM
-
2026-06-14days on market $308,000 Active 201 DOM
-
2026-06-10days on market $308,000 Active 198 DOM
-
2026-06-09days on market $308,000 Active 197 DOM
-
2026-06-08days on market $308,000 Active 196 DOM
-
2026-06-07days on market $308,000 Active 195 DOM
-
2026-06-05days on market $308,000 Active 192 DOM
-
2026-06-03days on market $308,000 Active 191 DOM
-
2026-06-03days on market $308,000 Active 190 DOM
-
2026-06-01days on market $308,000 Active 189 DOM
-
2026-05-31days on market $308,000 Active 188 DOM
-
2026-01-28price $308,000 228-char remark
Show marketing remark (228 chars)
This is a great opportunity be come an investor two separates APN 3 units buy only 3 units or both are next with different APN If you buy both come with $200,000 down payment and the seller can finance the rest with 7% interest.
-
2025-11-25$285,000 Active 228-char remark
Show marketing remark (228 chars)
This is a great opportunity be come an investor two separates APN 3 units buy only 3 units or both are next with different APN If you buy both come with $200,000 down payment and the seller can finance the rest with 7% interest.
ⓘ Source: listings_history table (triggers on properties + properties_extension) + one-shot
backfill from property_details.listing_events for pre-trigger history.
Climate risk First Street
- Flood 1/10 Low FEMA zone X (unshaded) · 0% chance over 30 yrs
- Wildfire 1/10 Low
- Heat 8/10 Severe 7 d/yr ≥105°F today · 19 d/yr by 30 yrs out
- Wind 1/10 Low
- Air quality 10/10 Extreme 39 unhealthy d/yr today · 45 by 30 yrs out
Nearby sold comps map
Loading sold comps map…
Walkable amenities ~0.75 mi
Loading nearby amenities…
Taxation est. · year 1
- Rental income
- $19,942
- − Mortgage interest
- −$17,253
- − Property taxes
- −$4,620
- − Insurance
- −$1,540
- − Repairs & maintenance
- −$1,595
- − Management
- −$1,595
- − Depreciation
- −$8,960
- Taxable loss
- −$15,622
- Est. tax savings @ 24.0%
- +$3,749
- After-tax cash flow
- $-6,039/yr
For passive investors: Depreciation is non-cash, so a rental often shows a tax loss while cash-flowing — sheltering income. Rental losses are passive: they offset passive income freely, and up to $25,000/yr can offset ordinary (W-2) income if you actively participate and your MAGI is under $100k (phasing out to $0 by $150k); unused losses carry forward. On sale, claimed depreciation is recaptured at up to 25%, and gains may owe capital-gains tax (a 1031 exchange can defer both). Figures are a year-1 estimate at your 24.0% rate — not tax advice; consult a CPA.
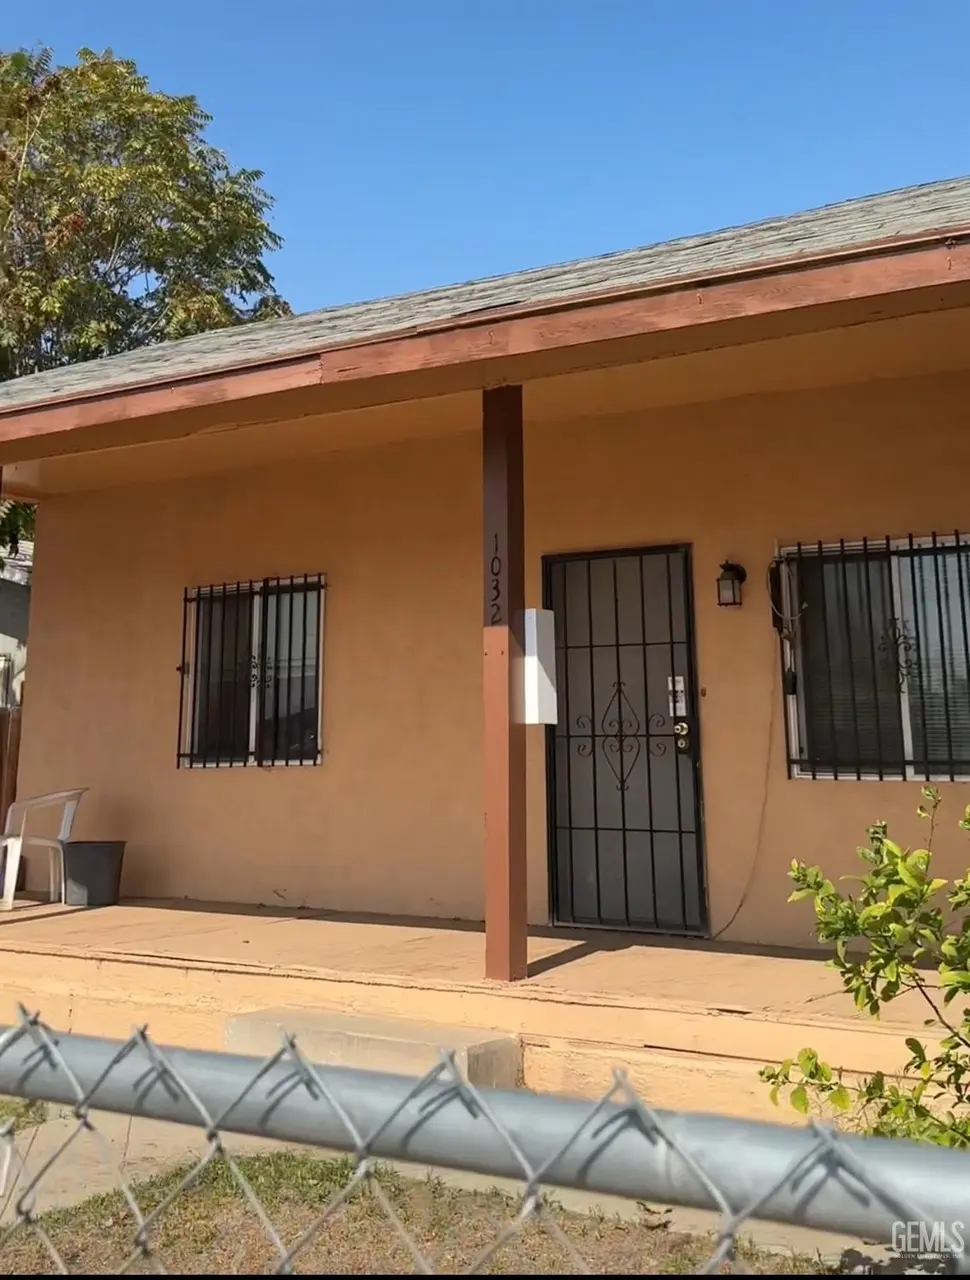
Condition & rehab AI · 3 photos
This multi-family property requires moderate repairs and maintenance to improve its curb appeal and value. Focus on repairing the siding, painting the exterior, and maintaining the landscaping.
Repairs flagged
- Major siding — Significant wear and tear
- Major landscaping — Overgrown and unkempt
- Major exterior walls — Visible discoloration
Value-add opportunities
- Both paint exterior walls — Enhances curb appeal and value
- Both landscaping — Improves curb appeal and rental appeal
- Both repair siding — Fixes major issue and improves appearance
Renovation cost estimate screening
| Repair item | Severity | Est. cost |
|---|---|---|
| siding · Significant wear and tear | Major | $15,000–50,000 |
| landscaping · Overgrown and unkempt | Major | $15,000–50,000 |
| exterior walls · Visible discoloration | Major | $15,000–50,000 |
| Total estimated repair cost · 3 items | $45,000–150,000 |
Value-add ROI direction
- Both paint exterior walls — Enhances curb appeal and value ↑
- Both landscaping — Improves curb appeal and rental appeal ↑
- Both repair siding — Fixes major issue and improves appearance ↑
ⓘ Cost ranges are severity-bucket heuristics (US national rule-of-thumb). Get contractor quotes + a written scope before underwriting a rehab budget.
Schools (NCES district)
- District
- Kern High
- NCES district ID
- 0619540
- Math proficiency
- 21% ▬ 0.00%
- Reading proficiency
- 51% ▲ 2.00%
- Median HH income
- $49,686
- Composite
- 33.68/100
- National rank
- #10443
- State rank
- #860 of 1400 in CA
Livability — Bakersfield
- Score
- 58/100
- State rank
- #716
- US rank
- #21355
Category grades
Schools grade is shown separately in the Schools card above.
Census & demographics
- Census place
- Bakersfield, CA
- County
- Kern County · 710,371 people
- City population
- 499,124
- Metro
- Bakersfield, CA
- Population (ZIP)
- 37,714
- Household income
- $43,244
- Rent vs Own
- Severe rent burden
- 2376.0
Population outlook (Kern County) Hauer SSP2
- Today (2025)
- 947,286 people
- By 2030
- 978,984 · +3.3%
- By 2040
- 1,045,018 · +10.3%
- By 2050
- 1,105,232 · +16.7%
- By 2075
- 1,229,538 · +29.8%
- By 2100
- 1,238,059 · +30.7%
Race, ethnicity, and origin ACS 2023
- Neighborhood character
- Predominantly Hispanic (76%)
- Race & ethnicity
- Hispanic / Latino 76% Two or more races 18% White 16% Black 5% Native American 3%
- Hispanic origin (detail)
- Mexican 69% Puerto Rican 1%
- Common ancestry
- Lithuanian 1% Serbian 1% Dutch 1%
- Foreign-born
- 22% · Canada
- Languages at home
- 45% English-only · Spanish 54%
Political lean MEDSL · Kern
- 2024 margin
- Strong R (+21.1) · D 38.2% · R 59.3% · Other 2.5%
- 2008→2024 swing
- -3.3pp toward R · 2008: -17.8pp · 2024: -21.1pp
- All cycles
- 2024: R+21.1 2020: R+10.2 2016: R+15.0 2012: R+20.9 2008: R+17.8
Not yet ingested
- Civics
- —
Market trends
- HPI YoY
- ▼ -181.24%
- Current HPI
- 424.6051
- Rent YoY
- ▲ 6.79%
- Metro
- Bakersfield, CA
- State GDP YoY
- ▲ 3.21%
- F500 in state
- 116
Industry mix (Fortune 500 HQ in CA)
| Industry | F500 HQs | Revenue |
|---|---|---|
| Technology | 27 | $1,492B |
|
||
| Financial Services | 3 | $174B |
|
||
| Retail | 3 | $44B |
|
||
| Insurance | 3 | $26B |
|
||
| Media / Entertainment | 2 | $115B |
|
||
| Pharmaceuticals / Biotech | 2 | $62B |
|
||
Price history
+8.1% since first listed2 events — show timeline
- 2026-01-28 Price Changed $308,000 GEMLS
- 2025-11-25 Listed $285,000 GEMLS
Cash-flow waterfall
monthlySold comps — $/sqft
last 12 mo · ≤1 miLoading sold comps…