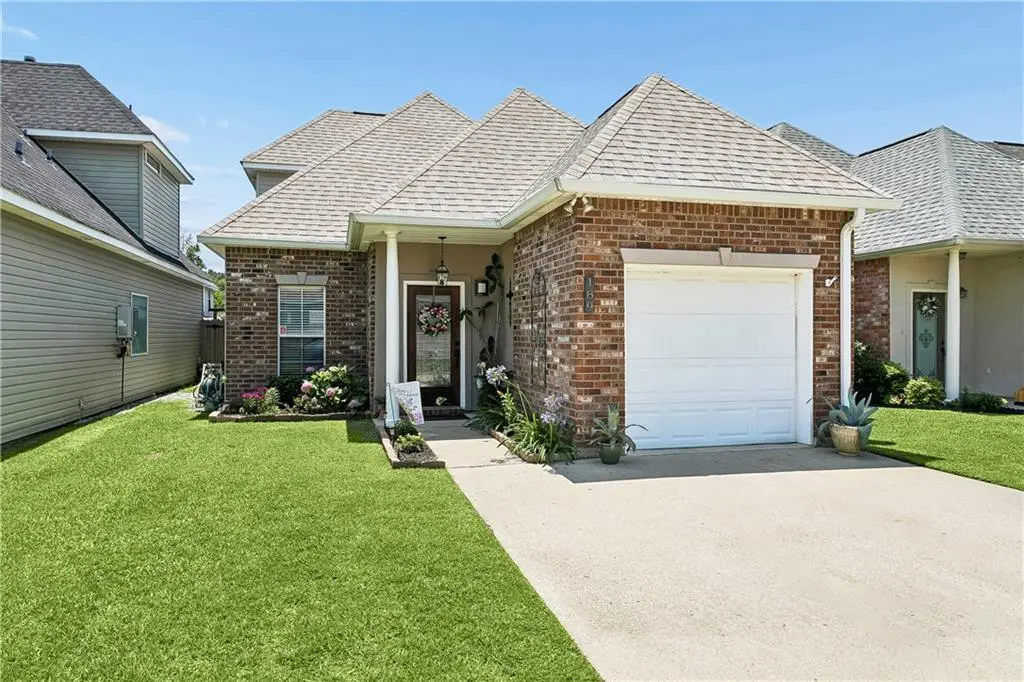
189 Emerald Oaks Dr · Covington, LA
Flood risk No data
- FEMA flood zone
- —
- Chance of flooding over 30 yrs
- —
- Est. flood insurance / yr
- —
Fire risk No data
- Est. fire insurance / yr
- —
Heat risk No data
- Hot days now (above threshold)
- —
- Hot days in 30 yrs
- —
Wind risk No data
- Chance of severe wind over 30 yrs
- —
Air-quality risk No data
- Unhealthy air days now
- —
- Unhealthy air days in 30 yrs
- —
Risk factors via First Street. Map © Google.
Why this score? — see what drove the D- grade
The composite is a weighted blend of 9 inputs, each scored 0–100. Each bar is that input's sub-score; the figure is the points it added to the 100-point composite (weight × sub-score).
- Cash flow +11.0/30.0
- ARV discount +7.5/15.0
- Schools +4.3/10.0
- Livability +3.8/5.0
- Rent growth +3.6/5.0
- DSCR +3.2/10.0
- 1% rule +2.8/10.0
- Condition / age +2.5/5.0
- Appreciation +0.0/10.0
$264,900
🖨 Deal sheet 📄 Offer letter ✓ Due diligence
Listing remarks MLS
Precious 3 Bedroom garden home close to the interstate. Primary bedroom and bath on bottom floor, newly updated primary bath with oversized garden tub and Porcelain tile shower. Large walk-in closets, 2 bedrooms upstairs, Computer/ Desk area. Walk in floored attic, tankless hot water heater. Single car garage with painted flooring. Driveway to accommodate 2 cars. Roof is 2.5 years old and HVAC system is 1.5 years old. Home is conveniently located near the community built in pool. Covered back patio. HOA fee covers trash pickup and lawn care.
Key facts
- Computer desk area
- Walk in closets
- Oversized garden tub
Tags
Property features AI
Finance
- HOA & community: Homeowners association with a quarterly fee of $375; Gated community with pool
Exterior
- Parking: Attached garage with one space and garage door opener
- Security: Gated community
- Utilities: Public water; Public sewer
- Home design: 2-story home
- Construction: Brick and stucco construction; Shingle roof; Slab foundation; Property in excellent condition
- Exterior features: Fenced yard; Concrete patio/porch; Community pool; Outside city limits
Interior
- Kitchen: Granite counters
- Bedrooms: Total rooms: 7
- Bathrooms: 2 full bathrooms; 1 half bathroom
- Heating & cooling: Central heating; Central air conditioning
- Interior features: Attic; Ceiling fans; Carbon monoxide detector; Granite counters; Pull-down attic stairs; Cable TV
- Laundry & utility: Washer hookup; Dryer hookup
Neighborhood map
What this means for you Summary
Snapshot
- This is a 3-bed/2.5-bath condo listed at $265k.
Deal economics
- At list price, monthly cash flow is $-112 ($-1k/yr) — negative.
- To cash-flow at today's rent, offer at most $245k (7.5% below list).
- To meet the 1% rule (rent ≥ 1% of price), the offer needs to be $206k (22.1% below list).
- Recommended offer: $206k (22.1% below list) — sets the bar for 1% rule.
- Cap rate 5.8% vs local median 3.9% in Covington — top-decile yield for the area; either an underpriced asset or a hidden risk that comps aren't pricing in. Stress-test before assuming the spread holds.
Location & tenants
- Location reads 75/100 on livability (#17 in LA, #3,876 nationally) — a middle-class / working-renter tenant base. Strengths: employment A+, housing A+, health & safety A+; Watch: amenities F, commute F.
- St. Tammany Parish (suburban): math 43% / reading 55% proficiency, ranked #11 of 98 in LA (top 11%) — families likely to look elsewhere, expect single-tenant / working-renter base with shorter leases.
- Market conditions: Rents rising fast (+4.3%/yr); 524 active listings in the ZIP; 17 comparable units currently listed for rent nearby; rentals at typical pace (median 22d on market — plan ~3-4 weeks tenant-placement turnaround); solid renter incomes; 1,064 units permitted in St. Tammany Parish in 2024 (0 in 5+ unit buildings).
- This rent runs 30% of the median local income ($81k/yr) — at the standard rent-burdened threshold; future hikes will face affordability resistance.
Forward outlook
- Local home prices are declining (-3.0%/yr); year-one equity from $2k of loan paydown is wiped out by about $8k of value loss. Plan a longer hold.
- St. Tammany County population projected at +27% by 2050 — long-run rental-demand tailwind backs the buy-and-hold thesis.
Negotiation context
- It's been on market 32 days — a 3% lower offer ($257k) is reasonable based on typical stale-listing flexibility.
- 12 sale attempts since 16y ago with the ask held roughly flat each time — persistent listings suggest the price (not the market) is what's stuck; bring a comps-based counter.
Questions for the listing agent
- What do current leases actually rent for vs. the listed asking? Can we see a recent rent roll and the last 12 months of T-12 income?
- It's been on market 32 days. Have you received any prior offers? Is the seller open to a 22% concession, seller financing, or rate buy-down credit?
- What does the HOA fee cover, when was the last increase, and are there any pending special assessments or reserve-fund shortfalls?
- Any open or pending special assessments — roof, HVAC, plumbing, elevator, façade? What's the per-unit balance and payoff schedule, and is the seller paying it off at close or rolling it to the buyer?
- Is there a deadline driving the sale (1031 exchange, divorce, estate, relocation)? That informs how much negotiation room exists.
- Schools are B-rated — typically a magnet for longer-tenancy family renters. What's the average tenant stay here, and is there a school-zone premium baked into asking?
- The area grade is low — what's the realistic commute time and amenity access for the typical tenant pool here? Any planned neighborhood developments (good or bad) we should know about?
- What's the average days-on-market for RENTAL listings here right now (not sales)? A rising rental-DOM trend means longer vacancies and softer asking-rent achievability than the comps imply.
- What's the recent tenant-quality profile in this submarket — average credit score on applications, eviction rate, late-payment / NSF rate, and stable-employment percentage? A property-management company in the area should have these aggregated.
- How much new apartment / multifamily construction is in the pipeline within 1–3 miles? Heavy new supply (>2% of stock underway) typically softens rents 12–24 months out; light construction supports rent growth.
Investment metrics
- 1% rule
- 0.78% ✗
- Cap rate
- 5.79%
- Cash-on-cash
- -1.81%
- DSCR
- 0.92
- GRM
- 10.7
CMA / ARV
No comps found within radius.
Projected returns pro-forma
-3.0% appreciation · 4.31% rent growth · sell at horizon
- IRR
- -17.9%
- Equity multiple
- 0.36×
- Total profit
- $-47,308
- Equity at exit
- $39,497
- IRR
- -7.9%
- Equity multiple
- 0.48×
- Total profit
- $-38,833
- Equity at exit
- $22,904
Cash invested: $74,172 (down + closing). Projections, not guarantees.
Landlord ↔ Tenant lean methodology
- Overall (STATE)
- 90 Strongly Landlord-Friendly
- State Louisiana
- 90 Strongly Landlord-Friendly · R+12
- County
- — inherits STATE
- City
- — inherits STATE
ZIP-level market 70433
- Rents YoY
- 4.3%
- Active inventory
- 524
- Price-to-rent
- 10.7×
Monthly cashflow live
- Estimated rent
- $2,065 high interval (Pro) →
- Mortgage (P&I)
- −$1,389
- Tax from tax record
- −$118 /mo · $1,418/yr
- Insurance
- −$110
- HOA
- −$125
- Vacancy / Maint / Mgmt
- −$434
- Net cashflow
- $-112
Break-even live
UW: 25.0% down · 7.5% · 30yr · 1.5% tax · 5.0% vac · 8.0% maint · 8.0% mgmt
Financing live
Cash to close
- Down payment
- $66,225
- Closing costs
- $7,947
- Reserves months
- —
- Total cash needed
- —
Loan-product check · same deal, 3 products live
Conventional
25% down · 7.5% · 30yr
- Down + closing
- —
- Monthly P&I
- —
- Monthly cashflow
- —
- DSCR
- —
- Eligible?
- —
Personal DTI + credit; lowest rate.
DSCR
20% down · 8.5% · 30yr
- Down + closing
- —
- Monthly P&I
- —
- Monthly cashflow
- —
- DSCR
- —
- Eligible?
- —
No personal income docs; deal must DSCR.
Hard money
10% down · 12.0% · 12mo
- Down + closing
- —
- Monthly P&I
- —
- Monthly cashflow
- —
- DSCR
- —
- Eligible?
- —
Short-term bridge; refi at stabilization.
Rent comps 17 comps
| Address | Beds | Baths | Sqft | Rent | $/sqft | DOM | Units | Dist |
|---|---|---|---|---|---|---|---|---|
| 312 Lismore Ln Covington, LA | 3.0 | 2.5 | 1521 | $2,900 | $1.91 | 23d | 1 | 0.04mi |
| 140 Holiday Blvd Covington, LA | 2.0 | 1.0–2.0 | 652 | $1,525 | $2.34 | 1d | 12 | 0.19mi |
| 3 Hollycrest Blvd Covington, LA | 2.0 | 2.0 | 1413 | $1,495 | $1.06 | 3d | 1 | 0.48mi |
| 110 Robinhood Dr Covington, LA | 3.0 | 2.0 | 1600 | $1,500 | $0.94 | 43d | 1 | 0.54mi |
| 1612 Versailles Business Pkwy Covington, LA | 1.0–2.0 | 1.0–2.0 | 1009 | $2,089 | $2.07 | 2d | 31 | 0.57mi |
| 308 Robinhood Dr Covington, LA | 3.0 | 2.0 | 1650 | $1,800 | $1.09 | 3d | 1 | 0.60mi |
| 445 Tiger Ave Covington, LA | 3.0 | 2.0 | 1538 | $2,300 | $1.50 | 23d | 1 | 0.61mi |
| 2021 Sullivan Ln Covington, LA | 1.0–2.0 | 1.0–2.0 | 860 | $1,856 | $2.16 | 2d | 18 | 0.68mi |
| 19425 Slemmer Rd Unit 2 Covington, LA | 3.0 | 2.0 | 1100 | $1,100 | $1.00 | 21d | 1 | 0.76mi |
| 350 Emerald Forest Blvd Covington, LA | 1.0–2.0 | 1.0–2.0 | 845 | $1,600 | $1.89 | 11d | 2 | 0.77mi |
| 28 Park Place Dr Covington, LA | 1.0–3.0 | 1.0–2.0 | 963 | $1,407 | $1.46 | 1d | 9 | 0.80mi |
| 100 Covington Meadow Cir Unit D Covington, LA | 3.0 | 2.5 | 1356 | $1,600 | $1.18 | 17d | 1 | 0.98mi |
| 104 Covington Meadow Cir Unit I Covington, LA | 3.0 | 2.5 | 1476 | $1,600 | $1.08 | 23d | 1 | 0.99mi |
| 103 Covington Meadow Cir Unit F Covington, LA | 3.0 | 2.5 | 1476 | $1,700 | $1.15 | 43d | 1 | 1.01mi |
| 103 Covington Meadow Cir Unit E Covington, LA | 3.0 | 2.5 | 1476 | $1,700 | $1.15 | 23d | 1 | 1.01mi |
| 70403 L St Covington, LA | 3.0 | 2.0 | 1250 | $1,695 | $1.36 | 43d | 1 | 1.44mi |
| 126 Pear St Unit A Covington, LA | 3.0 | 2.0 | 1383 | $1,600 | $1.16 | 23d | 1 | 1.46mi |
HOA detail condo
- Monthly dues
- $125 · $1,500/yr
- Likely covers
- watertrashlandscapingpool
- Assessments
- None detected in remarks — confirm with the listing agent.
Listing history 31 events
-
2026-06-18days on market $264,900 Active 32 DOM
-
2026-06-17days on market $264,900 Active 31 DOM
-
2026-06-16days on market $264,900 Active 30 DOM
-
2026-06-15days on market $264,900 Active 29 DOM
-
2026-06-13days on market $264,900 Active 27 DOM
-
2026-06-10days on market $264,900 Active 24 DOM
-
2026-06-09days on market $264,900 Active 23 DOM
-
2026-06-08days on market $264,900 Active 22 DOM
-
2026-06-07days on market $264,900 Active 21 DOM
-
2026-06-03days on market $264,900 Active 17 DOM
-
2026-06-02days on market $264,900 Active 16 DOM
-
2026-06-01days on market $264,900 Active 15 DOM
-
2026-05-31days on market $264,900 Active 14 DOM
-
2026-05-17$274,900 Active
Show marketing remark (547 chars)
Precious 3 Bedroom garden home close to the interstate. Primary bedroom and bath on bottom floor, newly updated primary bath with oversized garden tub and Porcelain tile shower. Large walk-in closets, 2 bedrooms upstairs, Computer/ Desk area. Walk in floored attic, tankless hot water heater. Single car garage with painted flooring. Driveway to accommodate 2 cars. Roof is 2.5 years old and HVAC system is 1.5 years old. Home is conveniently located near the community built in pool. Covered back patio. HOA fee covers trash pickup and lawn care.
-
2026-05-17$274,900 Active 547-char remark
Show marketing remark (547 chars)
Precious 3 Bedroom garden home close to the interstate. Primary bedroom and bath on bottom floor, newly updated primary bath with oversized garden tub and Porcelain tile shower. Large walk-in closets, 2 bedrooms upstairs, Computer/ Desk area. Walk in floored attic, tankless hot water heater. Single car garage with painted flooring. Driveway to accommodate 2 cars. Roof is 2.5 years old and HVAC system is 1.5 years old. Home is conveniently located near the community built in pool. Covered back patio. HOA fee covers trash pickup and lawn care.
-
2023-07-05soldstatus $249,900
-
2023-06-30soldstatus $249,900 Closed
-
2023-05-22historical Active Under Contract
-
2023-05-19$259,900
-
2023-05-19$259,900 Active
-
2013-05-02soldstatus $164,000
-
2013-04-18soldstatus $164,000
-
2013-04-18soldstatus $164,000
-
2013-02-22$164,000
-
2013-02-22$164,000
-
2013-02-21$164,000
-
2013-02-21$164,000
-
2010-06-03$175,000
-
2010-06-03$185,000
-
2010-06-03$175,000
-
2010-06-03$185,000
ⓘ Source: listings_history table (triggers on properties + properties_extension) + one-shot
backfill from property_details.listing_events for pre-trigger history.
Tax reassessment forecast LA · Resets to sale price
- Current annual tax
- $1,418 · $118/mo
- Projected year-2 tax
- $1,457 · $121/mo
- Expected delta
- +$39/yr (+$3/mo · 2.7%)
ⓘ Screening estimate from a state-policy table — verify with the county assessor before closing.
Nearby sold comps map
Loading sold comps map…
Walkable amenities ~0.75 mi
Loading nearby amenities…
Taxation est. · year 1
- Rental income
- $24,774
- − Mortgage interest
- −$14,839
- − Property taxes
- −$1,418
- − Insurance
- −$1,324
- − Repairs & maintenance
- −$1,982
- − Management
- −$1,982
- − HOA
- −$1,500
- − Depreciation
- −$7,706
- Taxable loss
- −$5,977
- Est. tax savings @ 24.0%
- +$1,434
- After-tax cash flow
- $94/yr
For passive investors: Depreciation is non-cash, so a rental often shows a tax loss while cash-flowing — sheltering income. Rental losses are passive: they offset passive income freely, and up to $25,000/yr can offset ordinary (W-2) income if you actively participate and your MAGI is under $100k (phasing out to $0 by $150k); unused losses carry forward. On sale, claimed depreciation is recaptured at up to 25%, and gains may owe capital-gains tax (a 1031 exchange can defer both). Figures are a year-1 estimate at your 24.0% rate — not tax advice; consult a CPA.
Schools (NCES district)
- District
- St. Tammany Parish
- NCES district ID
- 2201650
- Math proficiency
- 43% ▼ -32.00%
- Reading proficiency
- 55% ▼ -26.00%
- Median HH income
- $61,752
- Composite
- 43.04/100
- National rank
- #3098
- State rank
- #11 of 98 in LA
Livability — Covington
- Score
- 75/100
- State rank
- #17
- US rank
- #3876
Category grades
Schools grade is shown separately in the Schools card above.
Census & demographics
- County
- Saint Tammany Parish · 228,296 people
- City population
- 64,351
- Metro
- New Orleans-Metairie, LA
- Population (ZIP)
- 41,876
- Household income
- $81,241
- Rent vs Own
- Severe rent burden
- 1287.0
Population outlook (St. Tammany County) Hauer SSP2
- Today (2025)
- 286,725 people
- By 2030
- 304,175 · +6.1%
- By 2040
- 336,203 · +17.3%
- By 2050
- 364,590 · +27.2%
- By 2075
- 433,362 · +51.1%
- By 2100
- 470,333 · +64.0%
Race, ethnicity, and origin ACS 2023
- Neighborhood character
- Predominantly White (78%)
- Race & ethnicity
- White 78% Black 9% Hispanic / Latino 7% Two or more races 7% Native American 1% Asian 1%
- Hispanic origin (detail)
- Mexican 2%
- Common ancestry
- Lithuanian 17% Italian 2% Slovak 2%
- Foreign-born
- 5% · Canada, Vietnam
- Languages at home
- 92% English-only · Spanish 5% French/Haitian/Cajun 1% Vietnamese 1%
Political lean MEDSL · St. Tammany
- 2024 margin
- Solid R (+43.8) · D 27.3% · R 71.1% · Other 1.6%
- 2008→2024 swing
- +9.6pp toward D · 2008: -53.4pp · 2024: -43.8pp
- All cycles
- 2024: R+43.8 2020: R+44.2 2016: R+50.8 2012: R+52.2 2008: R+53.4
Not yet ingested
- Civics
- —
Market trends
- HPI YoY
- ▼ -112.14%
- Current HPI
- 181.8348
- Rent YoY
- ▲ 4.31%
- Metro
- New Orleans-Metairie, LA
- State GDP YoY
- ▲ 3.29%
- F500 in state
- 10
Industry mix (Fortune 500 HQ in LA)
| Industry | F500 HQs | Revenue |
|---|---|---|
| Telecommunications | 2 | $23B |
|
||
| Utilities | 1 | $12B |
|
||
| Wholesale / Distribution | 1 | $5B |
|
||
| Advertising | 1 | $2B |
|
||
Price history
+57.1% since first listed18 events — show timeline
- 2026-05-17 Listed $274,900 AcadianaMLS
- 2026-05-17 Listed $274,900 GSREIN
- 2023-07-05 Sold (Public Records) $249,900 Public Records
- 2023-06-30 Sold (MLS) $249,900 GSREIN
- 2023-05-22 Contingent — GSREIN
- 2023-05-19 Listed $259,900 GSREIN
- 2023-05-19 Listed $259,900 AcadianaMLS
- 2013-05-02 Sold (Public Records) $164,000 Public Records
- 2013-04-18 Sold (MLS) $164,000 GSREIN
- 2013-04-18 Sold (MLS) $164,000 GSREIN
- 2013-02-22 Listed $164,000 AcadianaMLS
- 2013-02-22 Listed $164,000 GSREIN
- 2013-02-21 Listed $164,000 AcadianaMLS
- 2013-02-21 Listed $164,000 GSREIN
- 2010-06-03 Listed $185,000 GSREIN
- 2010-06-03 Listed $175,000 GSREIN
- 2010-06-03 Listed $185,000 AcadianaMLS
- 2010-06-03 Listed $175,000 AcadianaMLS
Property tax history
-3.0%/yrLatest (2025): $1,418 · -3.6% YoY. Source: county tax records.
Cash-flow waterfall
monthlySold comps — $/sqft
last 12 mo · ≤1 miLoading sold comps…