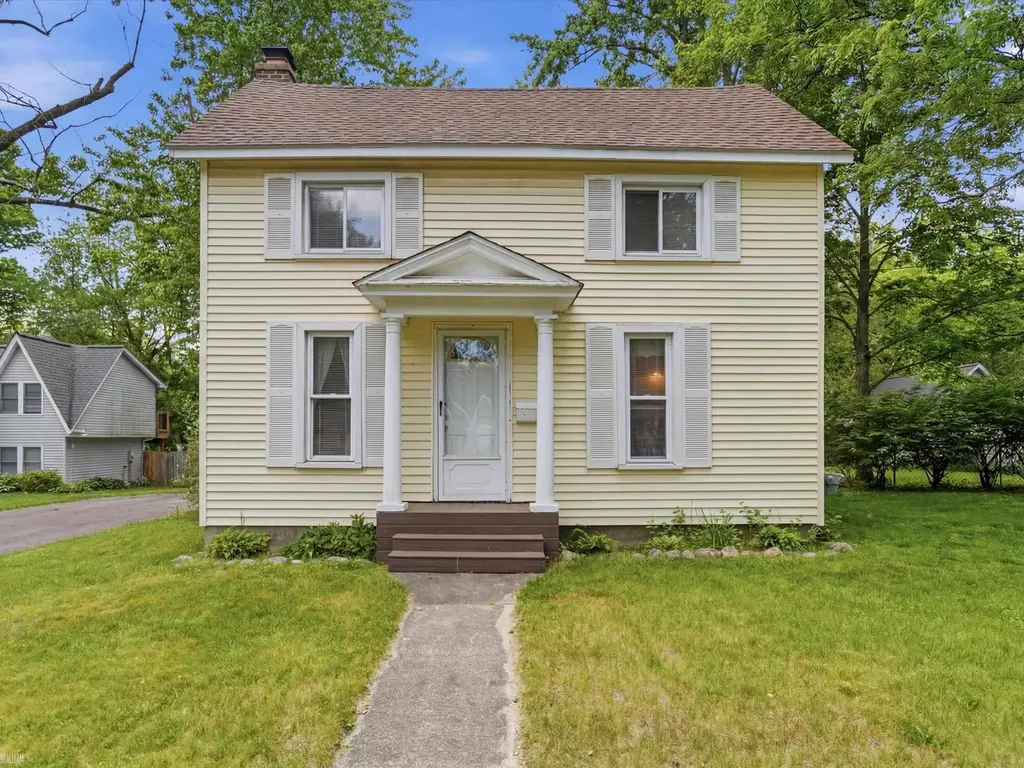
328 S 3rd St · Brighton, MI
Flood risk 1/10 · Minimal
- FEMA flood zone
- X (unshaded)
- Chance of flooding over 30 yrs
- 0.0%
- Est. flood insurance / yr
- $473 – $860
Fire risk 1/10 · Minimal
- Est. fire insurance / yr
- $784 – $1,456
Heat risk 2/10 · Minimal
- Hot days now (above 96°F)
- 7 days/yr
- Hot days in 30 yrs
- 15 days/yr
Wind risk 2/10 · Minimal
- Chance of severe wind over 30 yrs
- —
Air-quality risk 2/10 · Minimal
- Unhealthy air days now
- 1 days/yr
- Unhealthy air days in 30 yrs
- 2 days/yr
Risk factors via First Street. Map © Google.
Why this score? — see what drove the B+ grade
The composite is a weighted blend of 9 inputs, each scored 0–100. Each bar is that input's sub-score; the figure is the points it added to the 100-point composite (weight × sub-score).
- Cash flow +30.0/30.0
- ARV discount +15.0/15.0
- DSCR +10.0/10.0
- 1% rule +8.6/10.0
- Schools +5.8/10.0
- Livability +3.9/5.0
- Rent growth +2.5/5.0
- Condition / age +2.5/5.0
- Appreciation +0.0/10.0
$265,000
🖨 Deal sheet 📄 Offer letter ✓ Due diligence
Listing remarks MLS
Welcome to this charming 4 bedroom home near downtown Brighton, offering a wonderful blend of historic character and functionality. Built in 1872, this home features timeless appeal with spacious living areas and a flexible floor plan, with two bedrooms on the main level and two bedrooms upstairs. The dining room adds warmth and character to the home. The main level also features a full bathroom and comfortable living spaces filled with natural light. Outside, you'll find a detached 1.5 car garage offering additional storage. Conveniently located near shopping, dining, parks, and all that Brighton has to offer, this home presents a unique opportunity to own a piece of local history.
Key facts
- Near dining
- Near shopping
- Flexible floor plan
Tags
Property features AI
Finance
- Other: Lot approximately 0.3 acre (100 x 133)
- HOA & community: Homeowners association present
Exterior
- Parking: Detached covered garage (about 1.5 car); Assigned parking; Paved driveway
- Utilities: Public water; Public sewer
- Home design: Single-family residence; Two levels
- Construction: Built with other materials; Unfinished basement
- Exterior features: Deck; Porch; Fenced yard; Paved road
Interior
- Kitchen: Dishwasher; Oven; Range; Refrigerator
- Flooring: Hardwood
- Bathrooms: 1 full bathroom
- Heating & cooling: Central air; Ceiling fan(s); Forced air heating; Natural gas heating
- Interior features: Dishwasher; Dryer; Oven; Refrigerator; Range; Washer; Hardwood flooring; Unfinished basement
- Laundry & utility: Washer; Dryer
Neighborhood map
What this means for you Summary
Snapshot
- This is a 4-bed/1.0-bath single-family listed at $265k.
Deal economics
- At list price, monthly cash flow is $1k ($13k/yr) — positive.
- The deal already cash-flows at list — no discount required.
- Meets the 1% rule at list price ($4k rent vs $265k).
- Recommended offer: $261k (1.5% below list) — sets the bar for market timing.
- Cap rate 11.2% vs local median 3.2% in Brighton — top-decile yield for the area; either an underpriced asset or a hidden risk that comps aren't pricing in. Stress-test before assuming the spread holds.
Location & tenants
- Location reads 78/100 on livability (#108 in MI, #2,621 nationally) — a middle-class / working-renter tenant base. Strengths: cost of living A+, housing A+, health & safety A+; Watch: amenities F, commute F.
- Brighton Area Schools (suburban): math 59% / reading 69% proficiency, ranked #22 of 540 in MI (top 4%) — acceptable for families but not a draw, mixed tenant base, ~2y average lease; only 10% free/reduced lunch — higher-income household profile.
- Market conditions: 178 active listings in the ZIP; 2 comparable units currently listed for rent nearby; solid renter incomes; 488 units permitted in Livingston County in 2024 (0 in 5+ unit buildings).
- This rent runs 41% of the median local income ($107k/yr) — at the standard rent-burdened threshold; future hikes will face affordability resistance.
Forward outlook
- Local home prices are declining (-3.0%/yr); year-one equity from $2k of loan paydown is wiped out by about $8k of value loss. Plan a longer hold.
- Livingston County population projected at +7% by 2050 — modest demand growth; plan on rents tracking national, not racing it.
- At projected returns (-3.0% appreciation + 3.0% rent growth), your $74k cash investment doubles in ~7 years — after that, you're playing with house money.
Negotiation context
- It's been on market 15 days — a 2% lower offer ($261k) is reasonable based on typical stale-listing flexibility.
- 2 sale attempts; this cycle's ask has dropped $65k (20%) from the opening price — seller is motivated, your offer sets the floor, not the list.
- Current owner paid $97k; list at $265k implies a 173% gain — meaningful room to come down on a strong offer.
Risks & watch-outs
- Watch-outs: built in 1872 — expect roof / HVAC / electrical / plumbing capex.
Questions for the listing agent
- Built in 1872 — when were the roof, HVAC, electrical panel, plumbing, and water heater last replaced?
- Is there a deadline driving the sale (1031 exchange, divorce, estate, relocation)? That informs how much negotiation room exists.
- Schools are A-rated — typically a magnet for longer-tenancy family renters. What's the average tenant stay here, and is there a school-zone premium baked into asking?
- What's the average days-on-market for RENTAL listings here right now (not sales)? A rising rental-DOM trend means longer vacancies and softer asking-rent achievability than the comps imply.
- What's the recent tenant-quality profile in this submarket — average credit score on applications, eviction rate, late-payment / NSF rate, and stable-employment percentage? A property-management company in the area should have these aggregated.
- How much new for-sale + rental construction is in the pipeline within 1–3 miles? Heavy new supply typically softens prices + rents 12–24 months out; constrained supply supports both.
Investment metrics
- 1% rule
- 1.36% ✓
- Cap rate
- 11.20%
- Cash-on-cash
- 17.51%
- DSCR
- 1.78
- GRM
- 6.1
CMA / ARV
- ARV (on-the-fly)
- $366,096
- Comps found
- 10
Show comp detail 10 sales within ~0.75 mi
| Address | Dist | Beds/Ba | Sqft | Sold | Price | $/sf | Match |
|---|---|---|---|---|---|---|---|
| 870 Alpine Dr | 0.61mi | 3/2.0 (-1) | 1,377 (-1%) | 4mo | $400,000 | $290 | 58 |
| 304 S 3rd St | 0.05mi | 3/2.0 (-1) | 1,598 (+15%) | 10mo | $400,200 | $250 | 55 |
| 838 Devonshire Blvd | 0.43mi | 3/1.5 (-1) | 1,430 (+3%) | 19mo | $355,000 | $248 | 53 |
| 728 S 3rd St | 0.27mi | 3/2.0 (-1) | 1,281 (-8%) | 16mo | $380,000 | $297 | 52 |
| 4860 Dillon St | 0.46mi | 3/2.0 (-1) | 1,443 (+4%) | 19mo | $390,000 | $270 | 48 |
| 725 S 3rd St | 0.26mi | 3/2.0 (-1) | 1,512 (+9%) | 22mo | $265,000 | $175 | 46 |
| 773 Oak Ridge Dr | 0.56mi | 3/1.5 (-1) | 1,427 (+2%) | 20mo | $375,000 | $263 | 46 |
| 624 E Main St | 0.58mi | 3/2.0 (-1) | 1,200 (-14%) | 6mo | $355,000 | $296 | 36 |
| 215 S East St | 0.51mi | 3/2.0 (-1) | 1,528 (+10%) | 22mo | $375,000 | $245 | 32 |
| 894 Alpine Dr | 0.69mi | 3/2.0 (-1) | 1,575 (+13%) | 10mo | $350,000 | $222 | 29 |
Match score weights: distance 35% · size 25% · config 20% · recency 20%. Top-matched comps best support the ARV.
Projected returns pro-forma
-3.0% appreciation · 3.0% rent growth · sell at horizon
- IRR
- 8.9%
- Equity multiple
- 1.35×
- Total profit
- $26,027
- Equity at exit
- $39,512
- IRR
- 18.1%
- Equity multiple
- 2.50×
- Total profit
- $111,516
- Equity at exit
- $22,912
Cash invested: $74,200 (down + closing). Projections, not guarantees.
Landlord ↔ Tenant lean methodology
- Overall (STATE)
- 62 Landlord-Friendly
- State Michigan
- 62 Landlord-Friendly · EVEN
- County
- — inherits STATE
- City
- — inherits STATE
ZIP-level market 48116
- Active inventory
- 178
- Price-to-rent
- 6.1×
Monthly cashflow live
- Estimated rent
- $3,609 medium interval (Pro) →
- Mortgage (P&I)
- −$1,390
- Tax from tax record
- −$268 /mo · $3,221/yr
- Insurance
- −$110
- HOA
- −$0
- Vacancy / Maint / Mgmt
- −$758
- Net cashflow
- $1,083
Break-even live
UW: 25.0% down · 7.5% · 30yr · 1.5% tax · 5.0% vac · 8.0% maint · 8.0% mgmt
Financing live
Cash to close
- Down payment
- $66,250
- Closing costs
- $7,950
- Reserves months
- —
- Total cash needed
- —
Loan-product check · same deal, 3 products live
Conventional
25% down · 7.5% · 30yr
- Down + closing
- —
- Monthly P&I
- —
- Monthly cashflow
- —
- DSCR
- —
- Eligible?
- —
Personal DTI + credit; lowest rate.
DSCR
20% down · 8.5% · 30yr
- Down + closing
- —
- Monthly P&I
- —
- Monthly cashflow
- —
- DSCR
- —
- Eligible?
- —
No personal income docs; deal must DSCR.
Hard money
10% down · 12.0% · 12mo
- Down + closing
- —
- Monthly P&I
- —
- Monthly cashflow
- —
- DSCR
- —
- Eligible?
- —
Short-term bridge; refi at stabilization.
Rent comps 2 comps
| Address | Beds | Baths | Sqft | Rent | $/sqft | DOM | Units | Dist |
|---|---|---|---|---|---|---|---|---|
| 700 N 2nd St Brighton, MI | 1.0–3.0 | 1.0–2.0 | 1039 | $3,335 | $3.21 | 1d | 1 | 0.81mi |
| 4229 Deeside Dr Brighton, MI | 2.0–3.0 | 2.0 | 1632 | $2,669 | $1.64 | 1d | 1 | 1.11mi |
Listing history 14 events
-
2026-06-18status $265,000 Pending 15 DOM
-
2026-06-17days on market $265,000 Active 15 DOM
-
2026-06-16days on market $265,000 Active 14 DOM
-
2026-06-16price $265,000 Active 13 DOM
-
2026-06-15days on market $290,000 Active 13 DOM
-
2026-06-13days on market $290,000 Active 11 DOM
-
2026-06-13days on market $290,000 Active 10 DOM
-
2026-06-10price $290,000 Active 7 DOM
-
2026-06-09days on market $315,000 Active 7 DOM
-
2026-06-08days on market $315,000 Active 6 DOM
-
2026-06-07pricedays on market $315,000 Active 5 DOM
-
2026-06-04days on market $329,900 Active 2 DOM
-
2026-06-02remarks 691-char remark
Show marketing remark (691 chars)
Welcome to this charming 4 bedroom home near downtown Brighton, offering a wonderful blend of historic character and functionality. Built in 1872, this home features timeless appeal with spacious living areas and a flexible floor plan, with two bedrooms on the main level and two bedrooms upstairs. The dining room adds warmth and character to the home. The main level also features a full bathroom and comfortable living spaces filled with natural light. Outside, you'll find a detached 1.5 car garage offering additional storage. Conveniently located near shopping, dining, parks, and all that Brighton has to offer, this home presents a unique opportunity to own a piece of local history.
-
2026-06-02$329,900 Active 1 DOM
Show marketing remark (691 chars)
Welcome to this charming 4 bedroom home near downtown Brighton, offering a wonderful blend of historic character and functionality. Built in 1872, this home features timeless appeal with spacious living areas and a flexible floor plan, with two bedrooms on the main level and two bedrooms upstairs. The dining room adds warmth and character to the home. The main level also features a full bathroom and comfortable living spaces filled with natural light. Outside, you'll find a detached 1.5 car garage offering additional storage. Conveniently located near shopping, dining, parks, and all that Brighton has to offer, this home presents a unique opportunity to own a piece of local history.
ⓘ Source: listings_history table (triggers on properties + properties_extension) + one-shot
backfill from property_details.listing_events for pre-trigger history.
Tax reassessment forecast MI · Partial reset (capped growth)
- Current annual tax
- $3,221 · $268/mo
- Projected year-2 tax
- $3,651 · $304/mo
- Expected delta
- +$430/yr (+$36/mo · 13.3%)
ⓘ Screening estimate from a state-policy table — verify with the county assessor before closing.
Climate risk First Street
- Flood 1/10 Low FEMA zone X (unshaded) · 0% chance over 30 yrs
- Wildfire 1/10 Low
- Heat 2/10 Low 7 d/yr ≥96°F today · 15 d/yr by 30 yrs out
- Wind 2/10 Low
- Air quality 2/10 Low 1 unhealthy d/yr today · 2 by 30 yrs out
Nearby sold comps map
Loading sold comps map…
Walkable amenities ~0.75 mi
Loading nearby amenities…
Taxation est. · year 1
- Rental income
- $43,309
- − Mortgage interest
- −$14,844
- − Property taxes
- −$3,221
- − Insurance
- −$1,325
- − Repairs & maintenance
- −$3,465
- − Management
- −$3,465
- − Depreciation
- −$7,709
- Taxable income
- $9,280
- Est. tax owed @ 24.0%
- −$2,227
- After-tax cash flow
- $10,764/yr
For passive investors: Depreciation is non-cash, so a rental often shows a tax loss while cash-flowing — sheltering income. Rental losses are passive: they offset passive income freely, and up to $25,000/yr can offset ordinary (W-2) income if you actively participate and your MAGI is under $100k (phasing out to $0 by $150k); unused losses carry forward. On sale, claimed depreciation is recaptured at up to 25%, and gains may owe capital-gains tax (a 1031 exchange can defer both). Figures are a year-1 estimate at your 24.0% rate — not tax advice; consult a CPA.
Schools (NCES district)
- District
- Brighton Area Schools
- NCES district ID
- 2606870
- Math proficiency
- 59% ▼ -3.00%
- Reading proficiency
- 69% ▼ -2.00%
- Median HH income
- $84,114
- Composite
- 57.62/100
- National rank
- #1062
- State rank
- #22 of 540 in MI
Livability — Brighton
- Score
- 78/100
- State rank
- #108
- US rank
- #2621
Category grades
Schools grade is shown separately in the Schools card above.
Census & demographics
- Census place
- Brighton, MI
- County
- Livingston County · 121,626 people
- City population
- 27,289
- Metro
- Detroit-Warren-Dearborn, MI
- Population (ZIP)
- 27,289
- Household income
- $106,763
- Rent vs Own
- Severe rent burden
- 495.0
Population outlook (Livingston County) Hauer SSP2
- Today (2025)
- 202,920 people
- By 2030
- 209,173 · +3.1%
- By 2040
- 216,878 · +6.9%
- By 2050
- 217,485 · +7.2%
- By 2075
- 217,590 · +7.2%
- By 2100
- 197,095 · -2.9%
Race, ethnicity, and origin ACS 2023
- Neighborhood character
- Predominantly White (93%)
- Race & ethnicity
- White 93% Two or more races 4% Hispanic / Latino 2% Asian 1%
- Common ancestry
- Romanian 12% Italian 6% Lithuanian 4%
- Foreign-born
- 4% · Canada, China
- Languages at home
- 96% English-only · Other Indo-European 1% German/W. Germanic 1% Russian/Polish/Slavic 1%
Political lean MEDSL · Livingston
- 2024 margin
- Strong R (+23.9) · D 37.4% · R 61.3% · Other 1.3%
- 2008→2024 swing
- -10.7pp toward R · 2008: -13.3pp · 2024: -23.9pp
- All cycles
- 2024: R+23.9 2020: R+22.6 2016: R+29.6 2012: R+23.3 2008: R+13.3
Not yet ingested
- Civics
- —
Market trends
- HPI YoY
- ▼ -300.62%
- Current HPI
- 183.6902
- Rent YoY
- —
- Metro
- Detroit-Warren-Dearborn, MI
- State GDP YoY
- ▲ 1.37%
- F500 in state
- 28
Industry mix (Fortune 500 HQ in MI)
| Industry | F500 HQs | Revenue |
|---|---|---|
| Automotive Parts | 3 | $48B |
|
||
| Automotive | 2 | $372B |
|
||
| Chemicals | 1 | $45B |
|
||
| Automotive Retail | 1 | $29B |
|
||
| Healthcare / Medical Devices | 1 | $23B |
|
||
| Automotive Technology | 1 | $20B |
|
||
Price history
+240.1% since first listed3 events — show timeline
- 2026-06-02 Listed $329,900 REALCOMP
- 2026-06-02 Listed $329,900 MiRealSource-MiMLS
- 1995-07-21 Sold (Public Records) $97,000 Public Records
Property tax history
+0.0%/yrLatest (2025): $3,221 · -5.5% YoY. Source: county tax records.
Cash-flow waterfall
monthlySold comps — $/sqft
last 12 mo · ≤1 miLoading sold comps…