 🏗️ New Construction
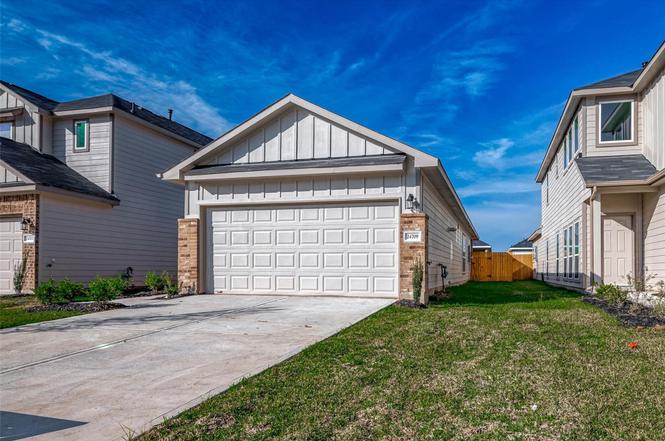
526 Emerald Thicket Ln · Houston, TX
Flood risk 6/10 · Moderate
- FEMA flood zone
- X (unshaded)
- Chance of flooding over 30 yrs
- 0.73%
- Est. flood insurance / yr
- $507 – $1,088
Fire risk 3/10 · Minor
- Est. fire insurance / yr
- $1,222 – $2,270
Heat risk 9/10 · Severe
- Hot days now (above 112°F)
- 7 days/yr
- Hot days in 30 yrs
- 24 days/yr
Wind risk 9/10 · Severe
- Chance of severe wind over 30 yrs
- 99.0%
Air-quality risk 2/10 · Minimal
- Unhealthy air days now
- 2 days/yr
- Unhealthy air days in 30 yrs
- 2 days/yr
Risk factors via First Street. Map © Google.
Why this score? — see what drove the D grade
The composite is a weighted blend of 9 inputs, each scored 0–100. Each bar is that input's sub-score; the figure is the points it added to the 100-point composite (weight × sub-score).
- Cash flow +13.9/30.0
- ARV discount +7.5/15.0
- 1% rule +4.8/10.0
- DSCR +4.2/10.0
- Livability +3.7/5.0
- Schools +3.1/10.0
- Rent growth +2.5/5.0
- Condition / age +2.5/5.0
- Appreciation +0.7/10.0
$234,990
🖨 Deal sheet 📄 Offer letter ✓ Due diligence
Listing remarks
MOVE-IN READY!! It’s in the award-winning community of Woodland Lakes - On Lake Houston with lake access! Colina Homes believes in building your dream home. This amazing Single-Story home feels much larger than it's 1267 sqft. Open concept floor plan. It has 3 bedrooms 2 Full Baths + Covered Patio included, and it will surely make you feel right at home! The beautiful Kitchen features 42” Cabinets + Luxury Granite + Decorative Tile Back splash + Stainless "Farmhouse Style" Single-Bowl Sink +Stainless Frigidaire Dishwasher, Vented Microwave & 5-BURNER GAS RANGE! Gorgeous Ceramic Plank Floors throughout all of the common areas (Entry, Kitchen, Dining, Family Room,
Key facts
- Spacious primary
- Luxury granite
- Covered patio
Tags
Neighborhood map
What this means for you Summary
Snapshot
- This is a 3-bed/2.0-bath single-family listed at $235k.
Deal economics
- At list price, monthly cash flow is $24 ($287/yr) — positive.
- To cash-flow at today's rent, offer at most $220k (6.3% below list).
- To meet the 1% rule (rent ≥ 1% of price), the offer needs to be $211k (10.2% below list).
- Recommended offer: $211k (10.2% below list) — sets the bar for 1% rule.
- Cap rate 6.4% vs local median 3.2% in Houston — top-decile yield for the area; either an underpriced asset or a hidden risk that comps aren't pricing in. Stress-test before assuming the spread holds.
Location & tenants
- Location reads 74/100 on livability (#184 in TX, #4,771 nationally) — a middle-class / working-renter tenant base. Strengths: amenities A+, cost of living A+, housing A+; Watch: crime F.
- Huffman ISD (rural): math 32% / reading 35% proficiency, ranked #500 of 826 in TX (top 60%) — families likely to look elsewhere, expect single-tenant / working-renter base with shorter leases.
- Zoned schools: Huffman Middle (math 36% / reading 32%, grade F, #892 of 1,662 statewide, top 55%, 907 students, 42% FRL); Hargrave H S (math 31% / reading 46%, grade F, #866 of 1,632 statewide, top 54%, 1,125 students, 36% FRL) — zoned schools at 39% FRL track the district average.
- Market conditions: 585 active listings in the ZIP; 5 comparable units currently listed for rent nearby; rentals lingering (median 44d on market — plan ~5-8 weeks vacancy on turnover, expect pricing pressure); 80% of comp listings sitting > 30 days — soft ceiling on asking rent; solid renter incomes; 29,883 units permitted in Harris County in 2024 (8,621 in 5+ unit buildings).
Forward outlook
- Local home prices are declining (-3.0%/yr); year-one equity from $1k of loan paydown is wiped out by about $6k of value loss. Plan a longer hold.
- Harris County population projected at +47% by 2050 — long-run rental-demand tailwind backs the buy-and-hold thesis.
Negotiation context
- Only 10 days on market — expect competitive offers; lowballing is unlikely to land.
- 10 sale attempts since 2y ago with the ask held roughly flat each time — persistent listings suggest the price (not the market) is what's stuck; bring a comps-based counter.
Risks & watch-outs
- Climate carrying-cost: major flood risk; severe wind risk, 99% chance of damaging wind over 30y; extreme-heat days projected 7→24/yr by 2055 (HVAC capex compounding) — expect insurance premiums to compound above CPI over the hold.
Questions for the listing agent
- What does the HOA fee cover, when was the last increase, and are there any pending special assessments or reserve-fund shortfalls?
- Is there a deadline driving the sale (1031 exchange, divorce, estate, relocation)? That informs how much negotiation room exists.
- Schools are D-rated, which usually means shorter tenancies and higher turnover. Who's the typical renter profile here, and what's been the actual vacancy rate?
- Crime grade is F in this area — have there been break-ins, vandalism, or insurance claims at this property in the last 3 years? What carrier currently insures it and at what premium?
- The area grade is low — what's the realistic commute time and amenity access for the typical tenant pool here? Any planned neighborhood developments (good or bad) we should know about?
- What's the average days-on-market for RENTAL listings here right now (not sales)? A rising rental-DOM trend means longer vacancies and softer asking-rent achievability than the comps imply.
- What's the recent tenant-quality profile in this submarket — average credit score on applications, eviction rate, late-payment / NSF rate, and stable-employment percentage? A property-management company in the area should have these aggregated.
- How much new for-sale + rental construction is in the pipeline within 1–3 miles? Heavy new supply typically softens prices + rents 12–24 months out; constrained supply supports both.
Investment metrics
- 1% rule
- 0.98% ✗
- Cap rate
- 6.43%
- Cash-on-cash
- 0.47%
- DSCR
- 1.02
- GRM
- 8.5
CMA / ARV
- ARV (on-the-fly)
- $215,901
- Comps found
- 12
Show comp detail 12 sales within ~0.75 mi
| Address | Dist | Beds/Ba | Sqft | Sold | Price | $/sf | Match |
|---|---|---|---|---|---|---|---|
| 526 Emerald Thicket Ln | 0.00mi | 3/2.0 | 1,267 (-6%) | 1mo | $234,990 | $185 | 90 |
| 24709 Stablewood Forest Ct | 0.12mi | 3/2.0 | 1,267 (-6%) | 2mo | $227,990 | $180 | 84 |
| 24717 Stablewood Frst | 0.12mi | 3/2.0 | 1,267 (-6%) | 3mo | $224,990 | $178 | 83 |
| 723 Pas Trl | 0.41mi | 3/2.0 | 1,365 (+2%) | 4mo | $220,000 | $161 | 74 |
| 24718 Windward Birch Way Ct | 0.31mi | 3/2.0 | 1,427 (+6%) | 5mo | $224,990 | $158 | 71 |
| 304 Emerald Thicket Ln | 0.31mi | 3/2.0 | 1,427 (+6%) | 5mo | $224,990 | $158 | 71 |
| 24318 Hard Wood Dr | 0.55mi | 3/2.0 | 1,276 (-5%) | 2mo | $190,000 | $149 | 64 |
| 218 Emerald Thicket Ln | 0.38mi | 3/2.0 | 1,490 (+11%) | 6mo | $240,990 | $162 | 59 |
| 24307 Silver Maple Dr | 0.59mi | 3/2.0 | 1,235 (-8%) | 4mo | $200,000 | $162 | 56 |
| 331 Cherry Valley Dr | 0.50mi | 3/2.0 | 1,495 (+12%) | 2mo | $185,000 | $124 | 56 |
| 24311 Silver Maple Dr | 0.58mi | 3/2.0 | 1,235 (-8%) | 5mo | $179,900 | $146 | 56 |
| 507 Corydon Dr | 0.64mi | 2/1.0 (-1) | 1,310 (-2%) | 2mo | $80,000 | $61 | 55 |
Match score weights: distance 35% · size 25% · config 20% · recency 20%. Top-matched comps best support the ARV.
Projected returns pro-forma
-3.0% appreciation · 3.0% rent growth · sell at horizon
- IRR
- -15.5%
- Equity multiple
- 0.45×
- Total profit
- $-33,336
- Equity at exit
- $32,192
- IRR
- -6.9%
- Equity multiple
- 0.56×
- Total profit
- $-26,559
- Equity at exit
- $18,667
Cash invested: $60,452 (down + closing). Projections, not guarantees.
Landlord ↔ Tenant lean methodology
- Overall (STATE)
- 87 Strongly Landlord-Friendly
- State Texas
- 87 Strongly Landlord-Friendly · R+5
- County
- — inherits STATE
- City
- — inherits STATE
ZIP-level market 77336
- Home prices YoY
- -1.8%
- Active inventory
- 585
- Price-to-rent
- 9.3×
Monthly cashflow live
- Estimated rent
- $2,111 high interval (Pro) →
- Mortgage (P&I)
- −$1,132
- Tax from tax record
- −$388 /mo · $4,660/yr
- Insurance
- −$90
- HOA
- −$33
- Vacancy / Maint / Mgmt
- −$443
- Net cashflow
- $24
Break-even live
UW: 25.0% down · 7.5% · 30yr · 1.5% tax · 5.0% vac · 8.0% maint · 8.0% mgmt
Financing live
Cash to close
- Down payment
- $53,975
- Closing costs
- $6,477
- Reserves months
- —
- Total cash needed
- —
Loan-product check · same deal, 3 products live
Conventional
25% down · 7.5% · 30yr
- Down + closing
- —
- Monthly P&I
- —
- Monthly cashflow
- —
- DSCR
- —
- Eligible?
- —
Personal DTI + credit; lowest rate.
DSCR
20% down · 8.5% · 30yr
- Down + closing
- —
- Monthly P&I
- —
- Monthly cashflow
- —
- DSCR
- —
- Eligible?
- —
No personal income docs; deal must DSCR.
Hard money
10% down · 12.0% · 12mo
- Down + closing
- —
- Monthly P&I
- —
- Monthly cashflow
- —
- DSCR
- —
- Eligible?
- —
Short-term bridge; refi at stabilization.
Rent comps 5 comps
| Address | Beds | Baths | Sqft | Rent | $/sqft | DOM | Units | Dist |
|---|---|---|---|---|---|---|---|---|
| 408 Emerald Thicket Ln Huffman, TX | 3.0 | 2.5 | 1755 | $2,200 | $1.25 | 43d | 1 | 0.16mi |
| 24523 Whitesail Dr Huffman, TX | 3.0 | 2.0 | 1512 | $1,800 | $1.19 | 43d | 1 | 0.33mi |
| 24719 Colony Meadow Trl Huffman, TX | 4.0 | 2.0 | 1613 | $2,200 | $1.36 | 43d | 1 | 0.46mi |
| 24730 Russet Bluff Trl Huffman, TX | 4.0 | 2.0 | 1604 | $2,150 | $1.34 | 1d | 1 | 0.55mi |
| 24118 Grey Fox Dr Huffman, TX | 3.0 | 2.0 | 1543 | $1,425 | $0.92 | 43d | 1 | 0.77mi |
HOA detail
- Monthly dues
- $33 · $396/yr
- Likely covers
- gas
Listing history 29 events
-
2026-02-06status Pending
-
2026-01-27$234,990 Active
-
2026-01-27historical
-
2026-01-05price $234,990
-
2025-12-17$219,990 Active
-
2025-12-17historical
-
2025-11-15price $219,990
-
2025-11-04$224,990 Active
-
2025-11-04historical
-
2025-10-24price $224,990
-
2025-09-19price $228,990
-
2025-09-12price $247,990
-
2025-09-09$250,670 Active
-
2025-09-08historical
-
2025-08-20$247,990 Active
-
2025-08-18historical
-
2025-06-19$247,990 Active
-
2025-06-18historical
-
2025-04-15$247,990 Active
-
2025-04-14historical
-
2025-03-24price $247,990
-
2025-02-26$232,990 Active
-
2025-02-24historical
-
2025-01-24price $232,990
-
2025-01-14$229,990 Active
-
2025-01-13historical
-
2024-12-18price $229,990
-
2024-12-01price $241,490
-
2024-11-20$239,490 Active
ⓘ Source: listings_history table (triggers on properties + properties_extension) + one-shot
backfill from property_details.listing_events for pre-trigger history.
Tax reassessment forecast TX · Resets to sale price
- Current annual tax
- $4,660 · $388/mo
- Projected year-2 tax
- $4,660 · $388/mo
- Expected delta
- $0/yr ($0/mo · 0.0%)
ⓘ Screening estimate from a state-policy table — verify with the county assessor before closing.
Climate risk First Street
- Flood 6/10 Major FEMA zone X (unshaded) · 73% chance over 30 yrs
- Wildfire 3/10 Moderate
- Heat 9/10 Extreme 7 d/yr ≥112°F today · 24 d/yr by 30 yrs out
- Wind 9/10 Extreme 99% chance of damaging wind over 30 yrs
- Air quality 2/10 Low 2 unhealthy d/yr today · 2 by 30 yrs out
Nearby sold comps map
Loading sold comps map…
Walkable amenities ~0.75 mi
Loading nearby amenities…
Taxation est. · year 1
- Rental income
- $25,328
- − Mortgage interest
- −$12,094
- − Property taxes
- −$4,660
- − Insurance
- −$1,080
- − Repairs & maintenance
- −$2,026
- − Management
- −$2,026
- − HOA
- −$396
- − Depreciation
- −$6,281
- Taxable loss
- −$3,235
- Est. tax savings @ 24.0%
- +$776
- After-tax cash flow
- $1,063/yr
For passive investors: Depreciation is non-cash, so a rental often shows a tax loss while cash-flowing — sheltering income. Rental losses are passive: they offset passive income freely, and up to $25,000/yr can offset ordinary (W-2) income if you actively participate and your MAGI is under $100k (phasing out to $0 by $150k); unused losses carry forward. On sale, claimed depreciation is recaptured at up to 25%, and gains may owe capital-gains tax (a 1031 exchange can defer both). Figures are a year-1 estimate at your 24.0% rate — not tax advice; consult a CPA.
Schools (NCES district)
- District
- Huffman ISD
- NCES district ID
- 4823820
- Math proficiency
- 32% ▼ -9.00%
- Reading proficiency
- 35% ▼ -9.00%
- Median HH income
- $65,848
- Composite
- 30.61/100
- National rank
- #6195
- State rank
- #500 of 826 in TX
Livability — Houston
- Score
- 74/100
- State rank
- #184
- US rank
- #4771
Category grades
Schools grade is shown separately in the Schools card above.
Census & demographics
- Census place
- Houston, TX
- County
- Harris County · 4,702,590 people
- City population
- 3,226,434
- Metro
- Houston-The Woodlands-Sugar Land, TX
- Population (ZIP)
- 14,342
- Household income
- $96,404
- Rent vs Own
- Severe rent burden
- 377.0
Population outlook (Harris County) Hauer SSP2
- Today (2025)
- 5,571,493 people
- By 2030
- 6,089,821 · +9.3%
- By 2040
- 7,142,806 · +28.2%
- By 2050
- 8,185,864 · +46.9%
- By 2075
- 10,574,329 · +89.8%
- By 2100
- 12,109,958 · +117.4%
Race, ethnicity, and origin ACS 2023
- Neighborhood character
- Majority White (65%)
- Race & ethnicity
- White 65% Hispanic / Latino 23% Two or more races 9% Black 5% Native American 4%
- Hispanic origin (detail)
- Mexican 20%
- Common ancestry
- Lithuanian 4% Slovak 2% Romanian 2%
- Foreign-born
- 9% · Canada
- Languages at home
- 79% English-only · Spanish 18% Other Indo-European 2%
Political lean MEDSL · Harris
- 2024 margin
- Lean D (+5.5) · D 52.0% · R 46.4% · Other 1.6%
- 2008→2024 swing
- +3.9pp toward D · 2008: 1.6pp · 2024: 5.5pp
- All cycles
- 2024: D+5.5 2020: D+13.3 2016: D+12.4 2012: D+0.1 2008: D+1.6
Not yet ingested
- Civics
- —
Market trends
- HPI YoY
- ▼ -8.59%
- Current HPI
- 472.03
- Rent YoY
- —
- Metro
- Houston-The Woodlands-Sugar Land, TX
- State GDP YoY
- ▲ 3.95%
- F500 in state
- 110
Industry mix (Fortune 500 HQ in TX)
| Industry | F500 HQs | Revenue |
|---|---|---|
| Energy | 16 | $1,198B |
|
||
| Technology | 5 | $198B |
|
||
| Engineering / Construction | 4 | $72B |
|
||
| Energy Services | 3 | $60B |
|
||
| Utilities | 3 | $41B |
|
||
| Healthcare | 2 | $330B |
|
||
Price history
-1.9% since first listed29 events — show timeline
- 2026-02-06 Pending — HARMLS
- 2026-01-27 Listing Removed — HARMLS
- 2026-01-27 Listed $234,990 HARMLS
- 2026-01-05 Price Changed $234,990 HARMLS
- 2025-12-17 Listing Removed — HARMLS
- 2025-12-17 Listed $219,990 HARMLS
- 2025-11-15 Price Changed $219,990 HARMLS
- 2025-11-04 Listing Removed — HARMLS
- 2025-11-04 Listed $224,990 HARMLS
- 2025-10-24 Price Changed $224,990 HARMLS
- 2025-09-19 Price Changed $228,990 HARMLS
- 2025-09-12 Price Changed $247,990 HARMLS
- 2025-09-09 Listed $250,670 HARMLS
- 2025-09-08 Listing Removed — HARMLS
- 2025-08-20 Listed $247,990 HARMLS
- 2025-08-18 Listing Removed — HARMLS
- 2025-06-19 Listed $247,990 HARMLS
- 2025-06-18 Listing Removed — HARMLS
- 2025-04-15 Listed $247,990 HARMLS
- 2025-04-14 Listing Removed — HARMLS
- 2025-03-24 Price Changed $247,990 HARMLS
- 2025-02-26 Listed $232,990 HARMLS
- 2025-02-24 Listing Removed — HARMLS
- 2025-01-24 Price Changed $232,990 HARMLS
- 2025-01-14 Listed $229,990 HARMLS
- 2025-01-13 Listing Removed — HARMLS
- 2024-12-18 Price Changed $229,990 HARMLS
- 2024-12-01 Price Changed $241,490 HARMLS
- 2024-11-20 Listed $239,490 HARMLS
Property tax history
+111.3%/yrLatest (2025): $4,660 · +394.2% YoY. Source: county tax records.
Cash-flow waterfall
monthlySold comps — $/sqft
last 12 mo · ≤1 miLoading sold comps…