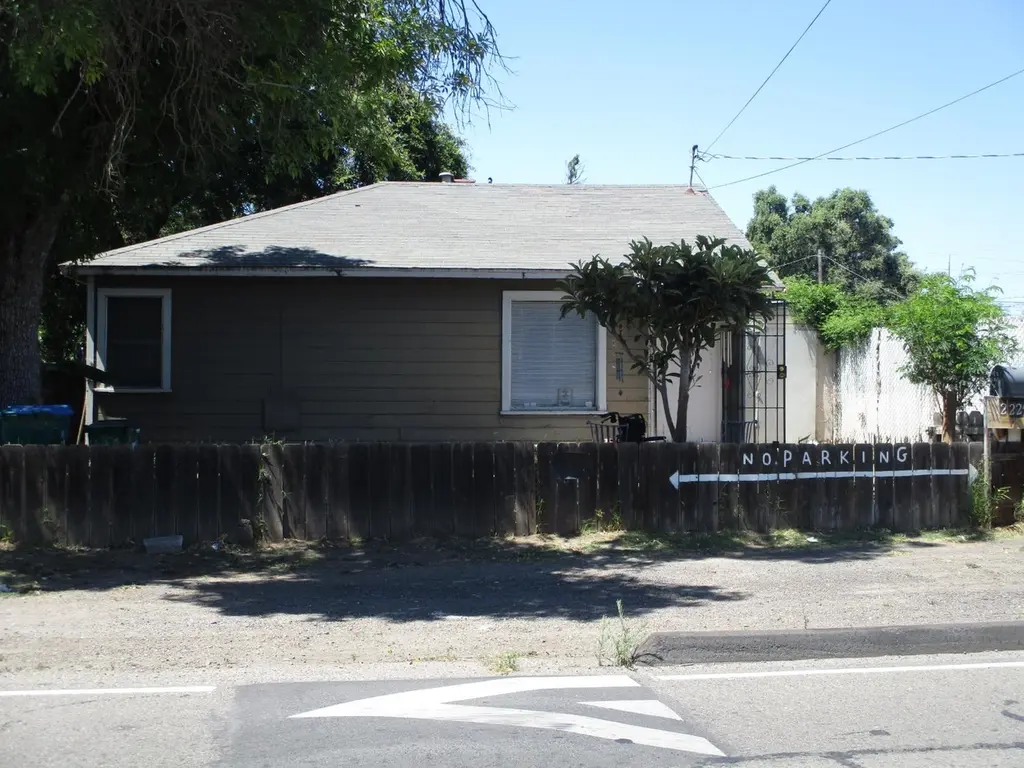
2225 E Miner Ave · Stockton, CA
Flood risk 5/10 · Moderate
- FEMA flood zone
- X
- Chance of flooding over 30 yrs
- 0.24%
- Est. flood insurance / yr
- $507 – $1,088
Fire risk 2/10 · Minimal
- Est. fire insurance / yr
- $659 – $1,223
Heat risk 7/10 · Major
- Hot days now (above 103°F)
- 7 days/yr
- Hot days in 30 yrs
- 15 days/yr
Wind risk 1/10 · Minimal
- Chance of severe wind over 30 yrs
- —
Air-quality risk 10/10 · Severe
- Unhealthy air days now
- 30 days/yr
- Unhealthy air days in 30 yrs
- 30 days/yr
Risk factors via First Street. Map © Google.
Why this score? — see what drove the C- grade
The composite is a weighted blend of 9 inputs, each scored 0–100. Each bar is that input's sub-score; the figure is the points it added to the 100-point composite (weight × sub-score).
- Cash flow +17.0/30.0
- ARV discount +15.0/15.0
- DSCR +5.3/10.0
- 1% rule +3.4/10.0
- Schools +2.9/10.0
- Livability +2.9/5.0
- Rent growth +2.5/5.0
- Condition / age +2.5/5.0
- Appreciation +0.0/10.0
$199,500
🖨 Deal sheet (PDF) 📄 Offer letter ✓ Due diligence
Listing remarks
Lots of potential here to fix up and continue use as a residence, or re-purpose as allowed by the light industrial zoning. Central heat and air, good sized laundry room, detached garage/additional space that could be re-built and set up for many different uses.
Key facts
- Central heat and air
- Detached garage
- 5,001 sq ft lot
Tags
Property features AI
Finance
- Other: Not a senior community
- HOA & community: No homeowners association
Exterior
- Parking: 1-car garage facing front; Unpaved driveway
- Utilities: Natural gas connected; Electric service (other); Public sewer; Public water; Irrigation from public district
- Home design: Detached single-family residence; Built in 1951; Fixer condition
- Construction: Composition roof
- Exterior features: Partial fencing; Regular-shaped lot
Interior
- Kitchen: Free standing gas oven; Laminate counters; Space for dining in the kitchen
- Bedrooms: 2 bedrooms (main level)
- Flooring: Carpet; Vinyl
- Bathrooms: 1 full bathroom with tub/shower combination and window
- Heating & cooling: Central heating; Central cooling
- Interior features: Free standing gas oven; Laminate counters; Inside laundry room; One-level single-story layout; Living room
- Laundry & utility: Laundry located inside; Meter on-site for water
Neighborhood map
What this means for you Summary
Snapshot
- This is a 2-bed/1.0-bath single-family listed at $200k.
Deal economics
- At list price, monthly cash flow is $136 ($2k/yr) — positive.
- The deal already cash-flows at list — no discount required.
- To meet the 1% rule (rent ≥ 1% of price), the offer needs to be $167k (16.1% below list).
- Recommended offer: $167k (16.1% below list) — sets the bar for 1% rule.
- Cap rate 7.1% vs local median 3.6% in Stockton — top-decile yield for the area; either an underpriced asset or a hidden risk that comps aren't pricing in. Stress-test before assuming the spread holds.
Location & tenants
- Location reads 57/100 on livability (#734 in CA) — a working-class tenant base; expect higher turnover. Strengths: housing A+, health & safety A, amenities A-; Watch: employment C-, crime F, commute F.
- Stockton Unified (urban): math 23% / reading 46% proficiency, ranked #295 of 517 in CA (top 57%) — families likely to look elsewhere, expect single-tenant / working-renter base with shorter leases; 78% free/reduced lunch — lower-income household profile, screen leases tightly.
- Zoned schools: King Elementary (987 students, 84% FRL); Stockton High (math 24% / reading 24%, grade F, #826 of 1,170 statewide, top 80%, 135 students, 67% FRL) — zoned schools at 76% FRL track the district average.
- Market conditions: 87 active listings in the ZIP; 4 comparable units currently listed for rent nearby; rentals at typical pace (median 26d on market — plan ~3-4 weeks tenant-placement turnaround); 3,779 units permitted in San Joaquin County in 2024 (0 in 5+ unit buildings).
- This rent runs 33% of the median local income ($60k/yr) — at the standard rent-burdened threshold; future hikes will face affordability resistance.
Forward outlook
- Local home prices are declining (-3.0%/yr); year-one equity from $1k of loan paydown is wiped out by about $6k of value loss. Plan a longer hold.
- San Joaquin County population projected at +17% by 2050 — long-run rental-demand tailwind backs the buy-and-hold thesis.
Negotiation context
- Only 12 days on market — expect competitive offers; lowballing is unlikely to land.
Risks & watch-outs
- Watch-outs: built in 1951 — expect roof / HVAC / electrical / plumbing capex.
- Climate carrying-cost: moderate flood risk; extreme-heat days projected 7→15/yr by 2055 (HVAC capex compounding) — expect insurance premiums to compound above CPI over the hold.
Questions for the listing agent
- Built in 1951 — when were the roof, HVAC, electrical panel, plumbing, and water heater last replaced?
- Is there a deadline driving the sale (1031 exchange, divorce, estate, relocation)? That informs how much negotiation room exists.
- Schools are D-rated, which usually means shorter tenancies and higher turnover. Who's the typical renter profile here, and what's been the actual vacancy rate?
- Crime grade is F in this area — have there been break-ins, vandalism, or insurance claims at this property in the last 3 years? What carrier currently insures it and at what premium?
- What's the average days-on-market for RENTAL listings here right now (not sales)? A rising rental-DOM trend means longer vacancies and softer asking-rent achievability than the comps imply.
- What's the recent tenant-quality profile in this submarket — average credit score on applications, eviction rate, late-payment / NSF rate, and stable-employment percentage? A property-management company in the area should have these aggregated.
- How much new for-sale + rental construction is in the pipeline within 1–3 miles? Heavy new supply typically softens prices + rents 12–24 months out; constrained supply supports both.
Investment metrics
- 1% rule
- 0.84% ✗
- Cap rate
- 7.11%
- Cash-on-cash
- 2.92%
- DSCR
- 1.13
- GRM
- 9.9
CMA / ARV
- ARV (on-the-fly)
- $290,936
- Comps found
- 12
Show comp detail 12 sales within ~0.75 mi
| Address | Dist | Beds/Ba | Sqft | Sold | Price | $/sf | Match |
|---|---|---|---|---|---|---|---|
| 2330 E Finland Ave | 0.15mi | 2/1.0 | 842 (-5%) | 1mo | $299,000 | $355 | 84 |
| 630 N Watts Ave | 0.27mi | 2/1.0 | 932 (+5%) | 2mo | $276,288 | $296 | 77 |
| 546 N Watts Ave | 0.23mi | 2/1.0 | 835 (-6%) | 6mo | $215,000 | $257 | 75 |
| 2125 E Myrtle St | 0.23mi | 2/1.0 | 981 (+11%) | 4mo | $205,000 | $209 | 68 |
| 1816 E Sonora St | 0.64mi | 2/1.0 | 884 (-0%) | 6mo | $290,000 | $328 | 64 |
| 2362 Alma St | 0.57mi | 2/1.0 | 816 (-8%) | 4mo | $160,000 | $196 | 57 |
| 2247 Alma St | 0.53mi | 3/1.0 (+1) | 960 (+8%) | 4mo | $300,000 | $313 | 53 |
| 520 N Golden Gate Ave | 0.69mi | 2/1.0 | 954 (+8%) | 4mo | $362,000 | $379 | 52 |
| 312 Florence St | 0.42mi | 3/1.0 (+1) | 769 (-13%) | 5mo | $345,000 | $449 | 49 |
| 1000 Beatrice Ave | 0.68mi | 2/1.0 | 1,020 (+15%) | 0mo | $233,000 | $228 | 43 |
| 511 Burkett Ave | 0.75mi | 2/1.0 | 772 (-13%) | 3mo | $365,000 | $473 | 41 |
| 2415 E Taylor St | 0.75mi | 3/1.0 (+1) | 783 (-12%) | 2mo | $365,000 | $466 | 39 |
Match score weights: distance 35% · size 25% · config 20% · recency 20%. Top-matched comps best support the ARV.
Projected returns pro-forma
-3.0% appreciation · 3.0% rent growth · sell at horizon
- IRR
- -11.8%
- Equity multiple
- 0.57×
- Total profit
- $-23,777
- Equity at exit
- $29,746
- IRR
- -2.6%
- Equity multiple
- 0.82×
- Total profit
- $-9,953
- Equity at exit
- $17,249
Cash invested: $55,860 (down + closing). Projections, not guarantees.
Landlord ↔ Tenant lean methodology
- Overall (STATE)
- 18 Strongly Tenant-Friendly
- State California
- 18 Strongly Tenant-Friendly · D+13
- County
- — inherits STATE
- City
- — inherits STATE
ZIP-level market 95205
- Active inventory
- 87
- Price-to-rent
- 9.9×
Monthly cashflow live
- Estimated rent
- $1,673 medium interval (Pro) →
- Mortgage (P&I)
- −$1,046
- Tax from tax record
- −$57 /mo · $679/yr
- Insurance
- −$83
- HOA
- −$0
- Vacancy / Maint / Mgmt
- −$351
- Net cashflow
- $136
Break-even live
Sensitivity live
| Price | -10% $249 | -5% $192 | +0% $136 | +5% $79 | +10% $23 |
|---|---|---|---|---|---|
| Rent | -10% $4 | -5% $70 | +0% $136 | +5% $202 | +10% $268 |
| Rate | -1.0pp $236 | -0.5pp $186 | base $136 | +0.5pp $84 | +1.0pp $31 |
UW: 25.0% down · 7.5% · 30yr · 1.5% tax · 5.0% vac · 8.0% maint · 8.0% mgmt
Financing live
Cash to close
- Down payment
- $49,875
- Closing costs
- $5,985
- Reserves months
- —
- Total cash needed
- —
Loan-product check · same deal, 3 products live
Conventional
25% down · 7.5% · 30yr
- Down + closing
- —
- Monthly P&I
- —
- Monthly cashflow
- —
- DSCR
- —
- Eligible?
- —
Personal DTI + credit; lowest rate.
DSCR
20% down · 8.5% · 30yr
- Down + closing
- —
- Monthly P&I
- —
- Monthly cashflow
- —
- DSCR
- —
- Eligible?
- —
No personal income docs; deal must DSCR.
Hard money
10% down · 12.0% · 12mo
- Down + closing
- —
- Monthly P&I
- —
- Monthly cashflow
- —
- DSCR
- —
- Eligible?
- —
Short-term bridge; refi at stabilization.
Rent comps 4 comps
| Address | Beds | Baths | Sqft | Rent | $/sqft | DOM | Units | Dist |
|---|---|---|---|---|---|---|---|---|
| 837 N Pilgrim St Unit 3 Stockton, CA | 1.0 | 1.0 | 588 | $1,150 | $1.96 | 25d | 1 | 0.96mi |
| 1526 N Sierra Nevada St Stockton, CA | 3.0 | 2.0 | 1024 | $2,600 | $2.54 | 25d | 1 | 1.10mi |
| 610 E Oak St Stockton, CA | 2.0 | 1.0 | 930 | $1,550 | $1.67 | 25d | 1 | 1.29mi |
| 731 N Sutter St Unit 731 Stockton, CA | 1.0 | 1.0 | 612 | $1,135 | $1.85 | 25d | 1 | 1.48mi |
Listing history 9 events
-
2026-06-16status $199,500 Pending 12 DOM
-
2026-06-15days on market $199,500 Active 12 DOM
-
2026-06-14days on market $199,500 Active 10 DOM
-
2026-06-10days on market $199,500 Active 7 DOM
-
2026-06-09days on market $199,500 Active 6 DOM
-
2026-06-08days on market $199,500 Active 5 DOM
-
2026-06-07days on market $199,500 Active 4 DOM
-
2026-06-05remarks 261-char remark
-
2026-06-05$199,500 Active 1 DOM
ⓘ Source: listings_history table (triggers on properties + properties_extension) + one-shot
backfill from property_details.listing_events for pre-trigger history.
Tax reassessment forecast CA · Resets to sale price
- Current annual tax
- $679 · $57/mo
- Projected year-2 tax
- $1,516 · $126/mo
- Expected delta
- +$838/yr (+$70/mo · 123.4%)
ⓘ Screening estimate from a state-policy table — verify with the county assessor before closing.
Climate risk First Street
- Flood 5/10 Major FEMA zone X · 24% chance over 30 yrs
- Wildfire 2/10 Low
- Heat 7/10 Severe 7 d/yr ≥103°F today · 15 d/yr by 30 yrs out
- Wind 1/10 Low
- Air quality 10/10 Extreme 30 unhealthy d/yr today · 30 by 30 yrs out
Nearby sold comps map
Loading sold comps map…
Walkable amenities ~0.75 mi
Loading nearby amenities…
Taxation est. · year 1
- Rental income
- $20,075
- − Mortgage interest
- −$11,175
- − Property taxes
- −$679
- − Insurance
- −$998
- − Repairs & maintenance
- −$1,606
- − Management
- −$1,606
- − Depreciation
- −$5,804
- Taxable loss
- −$1,792
- Est. tax savings @ 24.0%
- +$430
- After-tax cash flow
- $2,059/yr
For passive investors: Depreciation is non-cash, so a rental often shows a tax loss while cash-flowing — sheltering income. Rental losses are passive: they offset passive income freely, and up to $25,000/yr can offset ordinary (W-2) income if you actively participate and your MAGI is under $100k (phasing out to $0 by $150k); unused losses carry forward. On sale, claimed depreciation is recaptured at up to 25%, and gains may owe capital-gains tax (a 1031 exchange can defer both). Figures are a year-1 estimate at your 24.0% rate — not tax advice; consult a CPA.
Schools (NCES district)
- District
- Stockton Unified
- NCES district ID
- 0638010
- Math proficiency
- 23% ▲ 2.00%
- Reading proficiency
- 46% ▲ 16.00%
- Median HH income
- $37,563
- Composite
- 28.65/100
- National rank
- #6701
- State rank
- #295 of 517 in CA
Livability — Stockton
- Score
- 57/100
- State rank
- #734
- US rank
- #21638
Category grades
Schools grade is shown separately in the Schools card above.
Census & demographics
- Census place
- Stockton, CA
- County
- San Joaquin County · 729,570 people
- City population
- 332,006
- Metro
- Stockton, CA
- Population (ZIP)
- 39,608
- Household income
- $60,325
- Rent vs Own
- Severe rent burden
- 1712.0
Population outlook (San Joaquin County) Hauer SSP2
- Today (2025)
- 796,965 people
- By 2030
- 828,849 · +4.0%
- By 2040
- 885,611 · +11.1%
- By 2050
- 929,798 · +16.7%
- By 2075
- 994,578 · +24.8%
- By 2100
- 971,291 · +21.9%
Race, ethnicity, and origin ACS 2023
- Neighborhood character
- Predominantly Hispanic (77%)
- Race & ethnicity
- Hispanic / Latino 77% Two or more races 21% White 9% Asian 6% Black 6% Native American 2%
- Hispanic origin (detail)
- Mexican 72%
- Foreign-born
- 33% · Canada
- Languages at home
- 36% English-only · Spanish 58% Tagalog/Filipino 2% Other Indo-European 2%
Political lean MEDSL · San Joaquin
- 2024 margin
- Toss-up / Even · D 48.0% · R 48.9% · Other 3.0%
- 2008→2024 swing
- -11.6pp toward R · 2008: 10.7pp · 2024: -0.9pp
- All cycles
- 2024: R+0.9 2020: D+13.9 2016: D+12.9 2012: D+8.9 2008: D+10.7
Not yet ingested
- Civics
- —
Market trends
- HPI YoY
- ▼ -298.45%
- Current HPI
- 502.8934
- Rent YoY
- —
- Metro
- Stockton, CA
- State GDP YoY
- ▲ 3.21%
- F500 in state
- 116
Industry mix (Fortune 500 HQ in CA)
| Industry | F500 HQs | Revenue |
|---|---|---|
| Technology | 27 | $1,492B |
|
||
| Financial Services | 3 | $174B |
|
||
| Retail | 3 | $44B |
|
||
| Insurance | 3 | $26B |
|
||
| Media / Entertainment | 2 | $115B |
|
||
| Pharmaceuticals / Biotech | 2 | $62B |
|
||
Property tax history
+1.8%/yrLatest (2025): $679 · +1.7% YoY. Source: county tax records.
Cash-flow waterfall
monthlySold comps — $/sqft
last 12 mo · ≤1 miLoading sold comps…