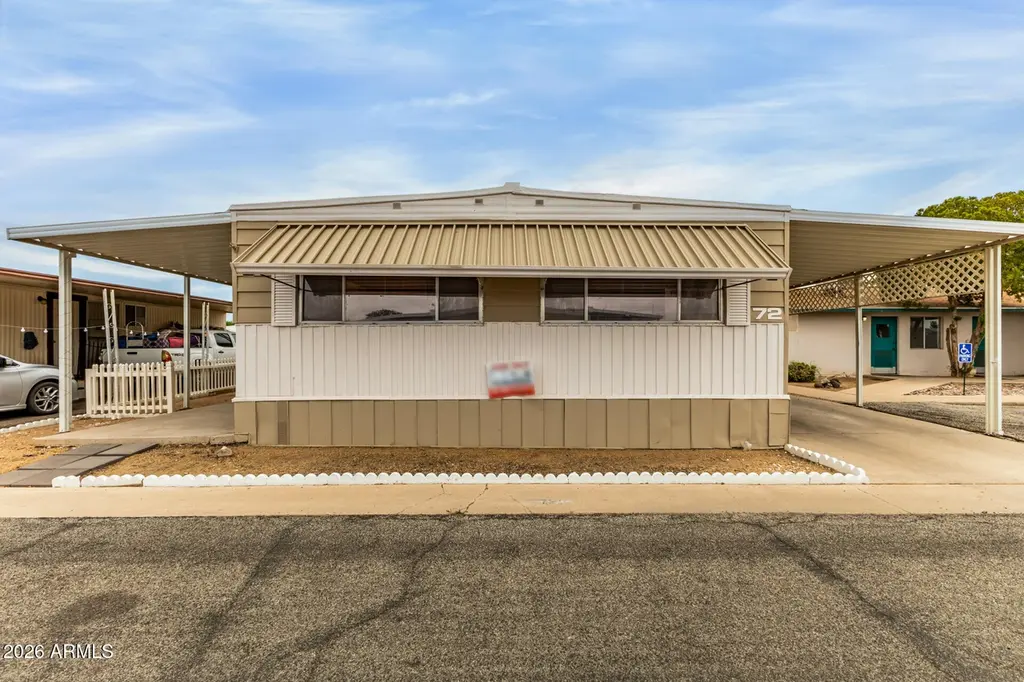
4800 W Ocotillo Rd #72 · Glendale, AZ
Flood risk 2/10 · Minimal
- FEMA flood zone
- X (shaded)
- Chance of flooding over 30 yrs
- 0.05%
- Est. flood insurance / yr
- $507 – $1,088
Fire risk 1/10 · Minimal
- Est. fire insurance / yr
- $610 – $1,132
Heat risk 8/10 · Major
- Hot days now (above 112°F)
- 5 days/yr
- Hot days in 30 yrs
- 13 days/yr
Wind risk 1/10 · Minimal
- Chance of severe wind over 30 yrs
- —
Air-quality risk 2/10 · Minimal
- Unhealthy air days now
- 0 days/yr
- Unhealthy air days in 30 yrs
- 1 days/yr
Risk factors via First Street. Map © Google.
Why this score? — see what drove the B- grade
The composite is a weighted blend of 9 inputs, each scored 0–100. Each bar is that input's sub-score; the figure is the points it added to the 100-point composite (weight × sub-score).
- Cash flow +30.0/30.0
- 1% rule +10.0/10.0
- DSCR +10.0/10.0
- ARV discount +7.5/15.0
- Condition / age +4.0/5.0
- Livability +3.8/5.0
- Schools +2.3/10.0
- Rent growth +1.8/5.0
- Appreciation +0.0/10.0
$99,000
🖨 Deal sheet 📄 Offer letter ✓ Due diligence
Listing remarks
TURNKEY and MOVE-IN READY! Discover your ideal retirement living with this DOUBLEWIDE manufactured home in the GATED, active community of Blue Sky Mobile Home Park. This charming residence offers 2 bedrooms and 2 bathrooms within a 24×63 sq. ft. layout, providing plenty of comfort and space for you to enjoy. Newly remodeled, the home is equipped with central AC, walk-in shower, and a convenient carport. As a resident, you'll enjoy amenities like a swimming pool, clubhouse, whirlpool, billiard room, laundry facilities, a fitness center, and boat/RV storage. Don't miss out on this fantastic opportunity!
Key facts
- 4 parking spots
- Community pool
- Built 1972
Property features AI
Finance
- Other: Directions: South on 47th Ave., west on Ocotillo, north into Blue Sky Mobile Park
- HOA & community: Land lease of $529 monthly; No association fees included; Community pool; Gated community; Community spa; Community laundry; Fitness center
Exterior
- Parking: 2 covered parking spaces; 2 open parking spaces; 2 carport spaces
- Utilities: City water; Public sewer
- Home design: Leasehold ownership; Manufactured/mobile housing
- Construction: Wood frame construction; Painted exterior; Foam roof
- Exterior features: Gravel/stone front; Gravel/stone back; Private maintained road; Other fencing
Interior
- Kitchen: Built-in microwave; Dishwasher
- Bedrooms: 2 possible bedrooms
- Flooring: Carpet; Laminate
- Bathrooms: 2 full bathrooms
- Heating & cooling: Natural gas heating; Has cooling
- Interior features: Eat-in kitchen; 3/4 bath in master bedroom; Wood window frames; Accessible approach with ramp; Has basement
- Laundry & utility: No dedicated laundry features listed
Neighborhood map
What this means for you Summary
Snapshot
- This is a 2-bed/2.0-bath manufactured listed at $99k. Condition is rated good.
Deal economics
- At list price, monthly cash flow is $559 ($7k/yr) — positive.
- The deal already cash-flows at list — no discount required.
- Meets the 1% rule at list price ($2k rent vs $99k).
- Recommended offer: $93k (6.0% below list) — sets the bar for market timing.
- Cap rate 13.1% vs local median 3.5% in Glendale — top-decile yield for the area; either an underpriced asset or a hidden risk that comps aren't pricing in. Stress-test before assuming the spread holds.
Location & tenants
- Location reads 76/100 on livability (#12 in AZ, #3,235 nationally) — a middle-class / working-renter tenant base. Strengths: commute A+, housing A+, amenities B; Watch: health & safety D+, crime F.
- Glendale Union High School District (4285) (urban): math 23% / reading 31% proficiency, ranked #130 of 249 in AZ (top 52%) — low school quality limits family demand, transient renter base, plan for 1-2y turnover.
- Market conditions: Rents soft (-3.0%/yr); 215 active listings in the ZIP; 39 comparable units currently listed for rent nearby; rentals leasing fast (median 2d on market — plan ~1-2 weeks tenant-placement turnaround); 36,011 units permitted in Maricopa County in 2024 (12,801 in 5+ unit buildings).
- This rent runs 35% of the median local income ($54k/yr) — at the standard rent-burdened threshold; future hikes will face affordability resistance.
Forward outlook
- Local home prices are declining (-3.0%/yr); year-one equity from $684 of loan paydown is wiped out by about $3k of value loss. Plan a longer hold.
- Maricopa County population projected at +38% by 2050 — long-run rental-demand tailwind backs the buy-and-hold thesis.
- At projected returns (-3.0% appreciation + 0.0% rent growth), your $28k cash investment doubles in ~6 years — after that, you're playing with house money.
Negotiation context
- It's been on market 73 days — a 6% lower offer ($93k) is reasonable based on typical stale-listing flexibility.
- 2 sale attempts since 5y ago with the ask held roughly flat each time — persistent listings suggest the price (not the market) is what's stuck; bring a comps-based counter.
Risks & watch-outs
- Climate carrying-cost: extreme-heat days projected 5→13/yr by 2055 (HVAC capex compounding) — expect insurance premiums to compound above CPI over the hold.
Questions for the listing agent
- It's been on market 73 days. Have you received any prior offers? Is the seller open to a 6% concession, seller financing, or rate buy-down credit?
- Built in 1972 — when were the roof, HVAC, electrical panel, plumbing, and water heater last replaced?
- Why hasn't it sold? Are there any deal-killer items the seller is aware of (foundation, flood, title, zoning, code violations)?
- Is there a deadline driving the sale (1031 exchange, divorce, estate, relocation)? That informs how much negotiation room exists.
- Crime grade is F in this area — have there been break-ins, vandalism, or insurance claims at this property in the last 3 years? What carrier currently insures it and at what premium?
- What's the average days-on-market for RENTAL listings here right now (not sales)? A rising rental-DOM trend means longer vacancies and softer asking-rent achievability than the comps imply.
- What's the recent tenant-quality profile in this submarket — average credit score on applications, eviction rate, late-payment / NSF rate, and stable-employment percentage? A property-management company in the area should have these aggregated.
- How much new for-sale + rental construction is in the pipeline within 1–3 miles? Heavy new supply typically softens prices + rents 12–24 months out; constrained supply supports both.
Investment metrics
- 1% rule
- 1.59% ✓
- Cap rate
- 13.07%
- Cash-on-cash
- 24.22%
- DSCR
- 2.08
- GRM
- 5.2
CMA / ARV
- ARV (on-the-fly)
- $55,944
- Comps found
- 3
Show comp detail 3 sales within ~0.75 mi
| Address | Dist | Beds/Ba | Sqft | Sold | Price | $/sf | Match |
|---|---|---|---|---|---|---|---|
| 4800 W Ocotillo Rd #68 | 0.00mi | 2/2.0 | 1,440 (-5%) | 1mo | $37,000 | $26 | 92 |
| 4800 W Ocotillo Rd #159 | 0.05mi | 2/2.0 | 1,568 (+4%) | 15mo | $57,700 | $37 | 79 |
| 7200 N 43rd Ave #82 | 0.73mi | 2/2.0 | 1,300 (-14%) | 7mo | $52,000 | $40 | 36 |
Match score weights: distance 35% · size 25% · config 20% · recency 20%. Top-matched comps best support the ARV.
Projected returns pro-forma
-3.0% appreciation · 0.0% rent growth · sell at horizon
- IRR
- 14.1%
- Equity multiple
- 1.54×
- Total profit
- $14,999
- Equity at exit
- $14,761
- IRR
- 20.4%
- Equity multiple
- 2.49×
- Total profit
- $41,210
- Equity at exit
- $8,560
Cash invested: $27,720 (down + closing). Projections, not guarantees.
Landlord ↔ Tenant lean methodology
- Overall (STATE)
- 87 Strongly Landlord-Friendly
- State Arizona
- 87 Strongly Landlord-Friendly · R+3
- County
- — inherits STATE
- City
- — inherits STATE
ZIP-level market 85301
- Home prices YoY
- -10.6%
- Rents YoY
- -3.0%
- Active inventory
- 215
- Price-to-rent
- 5.2×
Monthly cashflow live
- Estimated rent
- $1,574 high interval (Pro) →
- Mortgage (P&I)
- −$519
- Tax est. 1.5%
- −$124 /mo · $1,485/yr
- Insurance
- −$41
- HOA
- −$0
- Vacancy / Maint / Mgmt
- −$331
- Net cashflow
- $559
Break-even live
UW: 25.0% down · 7.5% · 30yr · 1.5% tax · 5.0% vac · 8.0% maint · 8.0% mgmt
Financing live
Cash to close
- Down payment
- $24,750
- Closing costs
- $2,970
- Reserves months
- —
- Total cash needed
- —
Loan-product check · same deal, 3 products live
Conventional
25% down · 7.5% · 30yr
- Down + closing
- —
- Monthly P&I
- —
- Monthly cashflow
- —
- DSCR
- —
- Eligible?
- —
Personal DTI + credit; lowest rate.
DSCR
20% down · 8.5% · 30yr
- Down + closing
- —
- Monthly P&I
- —
- Monthly cashflow
- —
- DSCR
- —
- Eligible?
- —
No personal income docs; deal must DSCR.
Hard money
10% down · 12.0% · 12mo
- Down + closing
- —
- Monthly P&I
- —
- Monthly cashflow
- —
- DSCR
- —
- Eligible?
- —
Short-term bridge; refi at stabilization.
Rent comps 39 comps
| Address | Beds | Baths | Sqft | Rent | $/sqft | DOM | Units | Dist |
|---|---|---|---|---|---|---|---|---|
| 5024 W Krall St Glendale, AZ | 3.0 | 2.0 | 1196 | $1,749 | $1.46 | 1d | 1 | 0.26mi |
| 6551 N 49th Ave Glendale, AZ | 2.0–3.0 | 2.0 | 1165 | $1,875 | $1.61 | 1d | 6 | 0.27mi |
| 5012 W McLellan Rd Glendale, AZ | 3.0 | 2.0 | 1058 | $1,595 | $1.51 | 18d | 1 | 0.30mi |
| 5046 W Tuckey Ln Glendale, AZ | 3.0 | 2.0 | 1321 | $1,400 | $1.06 | 17d | 1 | 0.34mi |
| 4911 W Myrtle Ave Glendale, AZ | 2.0 | 2.0 | 1360 | $1,925 | $1.42 | 1d | 3 | 0.35mi |
| 5047 W Tuckey Ln Glendale, AZ | 3.0 | 2.0 | 1396 | $1,765 | $1.26 | 1d | 1 | 0.35mi |
| 4608 W Maryland Ave Glendale, AZ | 2.0–3.0 | 2.0 | 1141 | $1,300 | $1.14 | 3d | 4 | 0.41mi |
| 4608 W Maryland Ave Glendale, AZ | 2.0–3.0 | 2.0 | 1141 | $1,400 | $1.23 | 1d | 4 | 0.41mi |
| 4608 W Maryland Ave Glendale, AZ | 3.0 | 2.0 | 1215 | $1,598 | $1.31 | 2d | 3 | 0.41mi |
| 4776 W Via Cynthia Glendale, AZ | 3.0 | 2.0 | 1484 | $2,000 | $1.35 | 1d | 1 | 0.42mi |
| 4562 W Maryland Ave Glendale, AZ | 3.0 | 2.0 | 1230 | $1,798 | $1.46 | 20d | 1 | 0.42mi |
| 5044 W Maryland Ave Glendale, AZ | 3.0 | 1.0 | 1065 | $1,295 | $1.22 | 3d | 1 | 0.43mi |
| 5136 W Glenn Dr Glendale, AZ | 2.0–3.0 | 1.5 | 1090 | $1,475 | $1.35 | 1d | 5 | 0.53mi |
| 4443 W Palmaire Ave Glendale, AZ | 2.0–3.0 | 2.0 | 987 | $1,595 | $1.62 | 1d | 1 | 0.57mi |
| 4439 W Palmaire Ave Unit 236 Glendale, AZ | 3.0 | 2.0 | 1101 | $1,695 | $1.54 | 24d | 1 | 0.57mi |
| 4828 W Orangewood Ave Glendale, AZ | 3.0 | 2.5 | 1168 | $1,375 | $1.18 | 15d | 1 | 0.74mi |
| 4127 W Solar Dr Phoenix, AZ | 3.0 | 2.0 | 1097 | $1,749 | $1.59 | 1d | 1 | 0.88mi |
| 4213 W Northview Ave Phoenix, AZ | 3.0 | 2.0 | 1413 | $1,860 | $1.32 | 1d | 1 | 0.93mi |
| 7229 N 41st Dr Phoenix, AZ | 3.0 | 2.0 | 1500 | $1,999 | $1.33 | 3d | 1 | 1.01mi |
| 4102 W Rose Ln Phoenix, AZ | 3.0 | 2.0 | 1889 | $2,200 | $1.16 | 1d | 1 | 1.07mi |
| 5720 N 48th Ln Glendale, AZ | 3.0 | 2.0 | 1986 | $1,815 | $0.91 | 1d | 1 | 1.07mi |
| 3936 W Solar Dr Phoenix, AZ | 3.0 | 2.0 | 1460 | $2,000 | $1.37 | 1d | 1 | 1.10mi |
| 7959 N 53rd Ave Glendale, AZ | 3.0 | 2.5 | 1414 | $2,500 | $1.77 | 1d | 4 | 1.11mi |
| 7801 N 44th Dr #1075 Glendale, AZ | 2.0 | 2.5 | 1080 | $1,595 | $1.48 | 12d | 1 | 1.11mi |
| 7801 N 44th Dr #1075 Glendale, AZ | 2.0 | 2.5 | 1080 | $1,595 | $1.48 | 15d | 1 | 1.11mi |
| 7801 N 44th Dr Glendale, AZ | 2.0 | 3.0 | 1080 | $1,595 | $1.48 | 12d | 1 | 1.12mi |
| 7801 N 44th Dr Glendale, AZ | 2.0 | 2.5 | 1080 | $1,395 | $1.29 | 2d | 1 | 1.12mi |
| 5547 W Gardenia Ave Glendale, AZ | 3.0 | 1.0 | 1084 | $1,329 | $1.23 | 22d | 1 | 1.12mi |
| 7801 N 44th Dr #1030 Glendale, AZ | 3.0 | 2.5 | 1386 | $1,695 | $1.22 | 8d | 1 | 1.15mi |
| 7801 N 44th Dr #1030 Glendale, AZ | 3.0 | 2.5 | 1386 | $1,695 | $1.22 | 1d | 1 | 1.15mi |
| 7801 N 44th Dr #1028 Glendale, AZ | 2.0 | 2.5 | 1080 | $1,395 | $1.29 | 4d | 1 | 1.15mi |
| 7801 N 44th Dr #1028 Glendale, AZ | 2.0 | 2.5 | 1080 | $1,395 | $1.29 | 2d | 1 | 1.15mi |
| 5710 N 43rd Dr Glendale, AZ | 3.0 | 2.5 | 1296 | $1,900 | $1.47 | 1d | 1 | 1.22mi |
| 4021 W Berridge Ln Phoenix, AZ | 3.0 | 2.0 | 1522 | $1,545 | $1.02 | 1d | 1 | 1.24mi |
| 4730 W Northern Ave Glendale, AZ | 1.0–2.0 | 1.0–2.0 | 841 | $1,200 | $1.43 | 24d | 2 | 1.26mi |
| 6231 N 59th Ave Unit 51 Glendale, AZ | 2.0 | 2.0 | 1152 | $1,200 | $1.04 | 1d | 1 | 1.38mi |
| 3825 W Orangewood Ave Phoenix, AZ | 3.0 | 2.0 | 1363 | $2,500 | $1.83 | 1d | 1 | 1.39mi |
| 5908 W Myrtle Ave Unit 5908 Glendale, AZ | 3.0 | 2.0 | 1053 | $1,375 | $1.31 | 1d | 1 | 1.43mi |
| 4330 W Royal Palm Rd Glendale, AZ | 3.0 | 2.0 | 1674 | $2,200 | $1.31 | 1d | 1 | 1.45mi |
Listing history 17 events
-
2026-06-18days on market $99,000 Active 73 DOM
-
2026-06-17days on market $99,000 Active 72 DOM
-
2026-06-16days on market $99,000 Active 71 DOM
-
2026-06-15days on market $99,000 Active 70 DOM
-
2026-06-13days on market $99,000 Active 68 DOM
-
2026-06-13days on market $99,000 Active 67 DOM
-
2026-06-09days on market $99,000 Active 64 DOM
-
2026-06-08days on market $99,000 Active 63 DOM
-
2026-06-07days on market $99,000 Active 62 DOM
-
2026-06-04days on market $99,000 Active 59 DOM
-
2026-06-03days on market $99,000 Active 58 DOM
-
2026-06-02days on market $99,000 Active 57 DOM
-
2026-06-01days on market $99,000 Active 56 DOM
-
2026-05-31days on market $99,000 Active 55 DOM
-
2026-04-06$99,000 Active
-
2021-08-06historical
-
2021-07-27$57,500 Active
ⓘ Source: listings_history table (triggers on properties + properties_extension) + one-shot
backfill from property_details.listing_events for pre-trigger history.
Climate risk First Street
- Flood 2/10 Low FEMA zone X (shaded) · 5% chance over 30 yrs
- Wildfire 1/10 Low
- Heat 8/10 Severe 5 d/yr ≥112°F today · 13 d/yr by 30 yrs out
- Wind 1/10 Low
- Air quality 2/10 Low 0 unhealthy d/yr today · 1 by 30 yrs out
Nearby sold comps map
Loading sold comps map…
Walkable amenities ~0.75 mi
Loading nearby amenities…
Taxation est. · year 1
- Rental income
- $18,890
- − Mortgage interest
- −$5,546
- − Property taxes
- −$1,485
- − Insurance
- −$495
- − Repairs & maintenance
- −$1,511
- − Management
- −$1,511
- − Depreciation
- −$2,880
- Taxable income
- $5,462
- Est. tax owed @ 24.0%
- −$1,311
- After-tax cash flow
- $5,402/yr
For passive investors: Depreciation is non-cash, so a rental often shows a tax loss while cash-flowing — sheltering income. Rental losses are passive: they offset passive income freely, and up to $25,000/yr can offset ordinary (W-2) income if you actively participate and your MAGI is under $100k (phasing out to $0 by $150k); unused losses carry forward. On sale, claimed depreciation is recaptured at up to 25%, and gains may owe capital-gains tax (a 1031 exchange can defer both). Figures are a year-1 estimate at your 24.0% rate — not tax advice; consult a CPA.
Condition & rehab AI · 12 photos
This turnkey and move-in ready manufactured home in Blue Sky Mobile Home Park is in good condition with a fresh paint job and minimal maintenance required. It offers a great opportunity for investors looking to increase its value through minor upgrades and improvements.
Value-add opportunities
- Both Painting exterior and interior walls — Fresh paint can enhance curb appeal and interior aesthetics.
- Both Landscaping improvements — Enhanced landscaping can improve curb appeal and attract potential buyers/tenants.
- Both Upgrading light fixtures — Modern light fixtures can improve the home's curb appeal and functionality.
- Both Adding smart home features — Smart home features can increase the home's value and appeal to tech-savvy buyers/tenants.
- Both Upgrading appliances — Upgrading appliances can make the home more appealing and functional for potential buyers/tenants.
Renovation cost estimate screening
Value-add ROI direction
- Both Painting exterior and interior walls — Fresh paint can enhance curb appeal and interior aesthetics. ↑
- Both Landscaping improvements — Enhanced landscaping can improve curb appeal and attract potential buyers/tenants. ↑
- Both Upgrading light fixtures — Modern light fixtures can improve the home's curb appeal and functionality. ↑
- Both Adding smart home features — Smart home features can increase the home's value and appeal to tech-savvy buyers/tenants. ↑
- Both Upgrading appliances — Upgrading appliances can make the home more appealing and functional for potential buyers/tenants. ↑
ⓘ Cost ranges are severity-bucket heuristics (US national rule-of-thumb). Get contractor quotes + a written scope before underwriting a rehab budget.
Schools (NCES district)
- District
- Glendale Union High School District (4285)
- NCES district ID
- 0403450
- Math proficiency
- 23% ▼ -38.00%
- Reading proficiency
- 31% ▼ -19.00%
- Median HH income
- $40,846
- Composite
- 22.81/100
- National rank
- #8020
- State rank
- #130 of 249 in AZ
Livability — Glendale
- Score
- 76/100
- State rank
- #12
- US rank
- #3235
Category grades
Schools grade is shown separately in the Schools card above.
Census & demographics
- Census place
- Glendale, AZ
- County
- Maricopa County · 4,537,380 people
- City population
- 294,586
- Metro
- Phoenix-Mesa-Chandler, AZ
- Population (ZIP)
- 68,178
- Household income
- $53,827
- Rent vs Own
- Severe rent burden
- 3741.0
Population outlook (Maricopa County) Hauer SSP2
- Today (2025)
- 4,979,203 people
- By 2030
- 5,378,229 · +8.0%
- By 2040
- 6,156,598 · +23.6%
- By 2050
- 6,872,376 · +38.0%
- By 2075
- 8,401,270 · +68.7%
- By 2100
- 9,247,439 · +85.7%
Race, ethnicity, and origin ACS 2023
- Neighborhood character
- Majority Hispanic (63%)
- Race & ethnicity
- Hispanic / Latino 63% Two or more races 37% White 22% Black 8% Asian 2% Native American 2%
- Hispanic origin (detail)
- Mexican 57% Cuban 1%
- Common ancestry
- Slovak 1% Italian 1%
- Foreign-born
- 26% · Canada, Vietnam, Philippines
- Languages at home
- 46% English-only · Spanish 48% Arabic 1% Other Indo-European 1%
Political lean MEDSL · Maricopa
- 2024 margin
- Toss-up / Even · D 47.7% · R 51.2% · Other 1.1%
- 2008→2024 swing
- +7.1pp toward D · 2008: -10.6pp · 2024: -3.5pp
- All cycles
- 2024: R+3.5 2020: D+2.2 2016: R+3.5 2012: R+12.0 2008: R+10.6
Not yet ingested
- Civics
- —
Market trends
- HPI YoY
- ▼ -50.49%
- Current HPI
- 427.3069
- Rent YoY
- ▼ -2.98%
- Metro
- Phoenix-Mesa-Chandler, AZ
- State GDP YoY
- ▲ 4.54%
- F500 in state
- 20
Industry mix (Fortune 500 HQ in AZ)
| Industry | F500 HQs | Revenue |
|---|---|---|
| Technology | 2 | $13B |
|
||
| Mining / Metals | 1 | $23B |
|
||
| Environmental Services | 1 | $16B |
|
||
| Metals / Steel | 1 | $14B |
|
||
| Technology Distribution | 1 | $9B |
|
||
| Homebuilding | 1 | $8B |
|
||
Price history
+72.2% since first listed3 events — show timeline
- 2026-04-06 Listed $99,000 ARMLS
- 2021-08-06 Listing Removed — ARMLS
- 2021-07-27 Listed $57,500 ARMLS
Cash-flow waterfall
monthlySold comps — $/sqft
last 12 mo · ≤1 miLoading sold comps…