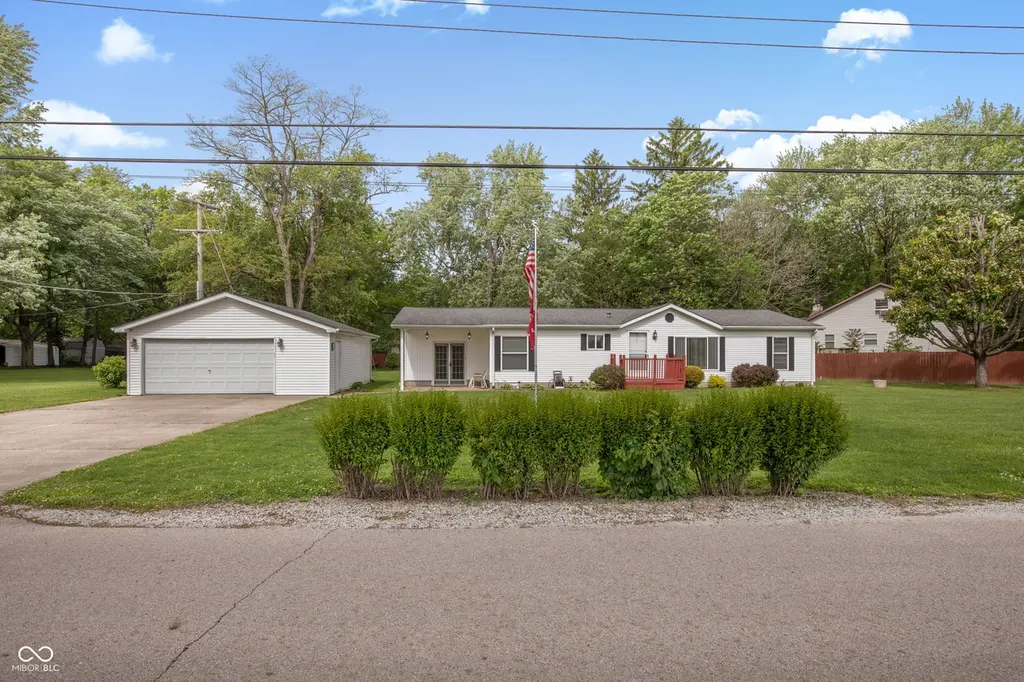
513 S 300 E · Anderson, IN
Flood risk 1/10 · Minimal
- FEMA flood zone
- X (unshaded)
- Chance of flooding over 30 yrs
- 0.0%
- Est. flood insurance / yr
- $507 – $1,088
Fire risk 1/10 · Minimal
- Est. fire insurance / yr
- $717 – $1,331
Heat risk 3/10 · Minor
- Hot days now (above 100°F)
- 7 days/yr
- Hot days in 30 yrs
- 18 days/yr
Wind risk 2/10 · Minimal
- Chance of severe wind over 30 yrs
- 1.0%
Air-quality risk 2/10 · Minimal
- Unhealthy air days now
- 1 days/yr
- Unhealthy air days in 30 yrs
- 2 days/yr
Risk factors via First Street. Map © Google.
Why this score? — see what drove the D+ grade
The composite is a weighted blend of 9 inputs, each scored 0–100. Each bar is that input's sub-score; the figure is the points it added to the 100-point composite (weight × sub-score).
- Cash flow +16.4/30.0
- ARV discount +7.5/15.0
- Appreciation +7.3/10.0
- DSCR +5.1/10.0
- 1% rule +3.2/10.0
- Livability +3.0/5.0
- Rent growth +2.5/5.0
- Condition / age +2.5/5.0
- Schools +1.6/10.0
$184,900
🖨 Deal sheet 📄 Offer letter ✓ Due diligence
Listing remarks
Tucked away in a peaceful natural setting in Anderson, this beautifully maintained manufactured home combines comfort, charm, and scenic surroundings on approximately half an acre. Offering 3 bedrooms and 2 full bathrooms, the home features vaulted ceilings that enhance the spacious and airy feel of the main living areas. A standout feature of the home is the expansive four-season room with double doors and tranquil views of nature. It's the perfect space to enjoy morning coffee, relax after a long day, or take in the beauty of every season from the comfort of indoors. Conveniently located within walking distance of Mounds State Park, this property provides the ideal balance of peaceful liv
Key facts
- Four-season room
- 0.49 acre lot
- 2 garage spots
Tags
Property features AI
Exterior
- Parking: Detached 2-car garage (676 sq ft)
- Security: Smoke detector(s)
- Utilities: Private water source; Septic system; No municipal solid waste information listed
- Home design: Manufactured home; One level; Faces east; Has additional parcels
- Construction: Vinyl siding; Crawl space foundation
- Exterior features: Approximately 0.49-acre lot; Not in a subdivision; Mature trees; Covered porch; Storage; Fire pit; No fence
Interior
- Kitchen: Gas oven; Refrigerator; Eat-in layout
- Bedrooms: Three main-level bedrooms; Primary bedroom with walk-in closet
- Bathrooms: Two full bathrooms; Primary bath with garden tub and full shower stall
- Heating & cooling: Forced air heating; Central air conditioning
- Interior features: Eat-in kitchen; Walk-in closet(s); Covered porch; Fire pit; Storage; Smoke detector(s)
- Laundry & utility: Main-level laundry room; Washer; Dryer; Water heater
Neighborhood map
What this means for you Summary
Snapshot
- This is a 3-bed/2.0-bath manufactured listed at $185k.
Deal economics
- At list price, monthly cash flow is $105 ($1k/yr) — positive.
- The deal already cash-flows at list — no discount required.
- To meet the 1% rule (rent ≥ 1% of price), the offer needs to be $152k (17.7% below list).
- Recommended offer: $152k (17.7% below list) — sets the bar for 1% rule.
Location & tenants
- Location reads 60/100 on livability (#521 in IN) — a middle-class / working-renter tenant base. Strengths: cost of living A+, housing A+; Watch: crime D-, amenities F, commute F.
- Anderson Community School Corporation (urban): math 15% / reading 23% proficiency, ranked #280 of 301 in IN (top 93%) — low school quality limits family demand, transient renter base, plan for 1-2y turnover; 70% free/reduced lunch — lower-income household profile, screen leases tightly.
- Zoned schools: Valley Grove Elementary School (math 22% / reading 12%, grade F, #837 of 994 statewide, top 86%, 372 students, 86% FRL); Anderson High School (math 21% / reading 51%, grade F, #261 of 369 statewide, top 71%, 1,790 students, 76% FRL).
- Market conditions: 29 active listings in the ZIP; 184 units permitted in Madison County in 2024 (0 in 5+ unit buildings).
Forward outlook
- In year one you build about $10k of equity ($1k loan paydown + $9k appreciation (4.6% local appreciation)).
- Madison County population projected at -14% by 2050 — secular population decline; favor cash flow + early exit over multi-decade hold.
- At projected returns (4.6% appreciation + 3.0% rent growth), your $52k cash investment doubles in ~5 years — after that, you're playing with house money.
- By year 4, paydown + projected appreciation supports a ~$33k cash-out refi (75% LTV) — recoverable capital for the next deal without selling this one.
Negotiation context
- Only 4 days on market — expect competitive offers; lowballing is unlikely to land.
Questions for the listing agent
- Is there a deadline driving the sale (1031 exchange, divorce, estate, relocation)? That informs how much negotiation room exists.
- Schools are F-rated, which usually means shorter tenancies and higher turnover. Who's the typical renter profile here, and what's been the actual vacancy rate?
- Crime grade is D in this area — have there been break-ins, vandalism, or insurance claims at this property in the last 3 years? What carrier currently insures it and at what premium?
- The area grade is low — what's the realistic commute time and amenity access for the typical tenant pool here? Any planned neighborhood developments (good or bad) we should know about?
- What's the average days-on-market for RENTAL listings here right now (not sales)? A rising rental-DOM trend means longer vacancies and softer asking-rent achievability than the comps imply.
- What's the recent tenant-quality profile in this submarket — average credit score on applications, eviction rate, late-payment / NSF rate, and stable-employment percentage? A property-management company in the area should have these aggregated.
- How much new for-sale + rental construction is in the pipeline within 1–3 miles? Heavy new supply typically softens prices + rents 12–24 months out; constrained supply supports both.
Investment metrics
- 1% rule
- 0.82% ✗
- Cap rate
- 6.98%
- Cash-on-cash
- 2.44%
- DSCR
- 1.11
- GRM
- 10.1
CMA / ARV
No comps found within radius.
Projected returns pro-forma
4.62% appreciation · 3.0% rent growth · sell at horizon
- IRR
- 14.0%
- Equity multiple
- 1.87×
- Total profit
- $45,232
- Equity at exit
- $100,534
- IRR
- 14.9%
- Equity multiple
- 3.56×
- Total profit
- $132,787
- Equity at exit
- $170,096
Cash invested: $51,772 (down + closing). Projections, not guarantees.
Landlord ↔ Tenant lean methodology
- Overall (STATE)
- 90 Strongly Landlord-Friendly
- State Indiana
- 90 Strongly Landlord-Friendly · R+11
- County
- — inherits STATE
- City
- — inherits STATE
ZIP-level market 46017
- Home prices YoY
- 1.5%
- Active inventory
- 29
- Price-to-rent
- 10.1×
Monthly cashflow live
- Estimated rent
- $1,521 medium interval (Pro) →
- Mortgage (P&I)
- −$970
- Tax from tax record
- −$50 /mo · $597/yr
- Insurance
- −$77
- HOA
- −$0
- Vacancy / Maint / Mgmt
- −$319
- Net cashflow
- $105
Break-even live
UW: 25.0% down · 7.5% · 30yr · 1.5% tax · 5.0% vac · 8.0% maint · 8.0% mgmt
Financing live
Cash to close
- Down payment
- $46,225
- Closing costs
- $5,547
- Reserves months
- —
- Total cash needed
- —
Loan-product check · same deal, 3 products live
Conventional
25% down · 7.5% · 30yr
- Down + closing
- —
- Monthly P&I
- —
- Monthly cashflow
- —
- DSCR
- —
- Eligible?
- —
Personal DTI + credit; lowest rate.
DSCR
20% down · 8.5% · 30yr
- Down + closing
- —
- Monthly P&I
- —
- Monthly cashflow
- —
- DSCR
- —
- Eligible?
- —
No personal income docs; deal must DSCR.
Hard money
10% down · 12.0% · 12mo
- Down + closing
- —
- Monthly P&I
- —
- Monthly cashflow
- —
- DSCR
- —
- Eligible?
- —
Short-term bridge; refi at stabilization.
Listing history 4 events
-
2026-06-02status $184,900 Pending 4 DOM
-
2026-06-01days on market $184,900 Active 4 DOM
-
2026-05-31days on market $184,900 Active 3 DOM
-
2026-05-28$184,900 Active
ⓘ Source: listings_history table (triggers on properties + properties_extension) + one-shot
backfill from property_details.listing_events for pre-trigger history.
Tax reassessment forecast IN · Partial reset (capped growth)
- Current annual tax
- $597 · $50/mo
- Projected year-2 tax
- $1,085 · $90/mo
- Expected delta
- +$487/yr (+$41/mo · 81.5%)
ⓘ Screening estimate from a state-policy table — verify with the county assessor before closing.
Climate risk First Street
- Flood 1/10 Low FEMA zone X (unshaded) · 0% chance over 30 yrs
- Wildfire 1/10 Low
- Heat 3/10 Moderate 7 d/yr ≥100°F today · 18 d/yr by 30 yrs out
- Wind 2/10 Low 100% chance of damaging wind over 30 yrs
- Air quality 2/10 Low 1 unhealthy d/yr today · 2 by 30 yrs out
Nearby sold comps map
Loading sold comps map…
Walkable amenities ~0.75 mi
Loading nearby amenities…
Taxation est. · year 1
- Rental income
- $18,252
- − Mortgage interest
- −$10,357
- − Property taxes
- −$597
- − Insurance
- −$924
- − Repairs & maintenance
- −$1,460
- − Management
- −$1,460
- − Depreciation
- −$5,379
- Taxable loss
- −$1,927
- Est. tax savings @ 24.0%
- +$462
- After-tax cash flow
- $1,724/yr
For passive investors: Depreciation is non-cash, so a rental often shows a tax loss while cash-flowing — sheltering income. Rental losses are passive: they offset passive income freely, and up to $25,000/yr can offset ordinary (W-2) income if you actively participate and your MAGI is under $100k (phasing out to $0 by $150k); unused losses carry forward. On sale, claimed depreciation is recaptured at up to 25%, and gains may owe capital-gains tax (a 1031 exchange can defer both). Figures are a year-1 estimate at your 24.0% rate — not tax advice; consult a CPA.
Schools (NCES district)
- District
- Anderson Community School Corporation
- NCES district ID
- 1800150
- Math proficiency
- 15% ▼ -14.00%
- Reading proficiency
- 23% ▼ -7.00%
- Median HH income
- $38,208
- Composite
- 15.93/100
- National rank
- #9250
- State rank
- #280 of 301 in IN
Livability — Anderson
- Score
- 60/100
- State rank
- #521
- US rank
- #18709
Category grades
Schools grade is shown separately in the Schools card above.
Census & demographics
- City population
- 57,762
- Population (ZIP)
- 5,421
Population outlook (Madison County) Hauer SSP2
- Today (2025)
- 125,800 people
- By 2030
- 122,640 · -2.5%
- By 2040
- 115,420 · -8.3%
- By 2050
- 108,148 · -14.0%
- By 2075
- 91,838 · -27.0%
- By 2100
- 75,670 · -39.8%
Race, ethnicity, and origin ACS 2023
- Neighborhood character
- Predominantly White (86%)
- Race & ethnicity
- White 86% Two or more races 7% Hispanic / Latino 6% Asian 1% Black 1%
- Hispanic origin (detail)
- Mexican 3% Puerto Rican 2%
- Common ancestry
- Slovak 2% Italian 2% Lithuanian 1%
- Foreign-born
- 2% · China, Canada, Vietnam
- Languages at home
- 97% English-only · Spanish 2% Other Asian/Pacific 1%
Political lean MEDSL · Madison
- 2024 margin
- Strong R (+26.9) · D 35.6% · R 62.5% · Other 1.9%
- 2008→2024 swing
- -33.5pp toward R · 2008: 6.5pp · 2024: -26.9pp
- All cycles
- 2024: R+26.9 2020: R+22.6 2016: R+25.7 2012: R+4.5 2008: D+6.5
Not yet ingested
- Civics
- —
Market trends
- HPI YoY
- ▲ 4.62%
- Current HPI
- 315.61
- Rent YoY
- —
- Metro
- —
- State GDP YoY
- ▲ 2.90%
- F500 in state
- 18
Industry mix (Fortune 500 HQ in IN)
| Industry | F500 HQs | Revenue |
|---|---|---|
| Industrial Machinery | 2 | $37B |
|
||
| Healthcare | 1 | $177B |
|
||
| Pharmaceuticals | 1 | $45B |
|
||
| Metals / Steel | 1 | $18B |
|
||
| Agriculture | 1 | $17B |
|
||
| Packaging | 1 | $12B |
|
||
Price history
1 event — show timeline
- 2026-05-28 Listed $184,900 MIBOR as Distributed by MLS Grid
Property tax history
+4.6%/yrLatest (2022): $597 · -3.6% YoY. Source: county tax records.
Cash-flow waterfall
monthlySold comps — $/sqft
last 12 mo · ≤1 miLoading sold comps…