3347 Topeka Ave · Dallas, TX
Flood risk 5/10 · Moderate
- FEMA flood zone
- X
- Chance of flooding over 30 yrs
- 0.24%
- Est. flood insurance / yr
- $507 – $1,088
Fire risk 1/10 · Minimal
- Est. fire insurance / yr
- $1,222 – $2,270
Heat risk 8/10 · Major
- Hot days now (above 109°F)
- 7 days/yr
- Hot days in 30 yrs
- 23 days/yr
Wind risk 6/10 · Moderate
- Chance of severe wind over 30 yrs
- 27.0%
Air-quality risk 3/10 · Minor
- Unhealthy air days now
- 2 days/yr
- Unhealthy air days in 30 yrs
- 3 days/yr
Risk factors via First Street. Map © Google.
Why this score? — see what drove the D- grade
The composite is a weighted blend of 9 inputs, each scored 0–100. Each bar is that input's sub-score; the figure is the points it added to the 100-point composite (weight × sub-score).
- Appreciation +10.0/10.0
- Cash flow +9.2/30.0
- Livability +4.0/5.0
- 1% rule +3.5/10.0
- Schools +2.8/10.0
- DSCR +2.6/10.0
- Condition / age +2.5/5.0
- ARV discount +2.0/15.0
- Rent growth +1.4/5.0
$300,000
🖨 Deal sheet (PDF) 📄 Offer letter ✓ Due diligence
Listing remarks
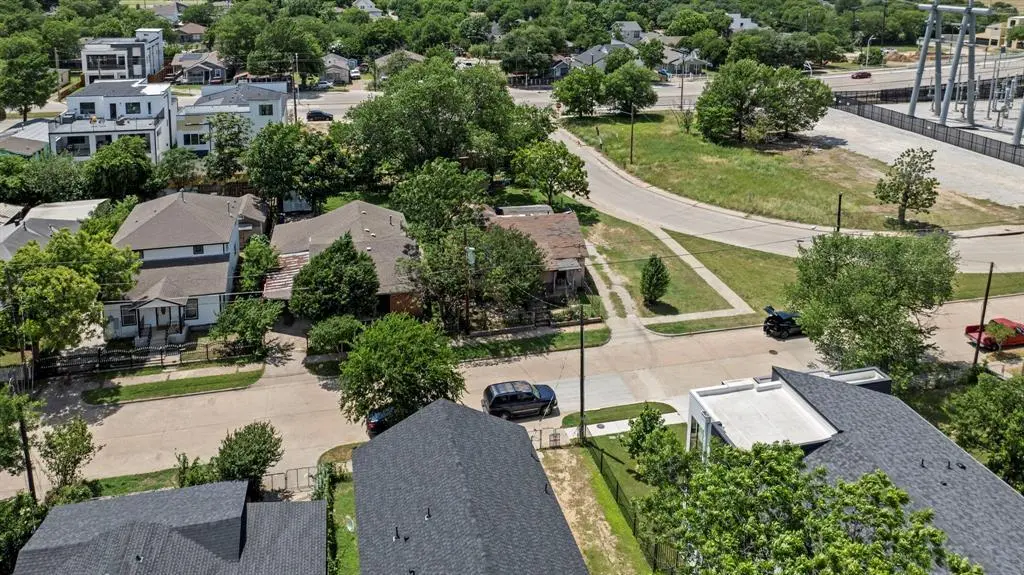
Prime Corner Lot Development Opportunity! Incredible opportunity for a new build on this 0.15-acre corner lot in the heart of the Trinity Groves area. Located in the Brantley's Junior subdivision, this property is the perfect canvas for your custom vision. The existing 1950s-built home is a tear-down but offers the advantage of existing utility connections for plumbing and electric. Situated in a rapidly developing location, the value is strictly in the land. Strictly no showings permitted; please do not disturb the occupant. Bring your builder and secure this high-potential corner site today! Information deemed reliable but not guaranteed. Buyer and Buyer’s Agent are responsible for
Key facts
- Corner lot
- Utility connections
- 6,360 sq ft lot
Tags
Property features AI
Finance
- Other: Property is for sale; Standard listing conditions; Possession at closing/funding
- Financial info: Sales terms: Cash; No second mortgage
- HOA & community: No association
Exterior
- Parking: Carport; One carport space; Two covered parking spaces; One garage space (has garage)
- Utilities: City sewer; Not in a municipal utility district
- Home design: Single family residence; Residential property; One story; Not attached to other properties; No accessory unit
- Construction: Built in 1950; Wood construction; Composition/shingle roof; Other foundation
- Exterior features: Corner lot; Chain link fencing
Interior
- Kitchen: Dishwasher; Electric oven; Microwave; Refrigerator
- Bedrooms: Three bedrooms (primary bedroom on level 1)
- Flooring: Wood flooring; Other flooring
- Bathrooms: Two full bathrooms
- Heating & cooling: Window air conditioning units; Space heater
- Interior features: Eat-in kitchen; Cable TV available; One living area; One dining area; Two total bathrooms; Two full bathrooms; Room count includes 2 main rooms; One-level layout
- Laundry & utility: Washer hookup
Neighborhood map
What this means for you Summary
Snapshot
- This is a 3-bed/2.0-bath single-family listed at $300k.
Deal economics
- At list price, monthly cash flow is $-227 ($-3k/yr) — negative.
- To cash-flow at today's rent, offer at most $260k (13.4% below list).
- To meet the 1% rule (rent ≥ 1% of price), the offer needs to be $254k (15.4% below list).
- Recommended offer: $254k (15.4% below list) — sets the bar for 1% rule.
- Cap rate 5.4% vs local median 2.3% in Dallas — top-decile yield for the area; either an underpriced asset or a hidden risk that comps aren't pricing in. Stress-test before assuming the spread holds.
Location & tenants
- Location reads 81/100 on livability (#24 in TX, #1,380 nationally) — a professional / high-income tenant draw. Strengths: amenities A+, commute A+, housing A+; Watch: crime F.
- Dallas ISD (urban): math 31% / reading 36% proficiency, ranked #559 of 826 in TX (top 68%) — families likely to look elsewhere, expect single-tenant / working-renter base with shorter leases; 83% free/reduced lunch — lower-income household profile, screen leases tightly.
- Zoned schools: C F Carr El (math 32% / reading 22%, grade F, #2,791 of 4,322 statewide, top 68%, 281 students, 99% FRL); D A Hulcy Steam Middle (math 33% / reading 32%, grade F, #947 of 1,662 statewide, top 58%, 423 students, 88% FRL); L G Pinkston H S (math 10% / reading 21%, grade F, #1,505 of 1,632 statewide, top 92%, 1,139 students, 92% FRL).
- Market conditions: Rents falling (-4.2%/yr); 249 active listings in the ZIP; 40 comparable units currently listed for rent nearby; rentals at typical pace (median 20d on market — plan ~3-4 weeks tenant-placement turnaround); 12,577 units permitted in Dallas County in 2024 (6,829 in 5+ unit buildings).
- At $2,539/mo this rent would consume 51% of the median local household income ($60k/yr) (locally 892% of renters already pay >50% of income on rent) — very limited rent-growth headroom before tenants either downsize or default.
Forward outlook
- In year one you build about $32k of equity ($2k loan paydown + $30k appreciation (10.0% local appreciation)).
- Dallas County population projected at +35% by 2050 — long-run rental-demand tailwind backs the buy-and-hold thesis.
- By year 2, paydown + projected appreciation supports a ~$52k cash-out refi (75% LTV) — recoverable capital for the next deal without selling this one.
Negotiation context
- It's been on market 35 days — a 3% lower offer ($291k) is reasonable based on typical stale-listing flexibility.
Risks & watch-outs
- Watch-outs: built in 1950 — expect roof / HVAC / electrical / plumbing capex.
- Climate carrying-cost: moderate flood risk; major wind risk, 27% chance of damaging wind over 30y; extreme-heat days projected 7→23/yr by 2055 (HVAC capex compounding) — expect insurance premiums to compound above CPI over the hold.
Questions for the listing agent
- What do current leases actually rent for vs. the listed asking? Can we see a recent rent roll and the last 12 months of T-12 income?
- It's been on market 35 days. Have you received any prior offers? Is the seller open to a 15% concession, seller financing, or rate buy-down credit?
- Built in 1950 — when were the roof, HVAC, electrical panel, plumbing, and water heater last replaced?
- Is there a deadline driving the sale (1031 exchange, divorce, estate, relocation)? That informs how much negotiation room exists.
- Crime grade is F in this area — have there been break-ins, vandalism, or insurance claims at this property in the last 3 years? What carrier currently insures it and at what premium?
- The area grade is low — what's the realistic commute time and amenity access for the typical tenant pool here? Any planned neighborhood developments (good or bad) we should know about?
- What's the average days-on-market for RENTAL listings here right now (not sales)? A rising rental-DOM trend means longer vacancies and softer asking-rent achievability than the comps imply.
- What's the recent tenant-quality profile in this submarket — average credit score on applications, eviction rate, late-payment / NSF rate, and stable-employment percentage? A property-management company in the area should have these aggregated.
- How much new for-sale + rental construction is in the pipeline within 1–3 miles? Heavy new supply typically softens prices + rents 12–24 months out; constrained supply supports both.
Investment metrics
- 1% rule
- 0.85% ✗
- Cap rate
- 5.38%
- Cash-on-cash
- -3.24%
- DSCR
- 0.86
- GRM
- 9.8
CMA / ARV
- ARV (on-the-fly)
- $267,225
- Comps found
- 12
Show comp detail 12 sales within ~0.75 mi
| Address | Dist | Beds/Ba | Sqft | Sold | Price | $/sf | Match |
|---|---|---|---|---|---|---|---|
| 1423 Toronto St | 0.58mi | 3/2.0 | 1,428 (-6%) | 6mo | $250,000 | $175 | 57 |
| 1004 Muncie Ave | 0.66mi | 3/2.0 | 1,652 (+8%) | 0mo | $349,000 | $211 | 55 |
| 3331 N Winnetka Ave | 0.29mi | 4/2.0 (+1) | 1,686 (+10%) | 10mo | $255,000 | $151 | 55 |
| 3343 Conroe St | 0.18mi | 4/2.0 (+1) | 1,696 (+11%) | 19mo | $409,900 | $242 | 52 |
| 3431 N Winnetka Ave | 0.28mi | 4/2.0 (+1) | 1,683 (+10%) | 16mo | $255,000 | $152 | 52 |
| 917 Walkway St | 0.66mi | 2/1.5 (-1) | 1,629 (+7%) | 3mo | $225,000 | $138 | 49 |
| 3111 Rutz St | 0.64mi | 3/2.0 | 1,392 (-9%) | 14mo | $235,000 | $169 | 44 |
| 3211 Chihuahua Ave | 0.67mi | 3/2.5 | 1,743 (+14%) | 2mo | $449,900 | $258 | 42 |
| 1705 Mcbroom St | 0.68mi | 3/2.0 | 1,439 (-6%) | 23mo | $335,000 | $233 | 40 |
| 1615 Bickers St | 0.68mi | 3/2.0 | 1,355 (-11%) | 20mo | $314,999 | $232 | 33 |
| 1602 Life Ave | 0.63mi | 4/2.0 (+1) | 1,663 (+9%) | 23mo | $260,000 | $156 | 32 |
| 1622 Bickers St | 0.68mi | 4/3.0 (+1) | 1,728 (+13%) | 18mo | $240,000 | $139 | 23 |
Match score weights: distance 35% · size 25% · config 20% · recency 20%. Top-matched comps best support the ARV.
Projected returns pro-forma
10.0% appreciation · 0.0% rent growth · sell at horizon
- IRR
- 21.0%
- Equity multiple
- 2.69×
- Total profit
- $141,624
- Equity at exit
- $270,264
- IRR
- 18.4%
- Equity multiple
- 5.94×
- Total profit
- $415,376
- Equity at exit
- $582,834
Cash invested: $84,000 (down + closing). Projections, not guarantees.
Landlord ↔ Tenant lean methodology
- Overall (STATE)
- 87 Strongly Landlord-Friendly
- State Texas
- 87 Strongly Landlord-Friendly · R+5
- County
- — inherits STATE
- City
- — inherits STATE
ZIP-level market 75212
- Rents YoY
- -4.2%
- Active inventory
- 249
- Price-to-rent
- 9.8×
Monthly cashflow live
- Estimated rent
- $2,539 high interval (Pro) →
- Mortgage (P&I)
- −$1,573
- Tax from tax record
- −$535 /mo · $6,417/yr
- Insurance
- −$125
- HOA
- −$0
- Vacancy / Maint / Mgmt
- −$533
- Net cashflow
- $-227
Break-even live
Sensitivity live
| Price | -10% $-57 | -5% $-142 | +0% $-227 | +5% $-312 | +10% $-397 |
|---|---|---|---|---|---|
| Rent | -10% $-428 | -5% $-327 | +0% $-227 | +5% $-127 | +10% $-26 |
| Rate | -1.0pp $-76 | -0.5pp $-151 | base $-227 | +0.5pp $-305 | +1.0pp $-384 |
UW: 25.0% down · 7.5% · 30yr · 1.5% tax · 5.0% vac · 8.0% maint · 8.0% mgmt
Financing live
Cash to close
- Down payment
- $75,000
- Closing costs
- $9,000
- Reserves months
- —
- Total cash needed
- —
Loan-product check · same deal, 3 products live
Conventional
25% down · 7.5% · 30yr
- Down + closing
- —
- Monthly P&I
- —
- Monthly cashflow
- —
- DSCR
- —
- Eligible?
- —
Personal DTI + credit; lowest rate.
DSCR
20% down · 8.5% · 30yr
- Down + closing
- —
- Monthly P&I
- —
- Monthly cashflow
- —
- DSCR
- —
- Eligible?
- —
No personal income docs; deal must DSCR.
Hard money
10% down · 12.0% · 12mo
- Down + closing
- —
- Monthly P&I
- —
- Monthly cashflow
- —
- DSCR
- —
- Eligible?
- —
Short-term bridge; refi at stabilization.
Rent comps 40 comps
| Address | Beds | Baths | Sqft | Rent | $/sqft | DOM | Units | Dist |
|---|---|---|---|---|---|---|---|---|
| 3213 Obenchain St Dallas, TX | 3.0 | 1.0 | 1120 | $1,690 | $1.51 | 45d | 1 | 0.25mi |
| 996 Singleton Blvd Dallas, TX | 2.0 | 2.0 | 1203 | $1,981 | $1.65 | 4d | 1 | 0.48mi |
| 3517 Chicago St Dallas, TX | 3.0 | 3.0 | 1538 | $1,200 | $0.78 | 8d | 1 | 0.48mi |
| 1010 Singleton Blvd Unit 1043 Dallas, TX | 3.0 | 2.0 | 1581 | $3,127 | $1.98 | 0d | 1 | 0.49mi |
| 320 Singleton Blvd Dallas, TX | 2.0 | 1.0–2.0 | 874 | $2,069 | $2.37 | 0d | 15 | 0.51mi |
| 990 Singleton Blvd Dallas, TX | 2.0 | 1.0–2.5 | 942 | $2,235 | $2.37 | 1d | 26 | 0.52mi |
| 1130 Tea Olive Ln Dallas, TX | 3.0 | 2.5 | 1751 | $3,000 | $1.71 | 45d | 1 | 0.57mi |
| 1115 Manacor Ln Dallas, TX | 3.0 | 2.5 | 1827 | $3,200 | $1.75 | 26d | 1 | 0.58mi |
| 3321 Rutz St Dallas, TX | 3.0 | 2.5 | 1436 | $2,550 | $1.78 | 6d | 1 | 0.60mi |
| 1190 Manacor Ln Dallas, TX | 3.0 | 3.5 | 1849 | $2,999 | $1.62 | 14d | 1 | 0.61mi |
| 3129 Rutz St Unit 1241909P Dallas, TX | 4.0 | 2.5 | 2098 | $9,353 | $4.46 | 24d | 1 | 0.64mi |
| 3129 Rutz St Dallas, TX | 4.0 | 2.5 | 2102 | $7,850 | $3.73 | 45d | 1 | 0.64mi |
| 2901 Borger St Apt 511 Dallas, TX | 2.0 | 2.0 | 1084 | $1,850 | $1.71 | 0d | 1 | 0.64mi |
| 1610 Life Ave Dallas, TX | 3.0 | 2.5 | 1657 | $2,800 | $1.69 | 45d | 1 | 0.64mi |
| 3122 Chihuahua Ave Unit 1510240P Dallas, TX | 4.0 | 3.0 | 2174 | $5,369 | $2.47 | 1d | 1 | 0.66mi |
| 2806 Chicago St Dallas, TX | 4.0 | 3.5 | 1976 | $2,900 | $1.47 | 26d | 1 | 0.67mi |
| 3226 Navaro St Dallas, TX | 3.0 | 2.0 | 1547 | $2,500 | $1.62 | 45d | 1 | 0.68mi |
| 120 Turtle Creek Blvd Dallas, TX | 2.0 | 1.0–2.0 | 920 | $2,203 | $2.39 | 0d | 28 | 0.69mi |
| 3105 Chihuahua Ave Dallas, TX | 4.0 | 2.5 | 2214 | $3,200 | $1.45 | 17d | 1 | 0.70mi |
| 2633 La Altura Ln Dallas, TX | 3.0 | 3.5 | 2170 | $3,650 | $1.68 | 14d | 1 | 0.72mi |
| 1723 Shaw St Dallas, TX | 4.0 | 3.0 | 1720 | $2,699 | $1.57 | 9d | 1 | 0.73mi |
| 2654 Carolwood Ln Dallas, TX | 3.0 | 3.5 | 2174 | $3,500 | $1.61 | 45d | 1 | 0.73mi |
| 2601 La Altura Ln Dallas, TX | 3.0 | 3.5 | 2233 | $4,200 | $1.88 | 45d | 1 | 0.74mi |
| 411 W Commerce St Dallas, TX | 3.0 | 1.0–3.0 | 1155 | $1,930 | $1.67 | 0d | 21 | 0.75mi |
| 1739 McBroom St Dallas, TX | 3.0 | 2.0 | 1138 | $2,100 | $1.85 | 13d | 1 | 0.76mi |
| 455 W Commerce St Dallas, TX | 2.0 | 2.0 | 1121 | $1,810 | $1.61 | 22d | 1 | 0.76mi |
| 455 W Commerce St Dallas, TX | 2.0 | 2.0 | 1121 | $1,810 | $1.61 | 21d | 1 | 0.76mi |
| 2635 Carmelita St Dallas, TX | 3.0 | 3.5 | 2237 | $3,399 | $1.52 | 26d | 1 | 0.77mi |
| 305 W Commerce St Dallas, TX | 2.0 | 1.0–2.0 | 874 | $1,976 | $2.26 | 0d | 28 | 0.78mi |
| 3807 Vilbig Rd Dallas, TX | 3.0 | 2.5 | 2000 | $5,500 | $2.75 | 45d | 1 | 0.84mi |
| 444 W Commerce St Dallas, TX | 2.0 | 1.0–2.5 | 971 | $2,193 | $2.26 | 0d | 17 | 0.85mi |
| 1834 Bayside St Dallas, TX | 3.0 | 2.0 | 1322 | $2,000 | $1.51 | 19d | 1 | 0.89mi |
| 710 Fort Worth Ave Dallas, TX | 2.0 | 2.0 | 1122 | $1,479 | $1.32 | 45d | 1 | 0.93mi |
| 1907 Nomas St Dallas, TX | 3.0 | 2.0 | 1368 | $2,900 | $2.12 | 20d | 1 | 0.93mi |
| 718 Fort Worth Ave Dallas, TX | 3.0 | 3.0 | 1452 | $2,672 | $1.84 | 24d | 1 | 0.94mi |
| 718 Fort Worth Ave Dallas, TX | 3.0 | 3.0 | 1452 | $2,672 | $1.84 | 14d | 1 | 0.94mi |
| 718 Fort Worth Ave Dallas, TX | 2.0 | 2.0 | 1163 | $2,026 | $1.74 | 21d | 1 | 0.94mi |
| 718 Fort Worth Ave Dallas, TX | 2.0 | 2.0 | 1163 | $2,026 | $1.74 | 14d | 1 | 0.94mi |
| 1293 Clifftop Ln Dallas, TX | 2.0 | 2.5 | 1411 | $2,900 | $2.06 | 45d | 1 | 0.94mi |
| 200 W Commerce St Dallas, TX | 2.0 | 1.0–2.0 | 849 | $2,177 | $2.56 | 0d | 30 | 0.96mi |
Listing history 17 events
-
2026-06-21days on market $300,000 Active 35 DOM
-
2026-06-18days on market $300,000 Active 32 DOM
-
2026-06-17days on market $300,000 Active 31 DOM
-
2026-06-16days on market $300,000 Active 30 DOM
-
2026-06-15days on market $300,000 Active 29 DOM
-
2026-06-13days on market $300,000 Active 27 DOM
-
2026-06-09days on market $300,000 Active 23 DOM
-
2026-06-08days on market $300,000 Active 22 DOM
-
2026-06-07days on market $300,000 Active 21 DOM
-
2026-06-04days on market $300,000 Active 18 DOM
-
2026-06-03days on market $300,000 Active 17 DOM
-
2026-06-02days on market $300,000 Active 16 DOM
-
2026-06-01days on market $300,000 Active 15 DOM
-
2026-05-31days on market $300,000 Active 14 DOM
-
2026-05-16$300,000 Active
-
2010-12-16soldstatus
-
2009-02-04soldstatus
ⓘ Source: listings_history table (triggers on properties + properties_extension) + one-shot
backfill from property_details.listing_events for pre-trigger history.
Tax reassessment forecast TX · Resets to sale price
- Current annual tax
- $6,417 · $535/mo
- Projected year-2 tax
- $6,417 · $535/mo
- Expected delta
- $0/yr ($0/mo · -0.0%)
ⓘ Screening estimate from a state-policy table — verify with the county assessor before closing.
Climate risk First Street
- Flood 5/10 Major FEMA zone X · 24% chance over 30 yrs
- Wildfire 1/10 Low
- Heat 8/10 Severe 7 d/yr ≥109°F today · 23 d/yr by 30 yrs out
- Wind 6/10 Major 27% chance of damaging wind over 30 yrs
- Air quality 3/10 Moderate 2 unhealthy d/yr today · 3 by 30 yrs out
Nearby sold comps map
Loading sold comps map…
Walkable amenities ~0.75 mi
Loading nearby amenities…
Taxation est. · year 1
- Rental income
- $30,471
- − Mortgage interest
- −$16,805
- − Property taxes
- −$6,417
- − Insurance
- −$1,500
- − Repairs & maintenance
- −$2,438
- − Management
- −$2,438
- − Depreciation
- −$8,727
- Taxable loss
- −$7,854
- Est. tax savings @ 24.0%
- +$1,885
- After-tax cash flow
- $-839/yr
For passive investors: Depreciation is non-cash, so a rental often shows a tax loss while cash-flowing — sheltering income. Rental losses are passive: they offset passive income freely, and up to $25,000/yr can offset ordinary (W-2) income if you actively participate and your MAGI is under $100k (phasing out to $0 by $150k); unused losses carry forward. On sale, claimed depreciation is recaptured at up to 25%, and gains may owe capital-gains tax (a 1031 exchange can defer both). Figures are a year-1 estimate at your 24.0% rate — not tax advice; consult a CPA.
Schools (NCES district)
- District
- Dallas ISD
- NCES district ID
- 4816230
- Math proficiency
- 31% ▼ -16.00%
- Reading proficiency
- 36% ▼ -4.00%
- Median HH income
- $42,881
- Composite
- 28.41/100
- National rank
- #6763
- State rank
- #559 of 826 in TX
Livability — Dallas
- Score
- 81/100
- State rank
- #24
- US rank
- #1380
Category grades
Schools grade is shown separately in the Schools card above.
Census & demographics
- Census place
- Dallas, TX
- County
- Dallas County · 2,612,404 people
- City population
- 1,168,437
- Metro
- Dallas-Fort Worth-Arlington, TX
- Population (ZIP)
- 28,259
- Household income
- $59,750
- Rent vs Own
- Severe rent burden
- 892.0
Population outlook (Dallas County) Hauer SSP2
- Today (2025)
- 2,979,839 people
- By 2030
- 3,191,823 · +7.1%
- By 2040
- 3,619,611 · +21.5%
- By 2050
- 4,026,915 · +35.1%
- By 2075
- 4,957,073 · +66.4%
- By 2100
- 5,508,725 · +84.9%
Race, ethnicity, and origin ACS 2023
- Neighborhood character
- Predominantly Hispanic (67%)
- Race & ethnicity
- Hispanic / Latino 67% Two or more races 26% Black 23% White 6% Asian 2%
- Hispanic origin (detail)
- Mexican 55%
- Common ancestry
- Slovak 1%
- Foreign-born
- 27% · Canada, Vietnam, Jamaica
- Languages at home
- 42% English-only · Spanish 52% Vietnamese 1%
Political lean MEDSL · Dallas
- 2024 margin
- Strong D (+22.2) · D 60.2% · R 38.0% · Other 1.8%
- 2008→2024 swing
- +6.9pp toward D · 2008: 15.3pp · 2024: 22.2pp
- All cycles
- 2024: D+22.2 2020: D+31.6 2016: D+26.2 2012: D+15.4 2008: D+15.3
Not yet ingested
- Civics
- —
Market trends
- HPI YoY
- ▲ 138.69%
- Current HPI
- 477.2035
- Rent YoY
- ▼ -4.21%
- Metro
- Dallas-Fort Worth-Arlington, TX
- State GDP YoY
- ▲ 3.95%
- F500 in state
- 110
Industry mix (Fortune 500 HQ in TX)
| Industry | F500 HQs | Revenue |
|---|---|---|
| Energy | 16 | $1,198B |
|
||
| Technology | 5 | $198B |
|
||
| Engineering / Construction | 4 | $72B |
|
||
| Energy Services | 3 | $60B |
|
||
| Utilities | 3 | $41B |
|
||
| Healthcare | 2 | $330B |
|
||
Price history
3 events — show timeline
- 2026-05-16 Listed $300,000 NTREIS
- 2010-12-16 Sold (Public Records) — Public Records
- 2009-02-04 Sold (Public Records) — Public Records
Property tax history
+15.6%/yrLatest (2025): $6,417 · +14.7% YoY. Source: county tax records.
Cash-flow waterfall
monthlySold comps — $/sqft
last 12 mo · ≤1 miLoading sold comps…