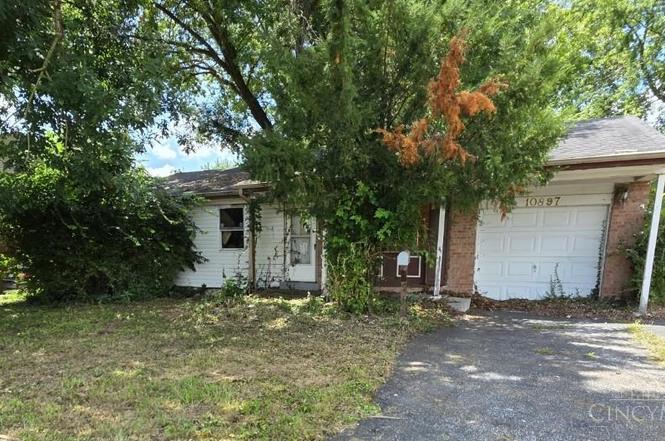
10897 Sprucehill Dr · New Burlington, OH
Flood risk 1/10 · Minimal
- FEMA flood zone
- X (unshaded)
- Chance of flooding over 30 yrs
- 0.0%
- Est. flood insurance / yr
- $473 – $860
Fire risk 1/10 · Minimal
- Est. fire insurance / yr
- $713 – $1,323
Heat risk 4/10 · Minor
- Hot days now (above 103°F)
- 7 days/yr
- Hot days in 30 yrs
- 19 days/yr
Wind risk 2/10 · Minimal
- Chance of severe wind over 30 yrs
- 1.0%
Air-quality risk 4/10 · Minor
- Unhealthy air days now
- 4 days/yr
- Unhealthy air days in 30 yrs
- 6 days/yr
Risk factors via First Street. Map © Google.
Why this score? — see what drove the B+ grade
The composite is a weighted blend of 9 inputs, each scored 0–100. Each bar is that input's sub-score; the figure is the points it added to the 100-point composite (weight × sub-score).
- Cash flow +30.0/30.0
- ARV discount +15.0/15.0
- 1% rule +10.0/10.0
- DSCR +10.0/10.0
- Rent growth +3.3/5.0
- Livability +3.2/5.0
- Condition / age +2.5/5.0
- Schools +1.6/10.0
- Appreciation +0.0/10.0
$109,000
🖨 Deal sheet 📄 Offer letter ✓ Due diligence
Listing remarks MLS
Wow! 4 Bdrm Ranch With Partial Finished Basement. Remodeled Kitchen. Fresh Paint Thru-out. Privacy Fenced Landscaped Yard. Tiered Deck With Bbq Grill. Newer Windows, Security System, Aon Home Warranty Provided.
Key facts
- 8,407 sq ft lot
- Garage
- Built 1966
Property features AI
Finance
- HOA & community: No HOA
Exterior
- Parking: Attached garage (1 car); Driveway and on-street parking
- Utilities: Public water; Public sewer; Electric service
- Home design: Ranch-style single family home; One story
- Construction: Poured foundation
- Exterior features: Shingle roof; Brick and vinyl siding exterior; Residential zoning; Lot approximately 65 x 130 (about 0.193 acres)
Interior
- Kitchen: Kitchen roughly 10 x 10
- Bedrooms: Three bedrooms (all on main level); Primary bedroom about 10 x 12; Bedroom 2 about 8 x 10; Bedroom 3 about 10 x 10
- Bathrooms: One full bathroom on main level; Primary bathroom: other (not standard configuration)
- Heating & cooling: Baseboard heating; Central air conditioning; Electric water heater
- Interior features: Five total rooms; Full basement
Neighborhood map
What this means for you Summary
Snapshot
- This is a 3-bed/1.0-bath single-family listed at $109k.
Deal economics
- At list price, monthly cash flow is $677 ($8k/yr) — positive.
- The deal already cash-flows at list — no discount required.
- Meets the 1% rule at list price ($2k rent vs $109k).
- Recommended offer: $96k (12.0% below list) — sets the bar for market timing.
- Cap rate 13.8% vs local median 5.5% in New Burlington — top-decile yield for the area; either an underpriced asset or a hidden risk that comps aren't pricing in. Stress-test before assuming the spread holds.
Location & tenants
- Location reads 64/100 on livability (#782 in OH) — a middle-class / working-renter tenant base. Strengths: cost of living A+, housing A+, crime A-; Watch: schools F, amenities F, commute F.
- Mt Healthy City (suburban): math 12% / reading 24% proficiency, ranked #636 of 656 in OH (top 97%) — low school quality limits family demand, transient renter base, plan for 1-2y turnover; 75% free/reduced lunch — lower-income household profile, screen leases tightly.
- Market conditions: Rents rising (+3.3%/yr); 42 active listings in the ZIP; 4 comparable units currently listed for rent nearby; rentals at typical pace (median 21d on market — plan ~3-4 weeks tenant-placement turnaround); 801 units permitted in Hamilton County in 2024 (190 in 5+ unit buildings).
- This rent runs 33% of the median local income ($72k/yr) — at the standard rent-burdened threshold; future hikes will face affordability resistance.
Forward outlook
- Local home prices are declining (-3.0%/yr); year-one equity from $754 of loan paydown is wiped out by about $3k of value loss. Plan a longer hold.
- At projected returns (-3.0% appreciation + 3.3% rent growth), your $31k cash investment doubles in ~5 years — after that, you're playing with house money.
Negotiation context
- It's been on market 148 days — a 12% lower offer ($96k) is reasonable based on typical stale-listing flexibility.
- 3 sale attempts since 28y ago with the ask held roughly flat each time — persistent listings suggest the price (not the market) is what's stuck; bring a comps-based counter.
- Current owner paid $61k; list at $109k implies a 79% gain — meaningful room to come down on a strong offer.
Risks & watch-outs
- Watch-outs: property tax is 2.8% of price.
Questions for the listing agent
- It's been on market 148 days. Have you received any prior offers? Is the seller open to a 12% concession, seller financing, or rate buy-down credit?
- Built in 1966 — when were the roof, HVAC, electrical panel, plumbing, and water heater last replaced?
- Property tax is high relative to price — has the assessment been appealed recently, and will the sale trigger a re-assessment?
- Why hasn't it sold? Are there any deal-killer items the seller is aware of (foundation, flood, title, zoning, code violations)?
- Is there a deadline driving the sale (1031 exchange, divorce, estate, relocation)? That informs how much negotiation room exists.
- Schools are F-rated, which usually means shorter tenancies and higher turnover. Who's the typical renter profile here, and what's been the actual vacancy rate?
- What's the average days-on-market for RENTAL listings here right now (not sales)? A rising rental-DOM trend means longer vacancies and softer asking-rent achievability than the comps imply.
- What's the recent tenant-quality profile in this submarket — average credit score on applications, eviction rate, late-payment / NSF rate, and stable-employment percentage? A property-management company in the area should have these aggregated.
- How much new for-sale + rental construction is in the pipeline within 1–3 miles? Heavy new supply typically softens prices + rents 12–24 months out; constrained supply supports both.
Investment metrics
- 1% rule
- 1.80% ✓
- Cap rate
- 13.75%
- Cash-on-cash
- 26.63%
- DSCR
- 2.19
- GRM
- 4.6
CMA / ARV
- ARV (on-the-fly)
- $200,075
- Comps found
- 12
Show comp detail 12 sales within ~0.75 mi
| Address | Dist | Beds/Ba | Sqft | Sold | Price | $/sf | Match |
|---|---|---|---|---|---|---|---|
| 2074 Roosevelt Ave | 0.16mi | 3/1.0 | 1,275 (-4%) | 4mo | $177,500 | $139 | 83 |
| 2085 Mistyhill Dr | 0.06mi | 3/1.0 | 1,250 (-6%) | 13mo | $180,000 | $144 | 76 |
| 10804 Sprucehill Dr | 0.20mi | 3/1.0 | 1,444 (+9%) | 6mo | $220,000 | $152 | 71 |
| 1950 Bluehill Dr | 0.36mi | 3/1.0 | 1,275 (-4%) | 11mo | $193,000 | $151 | 68 |
| 1854 Windmill Way | 0.48mi | 3/1.0 | 1,405 (+6%) | 1mo | $183,500 | $131 | 67 |
| 2132 Seven Hills Dr | 0.10mi | 3/1.0 | 1,428 (+8%) | 19mo | $175,000 | $123 | 67 |
| 10757 Shadowridge Ln | 0.34mi | 3/1.0 | 1,444 (+9%) | 5mo | $126,000 | $87 | 65 |
| 10928 Birchridge Dr | 0.04mi | 3/2.0 | 1,496 (+13%) | 11mo | $225,000 | $150 | 63 |
| 10731 Valiant Dr | 0.58mi | 3/1.0 | 1,194 (-10%) | 0mo | $209,000 | $175 | 56 |
| 1828 Aspenhill Dr | 0.56mi | 3/2.0 | 1,450 (+9%) | 1mo | $235,000 | $162 | 53 |
| 10750 Valiant Dr | 0.54mi | 3/1.0 | 1,186 (-10%) | 18mo | $190,000 | $160 | 43 |
| 2176 Pinney Ln | 0.72mi | 2/1.0 (-1) | 1,139 (-14%) | 20mo | $207,500 | $182 | 21 |
Match score weights: distance 35% · size 25% · config 20% · recency 20%. Top-matched comps best support the ARV.
Projected returns pro-forma
-3.0% appreciation · 3.3% rent growth · sell at horizon
- IRR
- 20.9%
- Equity multiple
- 1.86×
- Total profit
- $26,179
- Equity at exit
- $16,252
- IRR
- 29.3%
- Equity multiple
- 3.66×
- Total profit
- $81,230
- Equity at exit
- $9,424
Cash invested: $30,520 (down + closing). Projections, not guarantees.
Landlord ↔ Tenant lean methodology
- Overall (STATE)
- 73 Landlord-Friendly
- State Ohio
- 73 Landlord-Friendly · R+6
- County
- — inherits STATE
- City
- — inherits STATE
ZIP-level market 45240
- Rents YoY
- 3.3%
- Active inventory
- 42
- Price-to-rent
- 4.6×
Monthly cashflow live
- Estimated rent
- $1,965 medium interval (Pro) →
- Mortgage (P&I)
- −$572
- Tax from tax record
- −$258 /mo · $3,099/yr
- Insurance
- −$45
- HOA
- −$0
- Vacancy / Maint / Mgmt
- −$413
- Net cashflow
- $677
Break-even live
UW: 25.0% down · 7.5% · 30yr · 1.5% tax · 5.0% vac · 8.0% maint · 8.0% mgmt
Financing live
Cash to close
- Down payment
- $27,250
- Closing costs
- $3,270
- Reserves months
- —
- Total cash needed
- —
Loan-product check · same deal, 3 products live
Conventional
25% down · 7.5% · 30yr
- Down + closing
- —
- Monthly P&I
- —
- Monthly cashflow
- —
- DSCR
- —
- Eligible?
- —
Personal DTI + credit; lowest rate.
DSCR
20% down · 8.5% · 30yr
- Down + closing
- —
- Monthly P&I
- —
- Monthly cashflow
- —
- DSCR
- —
- Eligible?
- —
No personal income docs; deal must DSCR.
Hard money
10% down · 12.0% · 12mo
- Down + closing
- —
- Monthly P&I
- —
- Monthly cashflow
- —
- DSCR
- —
- Eligible?
- —
Short-term bridge; refi at stabilization.
Rent comps 4 comps
| Address | Beds | Baths | Sqft | Rent | $/sqft | DOM | Units | Dist |
|---|---|---|---|---|---|---|---|---|
| 2300 Walden Glen Cir Cincinnati, OH | 1.0–3.0 | 1.0–1.5 | 830 | $1,599 | $1.93 | 1d | 9 | 0.36mi |
| 2504 Houston Rd Cincinnati, OH | 2.0 | 2.0 | 1105 | $2,995 | $2.71 | 1d | 1 | 0.77mi |
| 2753 Town Terrace Dr Cincinnati, OH | 2.0–3.0 | 1.0–1.5 | 968 | $1,450 | $1.50 | 21d | 4 | 1.26mi |
| 11702 Elkwood Dr Cincinnati, OH | 4.0 | 1.5 | 1544 | $2,200 | $1.42 | 43d | 1 | 1.47mi |
Listing history 21 events
-
2026-06-18days on market $109,000 Active 148 DOM
-
2026-06-17days on market $109,000 Active 147 DOM
-
2026-06-16days on market $109,000 Active 146 DOM
-
2026-06-15days on market $109,000 Active 145 DOM
-
2026-06-13days on market $109,000 Active 143 DOM
-
2026-06-13days on market $109,000 Active 142 DOM
-
2026-06-09days on market $109,000 Active 139 DOM
-
2026-06-08days on market $109,000 Active 138 DOM
-
2026-06-07days on market $109,000 Active 137 DOM
-
2026-06-05days on market $109,000 Active 134 DOM
-
2026-06-03days on market $109,000 Active 133 DOM
-
2026-06-02days on market $109,000 Active 132 DOM
-
2026-06-01days on market $109,000 Active 131 DOM
-
2026-05-31days on market $109,000 Active 130 DOM
-
2026-03-20status Active
-
2026-02-18historical Contingency Pending
-
2026-01-16$109,000 Active
-
1999-02-16soldstatus $61,000
-
1998-12-31soldstatus $61,000 210-char remark
Show marketing remark (210 chars)
Wow! 4 Bdrm Ranch With Partial Finished Basement. Remodeled Kitchen. Fresh Paint Thru-out. Privacy Fenced Landscaped Yard. Tiered Deck With Bbq Grill. Newer Windows, Security System, Aon Home Warranty Provided.
-
1998-10-16$63,900 210-char remark
Show marketing remark (210 chars)
Wow! 4 Bdrm Ranch With Partial Finished Basement. Remodeled Kitchen. Fresh Paint Thru-out. Privacy Fenced Landscaped Yard. Tiered Deck With Bbq Grill. Newer Windows, Security System, Aon Home Warranty Provided.
-
1991-12-19soldstatus $48,000
ⓘ Source: listings_history table (triggers on properties + properties_extension) + one-shot
backfill from property_details.listing_events for pre-trigger history.
Tax reassessment forecast OH · Partial reset (capped growth)
- Current annual tax
- $3,099 · $258/mo
- Projected year-2 tax
- $3,099 · $258/mo
- Expected delta
- $0/yr ($0/mo · 0.0%)
ⓘ Screening estimate from a state-policy table — verify with the county assessor before closing.
Climate risk First Street
- Flood 1/10 Low FEMA zone X (unshaded) · 0% chance over 30 yrs
- Wildfire 1/10 Low
- Heat 4/10 Moderate 7 d/yr ≥103°F today · 19 d/yr by 30 yrs out
- Wind 2/10 Low 100% chance of damaging wind over 30 yrs
- Air quality 4/10 Moderate 4 unhealthy d/yr today · 6 by 30 yrs out
Nearby sold comps map
Loading sold comps map…
Walkable amenities ~0.75 mi
Loading nearby amenities…
Taxation est. · year 1
- Rental income
- $23,584
- − Mortgage interest
- −$6,106
- − Property taxes
- −$3,099
- − Insurance
- −$545
- − Repairs & maintenance
- −$1,887
- − Management
- −$1,887
- − Depreciation
- −$3,171
- Taxable income
- $6,890
- Est. tax owed @ 24.0%
- −$1,654
- After-tax cash flow
- $6,475/yr
For passive investors: Depreciation is non-cash, so a rental often shows a tax loss while cash-flowing — sheltering income. Rental losses are passive: they offset passive income freely, and up to $25,000/yr can offset ordinary (W-2) income if you actively participate and your MAGI is under $100k (phasing out to $0 by $150k); unused losses carry forward. On sale, claimed depreciation is recaptured at up to 25%, and gains may owe capital-gains tax (a 1031 exchange can defer both). Figures are a year-1 estimate at your 24.0% rate — not tax advice; consult a CPA.
Schools (NCES district)
- District
- Mt Healthy City
- NCES district ID
- 3904441
- Math proficiency
- 12% ▼ -21.00%
- Reading proficiency
- 24% ▼ -9.00%
- Median HH income
- $42,699
- Composite
- 15.51/100
- National rank
- #9303
- State rank
- #636 of 656 in OH
Livability — New Burlington
- Score
- 64/100
- State rank
- #782
- US rank
- #14211
Category grades
Schools grade is shown separately in the Schools card above.
Census & demographics
- Census place
- New Burlington, OH
- County
- Hamilton County · 701,295 people
- Metro
- Cincinnati, OH-KY-IN
- Population (ZIP)
- 29,600
- Household income
- $71,947
- Rent vs Own
- Severe rent burden
- 693.0
Population outlook (Hamilton County) Hauer SSP2
- Today (2025)
- 826,054 people
- By 2030
- 830,947 · +0.6%
- By 2040
- 832,319 · +0.8%
- By 2050
- 822,428 · -0.4%
- By 2075
- 788,688 · -4.5%
- By 2100
- 710,674 · -14.0%
Race, ethnicity, and origin ACS 2023
- Neighborhood character
- Diverse neighborhood (Simpson 0.59)
- Race & ethnicity
- Black 59% White 25% Hispanic / Latino 8% Two or more races 5% Asian 4%
- Hispanic origin (detail)
- Mexican 2%
- Common ancestry
- Lithuanian 1% Romanian 1%
- Foreign-born
- 13% · Canada, India, China
- Languages at home
- 85% English-only · Spanish 6% French/Haitian/Cajun 3% Other Indo-European 2%
Political lean MEDSL · Hamilton
- 2024 margin
- D (+14.9) · D 57.0% · R 42.1%
- 2008→2024 swing
- +7.9pp toward D · 2008: 7.0pp · 2024: 14.9pp
- All cycles
- 2024: D+14.9 2020: D+15.9 2016: D+9.5 2012: D+4.9 2008: D+7.0
Not yet ingested
- Civics
- —
Market trends
- HPI YoY
- ▼ -209.84%
- Current HPI
- 246.1355
- Rent YoY
- ▲ 3.30%
- Metro
- Cincinnati, OH-KY-IN
- State GDP YoY
- ▲ 1.98%
- F500 in state
- 48
Industry mix (Fortune 500 HQ in OH)
| Industry | F500 HQs | Revenue |
|---|---|---|
| Insurance | 3 | $145B |
|
||
| Industrial Machinery | 3 | $49B |
|
||
| Financial Services | 3 | $24B |
|
||
| Consumer Goods | 2 | $93B |
|
||
| Aerospace / Defense | 2 | $47B |
|
||
| Utilities | 2 | $33B |
|
||
Price history
+127.1% since first listed7 events — show timeline
- 2026-03-20 Relisted — Cincy MLS
- 2026-02-18 Contingent — Cincy MLS
- 2026-01-16 Listed $109,000 Cincy MLS
- 1999-02-16 Sold (Public Records) $61,000 Public Records
- 1998-12-31 Sold (MLS) $61,000 Cincy MLS
- 1998-10-16 Listed $63,900 Cincy MLS
- 1991-12-19 Sold (Public Records) $48,000 Public Records
Property tax history
+3.6%/yrLatest (2025): $3,099 · -4.4% YoY. Source: county tax records.
Cash-flow waterfall
monthlySold comps — $/sqft
last 12 mo · ≤1 miLoading sold comps…