 Duplex
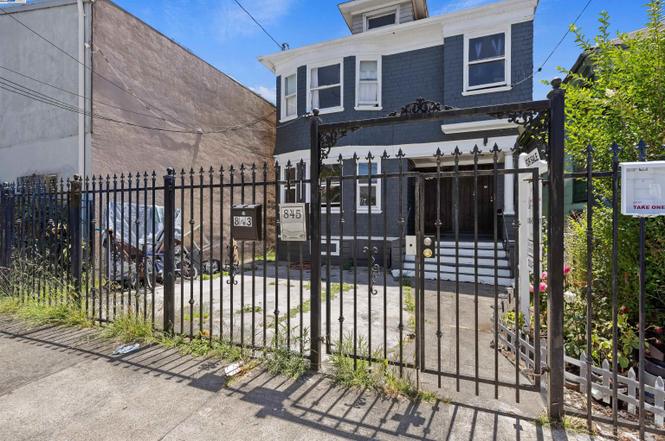
845 Isabella St · Oakland, CA
Flood risk 7/10 · Major
- FEMA flood zone
- X (unshaded)
- Chance of flooding over 30 yrs
- 0.99%
- Est. flood insurance / yr
- $507 – $1,088
Fire risk 1/10 · Minimal
- Est. fire insurance / yr
- $659 – $1,223
Heat risk 3/10 · Minor
- Hot days now (above 82°F)
- 7 days/yr
- Hot days in 30 yrs
- 15 days/yr
Wind risk 1/10 · Minimal
- Chance of severe wind over 30 yrs
- —
Air-quality risk 9/10 · Severe
- Unhealthy air days now
- 16 days/yr
- Unhealthy air days in 30 yrs
- 16 days/yr
Risk factors via First Street. Map © Google.
Why this score? — see what drove the C grade
The composite is a weighted blend of 9 inputs, each scored 0–100. Each bar is that input's sub-score; the figure is the points it added to the 100-point composite (weight × sub-score).
- Cash flow +21.2/30.0
- ARV discount +15.0/15.0
- DSCR +6.7/10.0
- 1% rule +4.7/10.0
- Livability +3.6/5.0
- Rent growth +3.3/5.0
- Schools +3.0/10.0
- Condition / age +2.5/5.0
- Appreciation +0.0/10.0
$525,000
🖨 Deal sheet 📄 Offer letter ✓ Due diligence
Multi-family units
County records classify this as Multi-Family (2-4 Unit). Listing-text estimate: 2 units. confirmed
Listing remarks
MOTIVATED SELLERS – BRING AN OFFER. Introducing 845 & 843 Isabella Street, a rare duplex opportunity in Oakland offering historic 1905 charm, expansive outdoor space, and exceptional development potential. This property features a huge private yard and a barn-like rear structure that presents a compelling opportunity for ADU conversion or future expansion (buyer to verify). One unit will be delivered vacant, and the second unit is anticipated to be delivered vacant upon sale, making this an ideal opportunity for owner-occupants, investors, or multi-generational living. Inside, each unit offers well-proportioned living spaces with period details throughout—perfect for a liv
Key facts
- Historic property
- Expansive yard
- Live-and-work setup
Tags
Neighborhood map
What this means for you Summary
Snapshot
- This is a 2 × 2-bed/1.0-bath units multifamily listed at $525k.
Deal economics
- At list price, monthly cash flow is $690 ($8k/yr) — positive. Per door: $345/mo.
- The deal already cash-flows at list — no discount required.
- To meet the 1% rule (rent ≥ 1% of price), the offer needs to be $507k (3.4% below list).
- Recommended offer: $462k (12.0% below list) — sets the bar for market timing.
- Cap rate 8.0% vs local median 2.4% in Oakland — top-decile yield for the area; either an underpriced asset or a hidden risk that comps aren't pricing in. Stress-test before assuming the spread holds.
Location & tenants
- Location reads 71/100 on livability (#224 in CA) — a middle-class / working-renter tenant base. Strengths: amenities A+, commute A+, employment A+; Watch: schools C-, crime F, cost of living F.
- Oakland Unified (urban): math 27% / reading 33% proficiency, ranked #1,007 of 1,400 in CA (top 72%) — families likely to look elsewhere, expect single-tenant / working-renter base with shorter leases; 68% free/reduced lunch — lower-income household profile, screen leases tightly.
- Market conditions: Rents rising (+3.2%/yr); 133 active listings in the ZIP; 34 comparable units currently listed for rent nearby; rentals at typical pace (median 15d on market — plan ~3-4 weeks tenant-placement turnaround); solid renter incomes; 1,742 units permitted in Alameda County in 2024 (856 in 5+ unit buildings).
- At $5,070/mo this rent would consume 64% of the median local household income ($95k/yr) (locally 2002% of renters already pay >50% of income on rent) — very limited rent-growth headroom before tenants either downsize or default.
Forward outlook
- Local home prices are declining (-3.0%/yr); year-one equity from $4k of loan paydown is wiped out by about $16k of value loss. Plan a longer hold.
- Alameda County population projected at +34% by 2050 — long-run rental-demand tailwind backs the buy-and-hold thesis.
Negotiation context
- It's been on market 133 days — a 12% lower offer ($462k) is reasonable based on typical stale-listing flexibility.
- 4 sale attempts since 3y ago; this cycle's ask has dropped $50k (9%) from the opening price — seller is motivated, your offer sets the floor, not the list.
Risks & watch-outs
- Watch-outs: flood insurance adds $66/mo; built in 1905 — expect roof / HVAC / electrical / plumbing capex.
- Climate carrying-cost: major flood risk — expect insurance premiums to compound above CPI over the hold.
Questions for the listing agent
- It's been on market 133 days. Have you received any prior offers? Is the seller open to a 12% concession, seller financing, or rate buy-down credit?
- Can we see the unit-by-unit rent roll, current vacancy, and any below-market leases? What's the average tenancy length?
- What capital expenditures (roof, boiler, parking lot, exteriors) have been made in the last 5 years, and what's planned in the next 2?
- Built in 1905 — when were the roof, HVAC, electrical panel, plumbing, and water heater last replaced?
- What's the actual annual flood-insurance premium (NFIP or private), and is the property in a SFHA with mandatory coverage?
- Why hasn't it sold? Are there any deal-killer items the seller is aware of (foundation, flood, title, zoning, code violations)?
- Is there a deadline driving the sale (1031 exchange, divorce, estate, relocation)? That informs how much negotiation room exists.
- Crime grade is F in this area — have there been break-ins, vandalism, or insurance claims at this property in the last 3 years? What carrier currently insures it and at what premium?
- What's the average days-on-market for RENTAL listings here right now (not sales)? A rising rental-DOM trend means longer vacancies and softer asking-rent achievability than the comps imply.
- What's the recent tenant-quality profile in this submarket — average credit score on applications, eviction rate, late-payment / NSF rate, and stable-employment percentage? A property-management company in the area should have these aggregated.
- How much new apartment / multifamily construction is in the pipeline within 1–3 miles? Heavy new supply (>2% of stock underway) typically softens rents 12–24 months out; light construction supports rent growth.
Investment metrics
- 1% rule
- 0.97% ✗
- Cap rate
- 8.02%
- Cash-on-cash
- 6.17%
- DSCR
- 1.27
- GRM
- 8.6
CMA / ARV
- ARV (on-the-fly)
- $729,674
- Comps found
- 8
Show comp detail 8 sales within ~0.75 mi
| Address | Dist | Beds/Ba | Sqft | Sold | Price | $/sf | Match |
|---|---|---|---|---|---|---|---|
| 2025-2027 Curtis | 0.18mi | 4/2.0 | 1,893 (-3%) | 1mo | $650,000 | $343 | 86 |
| 865 27th St | 0.21mi | 4/2.0 | 1,920 (-2%) | 13mo | $719,000 | $374 | 77 |
| 699 33rd St | 0.62mi | 3/2.0 (-1) | 1,951 (0%) | 5mo | $580,000 | $297 | 62 |
| 675 25th St | 0.15mi | 5/4.0 (+1) | 2,070 (+6%) | 12mo | $825,000 | $399 | 60 |
| 2834 Summit St | 0.65mi | 4/3.0 | 2,070 (+6%) | 3mo | $815,000 | $394 | 53 |
| 601 32nd St | 0.57mi | 4/2.0 | 1,784 (-9%) | 9mo | $585,000 | $328 | 52 |
| 842 30th St | 0.41mi | 4/2.0 | 1,681 (-14%) | 13mo | $603,000 | $359 | 47 |
| 3130 Union St | 0.74mi | 4/4.0 | 2,062 (+6%) | 23mo | $1,000,000 | $485 | 29 |
Match score weights: distance 35% · size 25% · config 20% · recency 20%. Top-matched comps best support the ARV.
Projected returns pro-forma
-3.0% appreciation · 3.24% rent growth · sell at horizon
- IRR
- -7.4%
- Equity multiple
- 0.73×
- Total profit
- $-40,031
- Equity at exit
- $78,279
- IRR
- 2.5%
- Equity multiple
- 1.18×
- Total profit
- $26,299
- Equity at exit
- $45,392
Cash invested: $147,000 (down + closing). Projections, not guarantees.
Landlord ↔ Tenant lean methodology
- Overall (CITY)
- 0 Strongly Tenant-Friendly
- State California
- 18 Strongly Tenant-Friendly · D+13
- County
- — inherits STATE
- City Oakland
- 0 Strongly Tenant-Friendly · D+62
ZIP-level market 94607
- Rents YoY
- 3.2%
- Active inventory
- 133
- Price-to-rent
- 17.3×
Monthly cashflow live
- Estimated rent
- $5,070 high interval (Pro) →
- Mortgage (P&I)
- −$2,753
- Tax from tax record
- −$277 /mo · $3,326/yr
- Insurance
- −$219
- Flood insurance flood zone
- −$66 /mo · $798/yr
- HOA
- −$0
- Vacancy / Maint / Mgmt
- −$1,065
- Net cashflow
- $690
Break-even live
2-unit breakdown (identical units grouped — click to expand)
| Units | Beds | Baths | Est. rent |
|---|---|---|---|
| 2× units | 2 | 1 | $5,070 |
| #1 | 2 | 1 | $2,535 |
| #2 | 2 | 1 | $2,535 |
| Total (2 units) | $5,070 | ||
UW: 25.0% down · 7.5% · 30yr · 1.5% tax · 5.0% vac · 8.0% maint · 8.0% mgmt
Financing live
Cash to close
- Down payment
- $131,250
- Closing costs
- $15,750
- Reserves months
- —
- Total cash needed
- —
Loan-product check · same deal, 3 products live
Conventional
25% down · 7.5% · 30yr
- Down + closing
- —
- Monthly P&I
- —
- Monthly cashflow
- —
- DSCR
- —
- Eligible?
- —
Personal DTI + credit; lowest rate.
DSCR
20% down · 8.5% · 30yr
- Down + closing
- —
- Monthly P&I
- —
- Monthly cashflow
- —
- DSCR
- —
- Eligible?
- —
No personal income docs; deal must DSCR.
Hard money
10% down · 12.0% · 12mo
- Down + closing
- —
- Monthly P&I
- —
- Monthly cashflow
- —
- DSCR
- —
- Eligible?
- —
Short-term bridge; refi at stabilization.
Rent comps 34 comps
| Address | Beds | Baths | Sqft | Rent | $/sqft | DOM | Units | Dist |
|---|---|---|---|---|---|---|---|---|
| 668 21st St Oakland, CA | 2.0–3.0 | 1.0–2.0 | 1112 | $2,233 | $2.01 | 43d | 1 | 0.35mi |
| 814 30th St Emeryville, CA | 4.0 | 2.0 | 2015 | $7,000 | $3.47 | 2d | 1 | 0.39mi |
| 471 26th St Oakland, CA | 1.0–3.0 | 1.0–3.0 | 967 | $3,963 | $4.10 | 1d | 8 | 0.44mi |
| 2712 Adeline St Unit B Oakland, CA | 4.0 | 3.0 | 1500 | $3,800 | $2.53 | 14d | 1 | 0.44mi |
| 3010 Martin Luther King Junior Way Oakland, CA | 3.0 | 1.0 | 1700 | $2,990 | $1.76 | 43d | 1 | 0.45mi |
| 896 31st St Oakland, CA | 3.0 | 2.0 | 1400 | $2,250 | $1.61 | 43d | 1 | 0.45mi |
| 500 William St Oakland, CA | 3.0 | 1.0–2.0 | 1108 | $4,654 | $4.20 | 2d | 16 | 0.47mi |
| 2016 Telegraph Ave Oakland, CA | 3.0 | 1.0–3.0 | 1026 | $6,748 | $6.58 | 1d | 8 | 0.51mi |
| 1123 30th St Unit 1 Oakland, CA | 3.0 | 2.5 | 2083 | $4,895 | $2.35 | 43d | 1 | 0.55mi |
| 1123 30th St Emeryville, CA | 3.0 | 2.0 | 2083 | $4,895 | $2.35 | 43d | 1 | 0.55mi |
| 2933 McClure St Oakland, CA | 3.0 | 2.0 | 1440 | $4,850 | $3.37 | 2d | 1 | 0.58mi |
| 1950 Broadway Oakland, CA | 4.0 | 1.0–2.0 | 737 | $6,907 | $9.37 | 1d | 53 | 0.61mi |
| 889 34th St Unit 889 Oakland, CA | 4.0 | 2.0 | 1300 | $3,095 | $2.38 | 43d | 1 | 0.66mi |
| 1389 Jefferson St Oakland, CA | 3.0 | 1.0–3.0 | 1166 | $4,370 | $3.75 | 2d | 14 | 0.68mi |
| 835 35th St Unit 1 Oakland, CA | 3.0 | 2.0 | 1400 | $2,950 | $2.11 | 43d | 1 | 0.69mi |
| 1214 Adeline St Oakland, CA | 3.0 | 2.0 | 1300 | $3,160 | $2.43 | 43d | 1 | 0.72mi |
| 1202 Adeline St Oakland, CA | 4.0 | 3.0 | 1800 | $3,795 | $2.11 | 20d | 1 | 0.74mi |
| 1015 Martin Luther King Junior Way Unit B2 Oakland, CA | 4.0 | 2.0 | 1800 | $1,000 | $0.56 | 43d | 1 | 0.77mi |
| 1015 Martin Luther King Junior Way Oakland, CA | 4.0 | 2.0 | 1800 | $1,300 | $0.72 | 43d | 1 | 0.78mi |
| 3093 Broadway Oakland, CA | 3.0 | 1.0–2.0 | 972 | $4,210 | $4.33 | 1d | 24 | 0.87mi |
| 1216 10th St Oakland, CA | 3.0 | 2.0 | 1750 | $3,399 | $1.94 | 43d | 1 | 0.88mi |
| 3415 Haven St Emeryville, CA | 3.0 | 2.5 | 1900 | $4,200 | $2.21 | 10d | 1 | 0.89mi |
| 1100 Webster St Oakland, CA | 3.0 | 1.0–2.0 | 958 | $5,014 | $5.23 | 1d | 7 | 1.00mi |
| 3900 Adeline St Oakland, CA | 3.0 | 1.0–2.0 | 809 | $3,530 | $4.36 | 3d | 9 | 1.02mi |
| 238 13th St Oakland, CA | 3.0 | 1.0–2.0 | 946 | $4,407 | $4.66 | 1d | 7 | 1.05mi |
| 3123 Harrison St Oakland, CA | 3.0 | 2.0 | 1450 | $3,800 | $2.62 | 5d | 1 | 1.07mi |
| 1733 14th St Unit 1733 Oakland, CA | 3.0 | 2.0 | 1650 | $3,015 | $1.83 | 2d | 1 | 1.18mi |
| 1401 Park Ave Emeryville, CA | 3.0 | 1.0–2.5 | 1191 | $5,493 | $4.61 | 10d | 1 | 1.24mi |
| 4510 Hubbard St Emeryville, CA | 1.0–3.0 | 1.0–2.0 | 1221 | $5,219 | $4.27 | 1d | 12 | 1.28mi |
| 564 44th St Unit 1 Oakland, CA | 4.0 | 2.0 | 1400 | $3,250 | $2.32 | 43d | 1 | 1.35mi |
| 520 Van Buren Ave Oakland, CA | 1.0–3.0 | 1.0–2.0 | 974 | $3,795 | $3.89 | 43d | 9 | 1.41mi |
| 482 Jean St Oakland, CA | 3.0 | 2.0 | 1595 | $4,800 | $3.01 | 23d | 1 | 1.44mi |
| 4700 Adeline St Emeryville, CA | 3.0 | 2.0 | 1231 | $3,505 | $2.85 | 24d | 1 | 1.47mi |
| 1200 Lakeshore Ave Oakland, CA | 1.0–3.0 | 1.5–2.5 | 1332 | $10,245 | $7.69 | 1d | 14 | 1.49mi |
Listing history 13 events
-
2026-06-18days on market $525,000 Active 133 DOM
-
2026-06-17days on market $525,000 Active 132 DOM
-
2026-06-16days on market $525,000 Active 131 DOM
-
2026-06-15pricestatusdays on market $525,000 Active 130 DOM
-
2026-03-13status Pending
-
2025-11-11status Active
-
2025-10-28historical
-
2025-10-27status Active
-
2025-10-13historical
-
2025-10-09$575,000 Active
-
2024-11-06historical
-
2024-06-08price
-
2023-07-18New
ⓘ Source: listings_history table (triggers on properties + properties_extension) + one-shot
backfill from property_details.listing_events for pre-trigger history.
Tax reassessment forecast CA · Resets to sale price
- Current annual tax
- $3,326 · $277/mo
- Projected year-2 tax
- $3,990 · $332/mo
- Expected delta
- +$664/yr (+$55/mo · 19.9%)
ⓘ Screening estimate from a state-policy table — verify with the county assessor before closing.
Climate risk First Street
- Flood 7/10 Severe FEMA zone X (unshaded) · 99% chance over 30 yrs
- Wildfire 1/10 Low
- Heat 3/10 Moderate 7 d/yr ≥82°F today · 15 d/yr by 30 yrs out
- Wind 1/10 Low
- Air quality 9/10 Extreme 16 unhealthy d/yr today · 16 by 30 yrs out
Nearby sold comps map
Loading sold comps map…
Walkable amenities ~0.75 mi
Loading nearby amenities…
Taxation est. · year 1
- Rental income
- $60,840
- − Mortgage interest
- −$29,408
- − Property taxes
- −$3,326
- − Insurance
- −$3,422
- − Repairs & maintenance
- −$4,867
- − Management
- −$4,867
- − Depreciation
- −$15,273
- Taxable loss
- −$324
- Est. tax savings @ 24.0%
- +$78
- After-tax cash flow
- $8,355/yr
For passive investors: Depreciation is non-cash, so a rental often shows a tax loss while cash-flowing — sheltering income. Rental losses are passive: they offset passive income freely, and up to $25,000/yr can offset ordinary (W-2) income if you actively participate and your MAGI is under $100k (phasing out to $0 by $150k); unused losses carry forward. On sale, claimed depreciation is recaptured at up to 25%, and gains may owe capital-gains tax (a 1031 exchange can defer both). Figures are a year-1 estimate at your 24.0% rate — not tax advice; consult a CPA.
Schools (NCES district)
- District
- Oakland Unified
- NCES district ID
- 0628050
- Math proficiency
- 27% ▬ 0.00%
- Reading proficiency
- 33% ▬ 0.00%
- Median HH income
- $55,194
- Composite
- 29.52/100
- National rank
- #11769
- State rank
- #1007 of 1400 in CA
Livability — Oakland
- Score
- 71/100
- State rank
- #224
- US rank
- #7245
Category grades
Schools grade is shown separately in the Schools card above.
Census & demographics
- Census place
- Oakland, CA
- County
- Alameda County · 1,614,355 people
- City population
- 385,993
- Metro
- San Francisco-Oakland-Berkeley, CA
- Population (ZIP)
- 28,804
- Household income
- $94,863
- Rent vs Own
- Severe rent burden
- 2002.0
Population outlook (Alameda County) Hauer SSP2
- Today (2025)
- 1,928,884 people
- By 2030
- 2,069,146 · +7.3%
- By 2040
- 2,338,405 · +21.2%
- By 2050
- 2,586,608 · +34.1%
- By 2075
- 3,061,911 · +58.7%
- By 2100
- 3,234,133 · +67.7%
Race, ethnicity, and origin ACS 2023
- Neighborhood character
- Highly diverse neighborhood (Simpson 0.78)
- Race & ethnicity
- Black 29% White 25% Asian 25% Hispanic / Latino 13% Two or more races 10%
- Hispanic origin (detail)
- Mexican 8%
- Common ancestry
- Lithuanian 1% Romanian 1% Portuguese 1%
- Foreign-born
- 28% · China, Canada, Vietnam
- Languages at home
- 65% English-only · Chinese 16% Spanish 8% Arabic 2%
Political lean MEDSL · Alameda
- 2024 margin
- Solid D (+53.6) · D 74.6% · R 21.0% · Other 4.4%
- 2008→2024 swing
- -5.9pp toward R · 2008: 59.5pp · 2024: 53.6pp
- All cycles
- 2024: D+53.6 2020: D+62.5 2016: D+64.4 2012: D+59.8 2008: D+59.5
Not yet ingested
- Civics
- —
Market trends
- HPI YoY
- ▼ -170.49%
- Current HPI
- 263.5885
- Rent YoY
- ▲ 3.24%
- Metro
- San Francisco-Oakland-Berkeley, CA
- State GDP YoY
- ▲ 3.21%
- F500 in state
- 116
Industry mix (Fortune 500 HQ in CA)
| Industry | F500 HQs | Revenue |
|---|---|---|
| Technology | 27 | $1,492B |
|
||
| Financial Services | 3 | $174B |
|
||
| Retail | 3 | $44B |
|
||
| Insurance | 3 | $26B |
|
||
| Media / Entertainment | 2 | $115B |
|
||
| Pharmaceuticals / Biotech | 2 | $62B |
|
||
Price history
9 events — show timeline
- 2026-03-13 Pending — bridgeMLS, Bay East AOR, or Contra Costa AOR
- 2025-11-11 Relisted — bridgeMLS, Bay East AOR, or Contra Costa AOR
- 2025-10-28 Listing Removed — bridgeMLS, Bay East AOR, or Contra Costa AOR
- 2025-10-27 Relisted — bridgeMLS, Bay East AOR, or Contra Costa AOR
- 2025-10-13 Listing Removed — bridgeMLS, Bay East AOR, or Contra Costa AOR
- 2025-10-09 Listed $575,000 bridgeMLS, Bay East AOR, or Contra Costa AOR
- 2024-11-06 Listing Removed — bridgeMLS, Bay East AOR, or Contra Costa AOR
- 2024-06-08 Price Changed — bridgeMLS, Bay East AOR, or Contra Costa AOR
- 2023-07-18 Listed — bridgeMLS, Bay East AOR, or Contra Costa AOR
Property tax history
+4.5%/yrLatest (2025): $3,326 · +5.2% YoY. Source: county tax records.
Cash-flow waterfall
monthlySold comps — $/sqft
last 12 mo · ≤1 miLoading sold comps…