22322 S Cedar Dr #68 · Channahon, IL
Flood risk No data
- FEMA flood zone
- —
- Chance of flooding over 30 yrs
- —
- Est. flood insurance / yr
- —
Fire risk No data
- Est. fire insurance / yr
- —
Heat risk No data
- Hot days now (above threshold)
- —
- Hot days in 30 yrs
- —
Wind risk No data
- Chance of severe wind over 30 yrs
- —
Air-quality risk No data
- Unhealthy air days now
- —
- Unhealthy air days in 30 yrs
- —
Risk factors via First Street. Map © Google.
Why this score? — see what drove the B- grade
The composite is a weighted blend of 9 inputs, each scored 0–100. Each bar is that input's sub-score; the figure is the points it added to the 100-point composite (weight × sub-score).
- Cash flow +30.0/30.0
- DSCR +10.0/10.0
- 1% rule +9.2/10.0
- ARV discount +7.5/15.0
- Livability +3.9/5.0
- Schools +3.1/10.0
- Rent growth +2.5/5.0
- Condition / age +2.5/5.0
- Appreciation +1.2/10.0
$167,500
🖨 Deal sheet 📄 Offer letter ✓ Due diligence
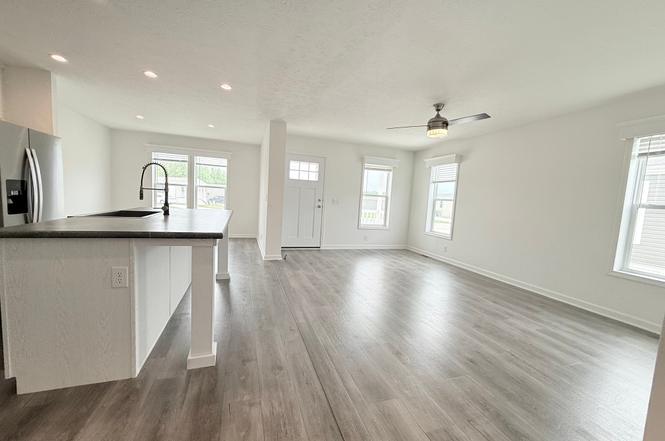
Listing remarks
From the moment you step onto the welcoming front porch, this light-filled home draws you in with a fresh, modern chef's kitchen that balances timeless style with everyday comfort. At the center of the home, the kitchen features sleek appliances, soft white cabinetry, and elegant light-gray countertops-creating a functional and beautiful space for cooking, gathering, and enjoying daily routines. Just beyond, the spacious dining area is framed by large windows that fill the room with natural light, offering the ideal setting for family meals or quiet mornings with coffee. The open living room flows effortlessly from the kitchen, providing ample space to relax, host guests, and take in the vi
Key facts
- Modern chefs kitchen
- Walk in pantry
- Dual sink vanity
Tags
Property features AI
Finance
- Other: Living area of 1350 (value provided by listing)
- Financial info: List price available (information provided in listing)
Exterior
- Utilities: Electric service; Natural gas service; Public water and sewer likely (not explicitly detailed)
- Home design: Spec new construction (Remington Woods plan)
- Construction: New construction; Remington Woods plan
- Exterior features: Asphalt roof
Interior
- Kitchen: Dishwasher; Microwave; Refrigerator
- Bedrooms: 3 bedrooms
- Bathrooms: 2 bathrooms
- Heating & cooling: Forced air heating (electric and natural gas); Central air conditioning
- Interior features: Dishwasher; Microwave; Refrigerator
Neighborhood map
What this means for you Summary
Snapshot
- This is a 3-bed/2.0-bath manufactured listed at $168k.
Deal economics
- At list price, monthly cash flow is $717 ($9k/yr) — positive.
- The deal already cash-flows at list — no discount required.
- Meets the 1% rule at list price ($2k rent vs $168k).
- Recommended offer: $147k (12.0% below list) — sets the bar for market timing.
- Cap rate 11.4% vs local median 2.4% in Channahon — top-decile yield for the area; either an underpriced asset or a hidden risk that comps aren't pricing in. Stress-test before assuming the spread holds.
Location & tenants
- Location reads 78/100 on livability (#143 in IL, #2,614 nationally) — a middle-class / working-renter tenant base. Strengths: crime A+, employment A+, housing A+; Watch: amenities F, commute F.
- Minooka Chsd 111 (suburban): math 28% / reading 36% proficiency, ranked #187 of 620 in IL (top 30%) — families likely to look elsewhere, expect single-tenant / working-renter base with shorter leases.
- Market conditions: 103 active listings in the ZIP; 3 comparable units currently listed for rent nearby; rentals leasing fast (median 10d on market — plan ~1-2 weeks tenant-placement turnaround); 2,028 units permitted in Will County in 2024 (530 in 5+ unit buildings).
Forward outlook
- Local home prices are declining (-3.0%/yr); year-one equity from $1k of loan paydown is wiped out by about $5k of value loss. Plan a longer hold.
- Will County population projected to shrink 4% by 2050 — rents likely to lag national; underwrite the cash flow, not the appreciation.
- At projected returns (-3.0% appreciation + 3.0% rent growth), your $47k cash investment doubles in ~7 years — after that, you're playing with house money.
Negotiation context
- It's been on market 152 days — a 12% lower offer ($147k) is reasonable based on typical stale-listing flexibility.
Questions for the listing agent
- It's been on market 152 days. Have you received any prior offers? Is the seller open to a 12% concession, seller financing, or rate buy-down credit?
- Why hasn't it sold? Are there any deal-killer items the seller is aware of (foundation, flood, title, zoning, code violations)?
- Is there a deadline driving the sale (1031 exchange, divorce, estate, relocation)? That informs how much negotiation room exists.
- What's the average days-on-market for RENTAL listings here right now (not sales)? A rising rental-DOM trend means longer vacancies and softer asking-rent achievability than the comps imply.
- What's the recent tenant-quality profile in this submarket — average credit score on applications, eviction rate, late-payment / NSF rate, and stable-employment percentage? A property-management company in the area should have these aggregated.
- How much new for-sale + rental construction is in the pipeline within 1–3 miles? Heavy new supply typically softens prices + rents 12–24 months out; constrained supply supports both.
Investment metrics
- 1% rule
- 1.42% ✓
- Cap rate
- 11.43%
- Cash-on-cash
- 18.34%
- DSCR
- 1.82
- GRM
- 5.9
CMA / ARV
No comps found within radius.
Projected returns pro-forma
-3.0% appreciation · 3.0% rent growth · sell at horizon
- IRR
- 10.0%
- Equity multiple
- 1.40×
- Total profit
- $18,536
- Equity at exit
- $24,975
- IRR
- 19.1%
- Equity multiple
- 2.60×
- Total profit
- $75,059
- Equity at exit
- $14,482
Cash invested: $46,900 (down + closing). Projections, not guarantees.
Landlord ↔ Tenant lean methodology
- Overall (STATE)
- 43 Moderately Tenant-Leaning
- State Illinois
- 43 Moderately Tenant-Leaning · D+7
- County
- — inherits STATE
- City
- — inherits STATE
ZIP-level market 60410
- Home prices YoY
- -3.2%
- Active inventory
- 103
- Price-to-rent
- 5.9×
Monthly cashflow live
- Estimated rent
- $2,372 medium interval (Pro) →
- Mortgage (P&I)
- −$878
- Tax est. 1.5%
- −$209 /mo · $2,512/yr
- Insurance
- −$70
- HOA
- −$0
- Vacancy / Maint / Mgmt
- −$498
- Net cashflow
- $717
Break-even live
UW: 25.0% down · 7.5% · 30yr · 1.5% tax · 5.0% vac · 8.0% maint · 8.0% mgmt
Financing live
Cash to close
- Down payment
- $41,875
- Closing costs
- $5,025
- Reserves months
- —
- Total cash needed
- —
Loan-product check · same deal, 3 products live
Conventional
25% down · 7.5% · 30yr
- Down + closing
- —
- Monthly P&I
- —
- Monthly cashflow
- —
- DSCR
- —
- Eligible?
- —
Personal DTI + credit; lowest rate.
DSCR
20% down · 8.5% · 30yr
- Down + closing
- —
- Monthly P&I
- —
- Monthly cashflow
- —
- DSCR
- —
- Eligible?
- —
No personal income docs; deal must DSCR.
Hard money
10% down · 12.0% · 12mo
- Down + closing
- —
- Monthly P&I
- —
- Monthly cashflow
- —
- DSCR
- —
- Eligible?
- —
Short-term bridge; refi at stabilization.
Rent comps 3 comps
| Address | Beds | Baths | Sqft | Rent | $/sqft | DOM | Units | Dist |
|---|---|---|---|---|---|---|---|---|
| 22451 S Carrie Ave Channahon, IL | 3.0 | 1.0 | 1176 | $2,200 | $1.87 | 7d | 1 | 0.81mi |
| 1227 Rock Run Crossings Dr Unit 207 Shorewood, IL | 2.0 | 2.0 | 1193 | $2,395 | $2.01 | 10d | 1 | 1.47mi |
| 1227 Rock Run Crossings Dr Unit 107 Shorewood, IL | 2.0 | 2.0 | 1193 | $2,659 | $2.23 | 24d | 1 | 1.47mi |
Listing history 13 events
-
2026-06-18days on market $167,500 Active 152 DOM
-
2026-06-17days on market $167,500 Active 151 DOM
-
2026-06-16days on market $167,500 Active 150 DOM
-
2026-06-15days on market $167,500 Active 149 DOM
-
2026-06-13days on market $167,500 Active 147 DOM
-
2026-06-09days on market $167,500 Active 143 DOM
-
2026-06-08days on market $167,500 Active 142 DOM
-
2026-06-07days on market $167,500 Active 141 DOM
-
2026-06-04pricedays on market $167,500 Active 138 DOM
-
2026-06-03days on market $164,500 Active 137 DOM
-
2026-06-02days on market $164,500 Active 136 DOM
-
2026-06-01days on market $164,500 Active 135 DOM
-
2026-05-31days on market $164,500 Active 134 DOM
ⓘ Source: listings_history table (triggers on properties + properties_extension) + one-shot
backfill from property_details.listing_events for pre-trigger history.
Nearby sold comps map
Loading sold comps map…
Walkable amenities ~0.75 mi
Loading nearby amenities…
Taxation est. · year 1
- Rental income
- $28,469
- − Mortgage interest
- −$9,383
- − Property taxes
- −$2,512
- − Insurance
- −$838
- − Repairs & maintenance
- −$2,277
- − Management
- −$2,277
- − Depreciation
- −$4,873
- Taxable income
- $6,308
- Est. tax owed @ 24.0%
- −$1,514
- After-tax cash flow
- $7,086/yr
For passive investors: Depreciation is non-cash, so a rental often shows a tax loss while cash-flowing — sheltering income. Rental losses are passive: they offset passive income freely, and up to $25,000/yr can offset ordinary (W-2) income if you actively participate and your MAGI is under $100k (phasing out to $0 by $150k); unused losses carry forward. On sale, claimed depreciation is recaptured at up to 25%, and gains may owe capital-gains tax (a 1031 exchange can defer both). Figures are a year-1 estimate at your 24.0% rate — not tax advice; consult a CPA.
Schools (NCES district)
- District
- Minooka Chsd 111
- NCES district ID
- 1726340
- Math proficiency
- 28% ▼ -8.00%
- Reading proficiency
- 36% ▼ -7.00%
- Median HH income
- $81,260
- Composite
- 30.82/100
- National rank
- #6138
- State rank
- #187 of 620 in IL
Livability — Channahon
- Score
- 78/100
- State rank
- #143
- US rank
- #2614
Category grades
Schools grade is shown separately in the Schools card above.
Census & demographics
- Census place
- Channahon, IL
- City population
- 14,027
- Population (ZIP)
- 14,027
Population outlook (Will County) Hauer SSP2
- Today (2025)
- 705,368 people
- By 2030
- 708,154 · +0.4%
- By 2040
- 702,692 · -0.4%
- By 2050
- 680,249 · -3.6%
- By 2075
- 611,990 · -13.2%
- By 2100
- 516,215 · -26.8%
Race, ethnicity, and origin ACS 2023
- Neighborhood character
- Predominantly White (82%)
- Race & ethnicity
- White 82% Hispanic / Latino 14% Two or more races 5%
- Hispanic origin (detail)
- Mexican 7% Puerto Rican 4% Cuban 2%
- Common ancestry
- Romanian 10% Lithuanian 2% Iranian 2%
- Foreign-born
- 3% · Canada
- Languages at home
- 94% English-only · Spanish 5% Other Indo-European 1%
Political lean MEDSL · Will
- 2024 margin
- Toss-up / Even · D 50.1% · R 48.5% · Other 1.4%
- 2008→2024 swing
- -11.6pp toward R · 2008: 13.2pp · 2024: 1.6pp
- All cycles
- 2024: D+1.6 2020: D+8.3 2016: D+5.7 2012: D+3.7 2008: D+13.2
Not yet ingested
- Civics
- —
Market trends
- HPI YoY
- ▼ -7.58%
- Current HPI
- 227.2488
- Rent YoY
- —
- Metro
- —
- State GDP YoY
- ▲ 1.59%
- F500 in state
- 60
Industry mix (Fortune 500 HQ in IL)
| Industry | F500 HQs | Revenue |
|---|---|---|
| Insurance | 4 | $201B |
|
||
| Consumer Goods | 4 | $87B |
|
||
| Industrial Machinery | 3 | $64B |
|
||
| Healthcare | 2 | $55B |
|
||
| Retail / Pharmacy | 1 | $148B |
|
||
| Agriculture / Food | 1 | $86B |
|
||
Cash-flow waterfall
monthlySold comps — $/sqft
last 12 mo · ≤1 miLoading sold comps…