101 S Chestnut St · La Monte, MO
Flood risk 1/10 · Minimal
- FEMA flood zone
- X (unshaded)
- Chance of flooding over 30 yrs
- 0.0%
- Est. flood insurance / yr
- $473 – $860
Fire risk 3/10 · Minor
- Est. fire insurance / yr
- $1,054 – $1,958
Heat risk 4/10 · Minor
- Hot days now (above 106°F)
- 7 days/yr
- Hot days in 30 yrs
- 17 days/yr
Wind risk 2/10 · Minimal
- Chance of severe wind over 30 yrs
- —
Air-quality risk 2/10 · Minimal
- Unhealthy air days now
- 0 days/yr
- Unhealthy air days in 30 yrs
- 1 days/yr
Risk factors via First Street. Map © Google.
Why this score? — see what drove the B+ grade
The composite is a weighted blend of 9 inputs, each scored 0–100. Each bar is that input's sub-score; the figure is the points it added to the 100-point composite (weight × sub-score).
- Cash flow +30.0/30.0
- 1% rule +10.0/10.0
- DSCR +10.0/10.0
- Appreciation +7.7/10.0
- ARV discount +7.5/15.0
- Livability +3.1/5.0
- Schools +2.8/10.0
- Rent growth +2.5/5.0
- Condition / age +2.5/5.0
$57,000
🖨 Deal sheet 📄 Offer letter ✓ Due diligence
Listing remarks
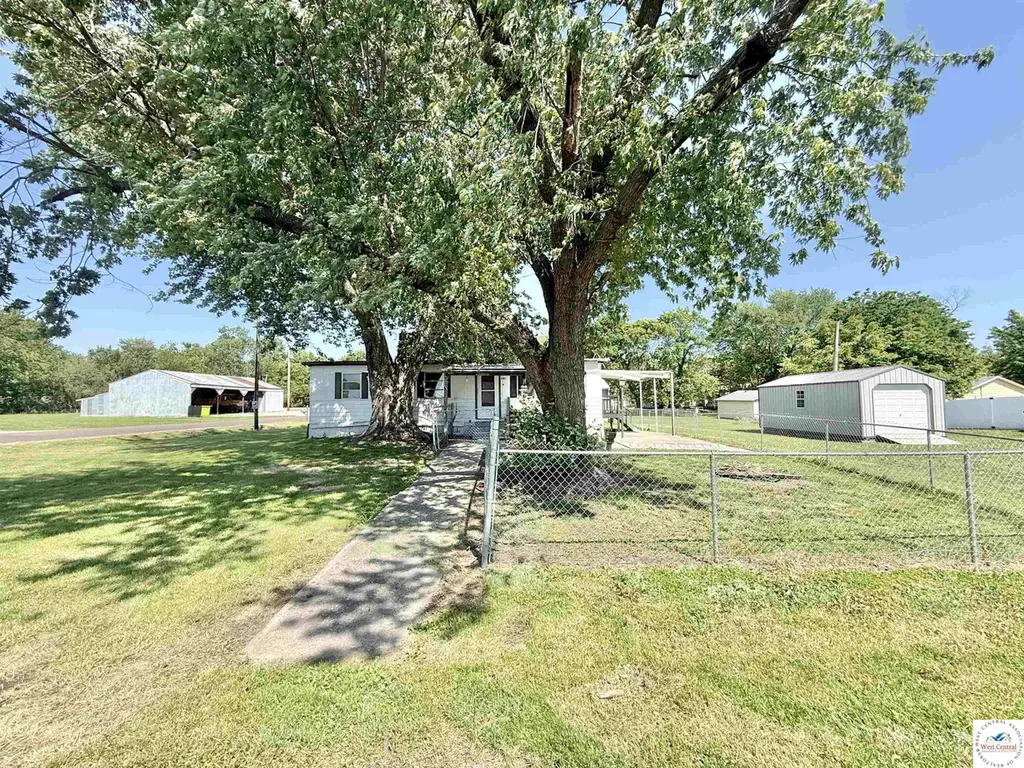
Looking for an affordable property with potential? This 3-bedroom manufactured home offers a great opportunity whether you’re searching for your next investment property or a move-in ready place to call home. Situated on a fenced-in yard, the property also features a patio area and an oversized garage with plenty of room for your vehicle, workshop, storage, or hobby space. Inside, you’ll find several updates already completed including improvements to the kitchen, some newer flooring, an updated bathroom, and more. While the property could still use some TLC, it offers solid potential and is being sold as is. Conveniently located in a central location close to the Air Force Base
Key facts
- Patio area
- Central location
- Fenced-in yard
Tags
Property features AI
Exterior
- Parking: Detached garage; One covered parking space (1 total parking space)
- Home design: Manufactured house (single wide); Single-family residence; Above-grade finished living area (912 square feet); Lot approximately 70 x 100 ft (about 0.1607 acres)
- Construction: Manufactured construction
- Exterior features: Covered porch and patio; Full chain-link fencing
Interior
- Flooring: Carpet; Other
- Bathrooms: One full bathroom
- Heating & cooling: Central air conditioning; Electric cooling
- Interior features: Carpet and other flooring
Neighborhood map
What this means for you Summary
Snapshot
- This is a 3-bed/1.0-bath manufactured listed at $57k.
Deal economics
- At list price, monthly cash flow is $376 ($5k/yr) — positive.
- The deal already cash-flows at list — no discount required.
- Meets the 1% rule at list price ($906 rent vs $57k).
- Recommended offer: $56k (1.5% below list) — sets the bar for market timing.
Location & tenants
- Location reads 62/100 on livability (#393 in MO) — a middle-class / working-renter tenant base. Strengths: cost of living A+, housing A+, crime B+; Watch: schools F, amenities F, commute F.
- La Monte R-IV (rural): math 25% / reading 35% proficiency, ranked #455 of 535 in MO (top 85%) — families likely to look elsewhere, expect single-tenant / working-renter base with shorter leases.
- Market conditions: 9 active listings in the ZIP; 109 units permitted in Pettis County in 2024 (46 in 5+ unit buildings).
Forward outlook
- In year one you build about $3k of equity ($394 loan paydown + $3k appreciation (5.4% local appreciation)).
- Pettis County population projected to shrink 7% by 2050 — rents likely to lag national; underwrite the cash flow, not the appreciation.
- At projected returns (5.4% appreciation + 3.0% rent growth), your $16k cash investment doubles in ~2 years — after that, you're playing with house money.
- By year 9, paydown + projected appreciation supports a ~$31k cash-out refi (75% LTV) — recoverable capital for the next deal without selling this one.
Negotiation context
- It's been on market 16 days — a 2% lower offer ($56k) is reasonable based on typical stale-listing flexibility.
Questions for the listing agent
- Built in 1969 — when were the roof, HVAC, electrical panel, plumbing, and water heater last replaced?
- Is there a deadline driving the sale (1031 exchange, divorce, estate, relocation)? That informs how much negotiation room exists.
- Schools are F-rated, which usually means shorter tenancies and higher turnover. Who's the typical renter profile here, and what's been the actual vacancy rate?
- What's the average days-on-market for RENTAL listings here right now (not sales)? A rising rental-DOM trend means longer vacancies and softer asking-rent achievability than the comps imply.
- What's the recent tenant-quality profile in this submarket — average credit score on applications, eviction rate, late-payment / NSF rate, and stable-employment percentage? A property-management company in the area should have these aggregated.
- How much new for-sale + rental construction is in the pipeline within 1–3 miles? Heavy new supply typically softens prices + rents 12–24 months out; constrained supply supports both.
Investment metrics
- 1% rule
- 1.59% ✓
- Cap rate
- 14.21%
- Cash-on-cash
- 28.28%
- DSCR
- 2.26
- GRM
- 5.2
CMA / ARV
No comps found within radius.
Projected returns pro-forma
5.37% appreciation · 3.0% rent growth · sell at horizon
- IRR
- 38.3%
- Equity multiple
- 3.40×
- Total profit
- $38,294
- Equity at exit
- $33,598
- IRR
- 36.1%
- Equity multiple
- 6.92×
- Total profit
- $94,479
- Equity at exit
- $59,087
Cash invested: $15,960 (down + closing). Projections, not guarantees.
Landlord ↔ Tenant lean methodology
- Overall (STATE)
- 81 Strongly Landlord-Friendly
- State Missouri
- 81 Strongly Landlord-Friendly · R+10
- County
- — inherits STATE
- City
- — inherits STATE
ZIP-level market 65337
- Home prices YoY
- 2.3%
- Active inventory
- 9
- Price-to-rent
- 5.2×
Monthly cashflow live
- Estimated rent
- $906 medium interval (Pro) →
- Mortgage (P&I)
- −$299
- Tax from tax record
- −$17 /mo · $205/yr
- Insurance
- −$24
- HOA
- −$0
- Vacancy / Maint / Mgmt
- −$190
- Net cashflow
- $376
Break-even live
UW: 25.0% down · 7.5% · 30yr · 1.5% tax · 5.0% vac · 8.0% maint · 8.0% mgmt
Financing live
Cash to close
- Down payment
- $14,250
- Closing costs
- $1,710
- Reserves months
- —
- Total cash needed
- —
Loan-product check · same deal, 3 products live
Conventional
25% down · 7.5% · 30yr
- Down + closing
- —
- Monthly P&I
- —
- Monthly cashflow
- —
- DSCR
- —
- Eligible?
- —
Personal DTI + credit; lowest rate.
DSCR
20% down · 8.5% · 30yr
- Down + closing
- —
- Monthly P&I
- —
- Monthly cashflow
- —
- DSCR
- —
- Eligible?
- —
No personal income docs; deal must DSCR.
Hard money
10% down · 12.0% · 12mo
- Down + closing
- —
- Monthly P&I
- —
- Monthly cashflow
- —
- DSCR
- —
- Eligible?
- —
Short-term bridge; refi at stabilization.
Listing history 13 events
-
2026-06-12statusdays on market $57,000 Pending 16 DOM
-
2026-06-09days on market $57,000 Active 15 DOM
-
2026-06-08days on market $57,000 Active 14 DOM
-
2026-06-07days on market $57,000 Active 13 DOM
-
2026-06-05days on market $57,000 Active 10 DOM
-
2026-06-03days on market $57,000 Active 9 DOM
-
2026-06-02days on market $57,000 Active 8 DOM
-
2026-06-01days on market $57,000 Active 7 DOM
-
2026-05-31days on market $57,000 Active 6 DOM
-
2026-05-30days on market $57,000 Active 5 DOM
-
2026-05-22status Pending
-
2026-05-14$57,000 Active
-
2006-10-13soldstatus
ⓘ Source: listings_history table (triggers on properties + properties_extension) + one-shot
backfill from property_details.listing_events for pre-trigger history.
Tax reassessment forecast MO · Resets to sale price
- Current annual tax
- $205 · $17/mo
- Projected year-2 tax
- $553 · $46/mo
- Expected delta
- +$347/yr (+$29/mo · 169.1%)
ⓘ Screening estimate from a state-policy table — verify with the county assessor before closing.
Climate risk First Street
- Flood 1/10 Low FEMA zone X (unshaded) · 0% chance over 30 yrs
- Wildfire 3/10 Moderate
- Heat 4/10 Moderate 7 d/yr ≥106°F today · 17 d/yr by 30 yrs out
- Wind 2/10 Low
- Air quality 2/10 Low 0 unhealthy d/yr today · 1 by 30 yrs out
Nearby sold comps map
Loading sold comps map…
Walkable amenities ~0.75 mi
Loading nearby amenities…
Taxation est. · year 1
- Rental income
- $10,875
- − Mortgage interest
- −$3,193
- − Property taxes
- −$205
- − Insurance
- −$285
- − Repairs & maintenance
- −$870
- − Management
- −$870
- − Depreciation
- −$1,658
- Taxable income
- $3,793
- Est. tax owed @ 24.0%
- −$910
- After-tax cash flow
- $3,603/yr
For passive investors: Depreciation is non-cash, so a rental often shows a tax loss while cash-flowing — sheltering income. Rental losses are passive: they offset passive income freely, and up to $25,000/yr can offset ordinary (W-2) income if you actively participate and your MAGI is under $100k (phasing out to $0 by $150k); unused losses carry forward. On sale, claimed depreciation is recaptured at up to 25%, and gains may owe capital-gains tax (a 1031 exchange can defer both). Figures are a year-1 estimate at your 24.0% rate — not tax advice; consult a CPA.
Schools (NCES district)
- District
- La Monte R-IV
- NCES district ID
- 2916920
- Math proficiency
- 25% ▬ 0.00%
- Reading proficiency
- 35% ▲ 5.00%
- Median HH income
- $43,109
- Composite
- 28.36/100
- National rank
- #12132
- State rank
- #455 of 535 in MO
Livability — La Monte
- Score
- 62/100
- State rank
- #393
- US rank
- #16922
Category grades
Schools grade is shown separately in the Schools card above.
Census & demographics
- Census place
- La Monte, MO
- Population (ZIP)
- 1,786
Population outlook (Pettis County) Hauer SSP2
- Today (2025)
- 41,992 people
- By 2030
- 41,584 · -1.0%
- By 2040
- 40,483 · -3.6%
- By 2050
- 39,049 · -7.0%
- By 2075
- 35,413 · -15.7%
- By 2100
- 30,870 · -26.5%
Race, ethnicity, and origin ACS 2023
- Neighborhood character
- Predominantly White (74%)
- Race & ethnicity
- White 74% Hispanic / Latino 22% Two or more races 4%
- Hispanic origin (detail)
- Mexican 21%
- Common ancestry
- Slovak 1% Portuguese 1% Italian 1%
- Foreign-born
- 12% · Canada
- Languages at home
- 83% English-only · Spanish 16% Other Asian/Pacific 1%
Political lean MEDSL · Pettis
- 2024 margin
- Solid R (+48.8) · D 24.9% · R 73.7% · Other 1.4%
- 2008→2024 swing
- -26.3pp toward R · 2008: -22.4pp · 2024: -48.8pp
- All cycles
- 2024: R+48.8 2020: R+47.5 2016: R+46.9 2012: R+28.8 2008: R+22.4
Not yet ingested
- Civics
- —
Market trends
- HPI YoY
- ▲ 5.37%
- Current HPI
- 236.7412
- Rent YoY
- —
- Metro
- —
- State GDP YoY
- ▲ 1.84%
- F500 in state
- 20
Industry mix (Fortune 500 HQ in MO)
| Industry | F500 HQs | Revenue |
|---|---|---|
| Healthcare | 1 | $163B |
|
||
| Insurance | 1 | $21B |
|
||
| Industrial Technology | 1 | $17B |
|
||
| Retail | 1 | $16B |
|
||
| Industrial Distribution | 1 | $10B |
|
||
| Utilities | 1 | $9B |
|
||
Price history
3 events — show timeline
- 2026-05-22 Pending — WCAR
- 2026-05-14 Listed $57,000 WCAR
- 2006-10-13 Sold (Public Records) — Public Records
Property tax history
+1.5%/yrLatest (2025): $205 · +4.7% YoY. Source: county tax records.
Cash-flow waterfall
monthlySold comps — $/sqft
last 12 mo · ≤1 miLoading sold comps…