 Duplex
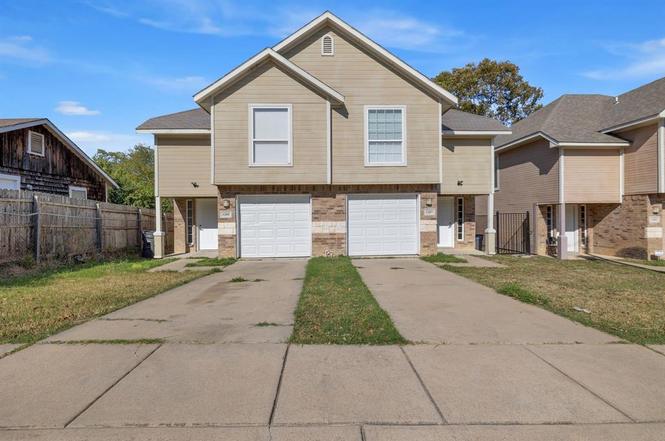
1205 E Powell Ave · Fort Worth, TX
Flood risk 1/10 · Minimal
- FEMA flood zone
- X (unshaded)
- Chance of flooding over 30 yrs
- 0.0%
- Est. flood insurance / yr
- $507 – $1,088
Fire risk 1/10 · Minimal
- Est. fire insurance / yr
- $1,222 – $2,270
Heat risk 8/10 · Major
- Hot days now (above 109°F)
- 7 days/yr
- Hot days in 30 yrs
- 24 days/yr
Wind risk 5/10 · Moderate
- Chance of severe wind over 30 yrs
- 26.0%
Air-quality risk 3/10 · Minor
- Unhealthy air days now
- 3 days/yr
- Unhealthy air days in 30 yrs
- 4 days/yr
Risk factors via First Street. Map © Google.
Why this score? — see what drove the D grade
The composite is a weighted blend of 9 inputs, each scored 0–100. Each bar is that input's sub-score; the figure is the points it added to the 100-point composite (weight × sub-score).
- Cash flow +14.9/30.0
- ARV discount +6.3/15.0
- DSCR +4.6/10.0
- 1% rule +4.2/10.0
- Livability +4.0/5.0
- Rent growth +2.5/5.0
- Condition / age +2.5/5.0
- Schools +2.0/10.0
- Appreciation +0.0/10.0
$389,000
🖨 Deal sheet (PDF) 📄 Offer letter ✓ Due diligence
Multi-family units
County records classify this as Multi-Family (2-4 Unit). Listing-text estimate: 2 units. confirmed
Listing remarks MLS
This is a Fannie Mae HomePath property. Nice, full-duplex, 3 bedroom, 2.5 baths, 1 car garage each side. Please verify schools, taxes, sq ft, measurements, information, hoa, etc. . AS-IS.
Key facts
- Fully renovated
- Fresh paint
- Brick duplex
Tags
Property features AI
Finance
- Financial info: Gross annual income: 40800.00; Gross annual expenses: 6156.00; Insurance expense: 3500.00; Net operating income: 30800.00; Capitalization rate: 7.92%
- HOA & community: No association
Exterior
- Parking: Driveway; Garage; Additional parking; 4 parking spaces
- Utilities: City water; City sewer; Individual water meter; Sidewalk; Not in a municipal utility district
- Home design: Duplex (residential income); Two levels; Subdivision: Vickery Southeast Add; Complex name: 1205 Powell
- Construction: Built in 2006; Brick and siding construction; Shingle roof; Slab foundation
- Exterior features: City water; City sewer; Individual water meter; Sidewalk
Interior
- Kitchen: Dishwasher; Electric oven; Electric range; Refrigerator
- Flooring: Laminate; Luxury vinyl plank
- Heating & cooling: Central heating; Central air conditioning
- Interior features: Open floorplan; Pantry; High-speed internet available; Smart home features
Neighborhood map
What this means for you Summary
Snapshot
- This is a 2 × 3-bed/1.0-bath units multifamily listed at $389k.
Deal economics
- At list price, monthly cash flow is $115 ($1k/yr) — positive. Per door: $58/mo.
- The deal already cash-flows at list — no discount required.
- To meet the 1% rule (rent ≥ 1% of price), the offer needs to be $358k (7.9% below list).
- Recommended offer: $358k (7.9% below list) — sets the bar for 1% rule.
- Cap rate 6.6% vs local median 3.9% in Fort Worth — top-decile yield for the area; either an underpriced asset or a hidden risk that comps aren't pricing in. Stress-test before assuming the spread holds.
Location & tenants
- Location reads 80/100 on livability (#49 in TX, #1,954 nationally) — a professional / high-income tenant draw. Strengths: amenities A+, cost of living A+, housing A+; Watch: crime F.
- Fort Worth ISD (urban): math 18% / reading 28% proficiency, ranked #742 of 826 in TX (top 90%) — low school quality limits family demand, transient renter base, plan for 1-2y turnover; 73% free/reduced lunch — lower-income household profile, screen leases tightly.
- Zoned schools: Carroll Peak El (math 17% / reading 17%, grade F, #3,836 of 4,322 statewide, top 91%, 459 students, 97% FRL) — zoned schools average 97% FRL vs 73% district-wide (24 pts higher); higher-poverty schools than district average — tighter screening recommended.
- Market conditions: Rents flat; 176 active listings in the ZIP; 2 comparable units currently listed for rent nearby; 18,938 units permitted in Tarrant County in 2024 (8,336 in 5+ unit buildings).
- At $3,583/mo this rent would consume 70% of the median local household income ($62k/yr) (locally 1060% of renters already pay >50% of income on rent) — very limited rent-growth headroom before tenants either downsize or default.
Forward outlook
- Local home prices are declining (-3.0%/yr); year-one equity from $3k of loan paydown is wiped out by about $12k of value loss. Plan a longer hold.
- Tarrant County population projected at +41% by 2050 — long-run rental-demand tailwind backs the buy-and-hold thesis.
Negotiation context
- Only 10 days on market — expect competitive offers; lowballing is unlikely to land.
- 4 sale attempts since 20y ago with the ask held roughly flat each time — persistent listings suggest the price (not the market) is what's stuck; bring a comps-based counter.
Risks & watch-outs
- Climate carrying-cost: moderate wind risk, 26% chance of damaging wind over 30y; extreme-heat days projected 7→24/yr by 2055 (HVAC capex compounding) — expect insurance premiums to compound above CPI over the hold.
Questions for the listing agent
- Can we see the unit-by-unit rent roll, current vacancy, and any below-market leases? What's the average tenancy length?
- What capital expenditures (roof, boiler, parking lot, exteriors) have been made in the last 5 years, and what's planned in the next 2?
- Is there a deadline driving the sale (1031 exchange, divorce, estate, relocation)? That informs how much negotiation room exists.
- Schools are D-rated, which usually means shorter tenancies and higher turnover. Who's the typical renter profile here, and what's been the actual vacancy rate?
- Crime grade is F in this area — have there been break-ins, vandalism, or insurance claims at this property in the last 3 years? What carrier currently insures it and at what premium?
- The area grade is low — what's the realistic commute time and amenity access for the typical tenant pool here? Any planned neighborhood developments (good or bad) we should know about?
- What's the average days-on-market for RENTAL listings here right now (not sales)? A rising rental-DOM trend means longer vacancies and softer asking-rent achievability than the comps imply.
- What's the recent tenant-quality profile in this submarket — average credit score on applications, eviction rate, late-payment / NSF rate, and stable-employment percentage? A property-management company in the area should have these aggregated.
- How much new apartment / multifamily construction is in the pipeline within 1–3 miles? Heavy new supply (>2% of stock underway) typically softens rents 12–24 months out; light construction supports rent growth.
Investment metrics
- 1% rule
- 0.92% ✗
- Cap rate
- 6.65%
- Cash-on-cash
- 1.27%
- DSCR
- 1.06
- GRM
- 9.0
CMA / ARV
- ARV (on-the-fly)
- $379,216
- Comps found
- 1
Show comp detail 1 sale within ~0.75 mi
| Address | Dist | Beds/Ba | Sqft | Sold | Price | $/sf | Match |
|---|---|---|---|---|---|---|---|
| 2204 Ash Crescent St | 0.56mi | 6/5.0 | 2,668 (-4%) | 10mo | $365,000 | $137 | 55 |
Match score weights: distance 35% · size 25% · config 20% · recency 20%. Top-matched comps best support the ARV.
Projected returns pro-forma
-3.0% appreciation · 0.05% rent growth · sell at horizon
- IRR
- -17.7%
- Equity multiple
- 0.39×
- Total profit
- $-65,941
- Equity at exit
- $58,001
- IRR
- -16.8%
- Equity multiple
- 0.20×
- Total profit
- $-87,627
- Equity at exit
- $33,634
Cash invested: $108,920 (down + closing). Projections, not guarantees.
Landlord ↔ Tenant lean methodology
- Overall (STATE)
- 87 Strongly Landlord-Friendly
- State Texas
- 87 Strongly Landlord-Friendly · R+5
- County
- — inherits STATE
- City
- — inherits STATE
ZIP-level market 76104
- Home prices YoY
- -11.6%
- Rents YoY
- 0.1%
- Active inventory
- 176
- Price-to-rent
- 18.1×
Monthly cashflow live
- Estimated rent
- $3,583 high interval (Pro) →
- Mortgage (P&I)
- −$2,040
- Tax from tax record
- −$513 /mo · $6,157/yr
- Insurance
- −$162
- HOA
- −$0
- Vacancy / Maint / Mgmt
- −$752
- Net cashflow
- $115
Break-even live
Sensitivity live
| Price | -10% $336 | -5% $226 | +0% $115 | +5% $5 | +10% $-105 |
|---|---|---|---|---|---|
| Rent | -10% $-168 | -5% $-26 | +0% $115 | +5% $257 | +10% $399 |
| Rate | -1.0pp $311 | -0.5pp $214 | base $115 | +0.5pp $15 | +1.0pp $-88 |
2-unit breakdown (identical units grouped — click to expand)
| Units | Beds | Baths | Est. rent |
|---|---|---|---|
| 2× units | 3 | 1 | $3,584 |
| #1 | 3 | 1 | $1,792 |
| #2 | 3 | 1 | $1,792 |
| Total (2 units) | $3,583 | ||
UW: 25.0% down · 7.5% · 30yr · 1.5% tax · 5.0% vac · 8.0% maint · 8.0% mgmt
Financing live
Cash to close
- Down payment
- $97,250
- Closing costs
- $11,670
- Reserves months
- —
- Total cash needed
- —
Loan-product check · same deal, 3 products live
Conventional
25% down · 7.5% · 30yr
- Down + closing
- —
- Monthly P&I
- —
- Monthly cashflow
- —
- DSCR
- —
- Eligible?
- —
Personal DTI + credit; lowest rate.
DSCR
20% down · 8.5% · 30yr
- Down + closing
- —
- Monthly P&I
- —
- Monthly cashflow
- —
- DSCR
- —
- Eligible?
- —
No personal income docs; deal must DSCR.
Hard money
10% down · 12.0% · 12mo
- Down + closing
- —
- Monthly P&I
- —
- Monthly cashflow
- —
- DSCR
- —
- Eligible?
- —
Short-term bridge; refi at stabilization.
Rent comps 2 comps
| Address | Beds | Baths | Sqft | Rent | $/sqft | DOM | Units | Dist |
|---|---|---|---|---|---|---|---|---|
| 2737 Stuart Dr Fort Worth, TX | 5.0 | 2.0 | 2132 | $1,749 | $0.82 | 23d | 1 | 0.85mi |
| 2722 Travis Ave Fort Worth, TX | 6.0 | 3.0 | 3876 | $3,100 | $0.80 | 26d | 1 | 1.32mi |
Listing history 7 events
-
2026-06-21days on market $389,000 Active 10 DOM
-
2026-06-18days on market $389,000 Active 7 DOM
-
2026-06-17days on market $389,000 Active 6 DOM
-
2026-06-16days on market $389,000 Active 5 DOM
-
2026-06-15days on market $389,000 Active 4 DOM
-
2026-06-13remarks 390-char remark
-
2026-06-13$389,000 Active 2 DOM
ⓘ Source: listings_history table (triggers on properties + properties_extension) + one-shot
backfill from property_details.listing_events for pre-trigger history.
Tax reassessment forecast TX · Resets to sale price
- Current annual tax
- $6,157 · $513/mo
- Projected year-2 tax
- $7,119 · $593/mo
- Expected delta
- +$962/yr (+$80/mo · 15.6%)
ⓘ Screening estimate from a state-policy table — verify with the county assessor before closing.
Climate risk First Street
- Flood 1/10 Low FEMA zone X (unshaded) · 0% chance over 30 yrs
- Wildfire 1/10 Low
- Heat 8/10 Severe 7 d/yr ≥109°F today · 24 d/yr by 30 yrs out
- Wind 5/10 Major 26% chance of damaging wind over 30 yrs
- Air quality 3/10 Moderate 3 unhealthy d/yr today · 4 by 30 yrs out
Nearby sold comps map
Loading sold comps map…
Walkable amenities ~0.75 mi
Loading nearby amenities…
Taxation est. · year 1
- Rental income
- $42,996
- − Mortgage interest
- −$21,790
- − Property taxes
- −$6,157
- − Insurance
- −$1,945
- − Repairs & maintenance
- −$3,440
- − Management
- −$3,440
- − Depreciation
- −$11,316
- Taxable loss
- −$5,092
- Est. tax savings @ 24.0%
- +$1,222
- After-tax cash flow
- $2,608/yr
For passive investors: Depreciation is non-cash, so a rental often shows a tax loss while cash-flowing — sheltering income. Rental losses are passive: they offset passive income freely, and up to $25,000/yr can offset ordinary (W-2) income if you actively participate and your MAGI is under $100k (phasing out to $0 by $150k); unused losses carry forward. On sale, claimed depreciation is recaptured at up to 25%, and gains may owe capital-gains tax (a 1031 exchange can defer both). Figures are a year-1 estimate at your 24.0% rate — not tax advice; consult a CPA.
Schools (NCES district)
- District
- Fort Worth ISD
- NCES district ID
- 4819700
- Math proficiency
- 18% ▼ -16.00%
- Reading proficiency
- 28% ▼ -6.00%
- Median HH income
- $42,109
- Composite
- 19.61/100
- National rank
- #8753
- State rank
- #742 of 826 in TX
Livability — Fort Worth
- Score
- 80/100
- State rank
- #49
- US rank
- #1954
Category grades
Schools grade is shown separately in the Schools card above.
Census & demographics
- Census place
- Fort Worth, TX
- County
- Tarrant County · 2,033,669 people
- City population
- 911,619
- Metro
- Dallas-Fort Worth-Arlington, TX
- Population (ZIP)
- 20,443
- Household income
- $61,658
- Rent vs Own
- Severe rent burden
- 1060.0
Population outlook (Tarrant County) Hauer SSP2
- Today (2025)
- 2,380,417 people
- By 2030
- 2,578,900 · +8.3%
- By 2040
- 2,974,995 · +25.0%
- By 2050
- 3,350,489 · +40.8%
- By 2075
- 4,216,909 · +77.2%
- By 2100
- 4,741,527 · +99.2%
Race, ethnicity, and origin ACS 2023
- Neighborhood character
- Diverse neighborhood (Simpson 0.67)
- Race & ethnicity
- Hispanic / Latino 45% Black 28% White 21% Two or more races 17% Asian 2%
- Hispanic origin (detail)
- Mexican 41% Cuban 1%
- Common ancestry
- Lithuanian 1% Italian 1% Arab 1%
- Foreign-born
- 21% · Canada, Vietnam, Philippines
- Languages at home
- 58% English-only · Spanish 37% Arabic 1% Other Indo-European 1%
Political lean MEDSL · Tarrant
- 2024 margin
- Lean R (+5.1) · D 46.7% · R 51.9% · Other 1.4%
- 2008→2024 swing
- +6.6pp toward D · 2008: -11.7pp · 2024: -5.1pp
- All cycles
- 2024: R+5.1 2020: D+0.2 2016: R+8.7 2012: R+15.7 2008: R+11.7
Not yet ingested
- Civics
- —
Market trends
- HPI YoY
- ▼ -36.10%
- Current HPI
- 276.383
- Rent YoY
- ▬ 0.05%
- Metro
- Dallas-Fort Worth-Arlington, TX
- State GDP YoY
- ▲ 3.95%
- F500 in state
- 110
Industry mix (Fortune 500 HQ in TX)
| Industry | F500 HQs | Revenue |
|---|---|---|
| Energy | 16 | $1,198B |
|
||
| Technology | 5 | $198B |
|
||
| Engineering / Construction | 4 | $72B |
|
||
| Energy Services | 3 | $60B |
|
||
| Utilities | 3 | $41B |
|
||
| Healthcare | 2 | $330B |
|
||
Price history
+3436.4% since first listed13 events — show timeline
- 2026-06-05 Listed $389,000 NTREIS
- 2026-04-26 Listing Removed — NTREIS
- 2026-03-11 Price Changed $410,000 NTREIS
- 2025-11-26 Listed $425,000 NTREIS
- 2023-05-25 Sold (Public Records) — Public Records
- 2023-05-25 Sold (Public Records) — Public Records
- 2010-05-26 Sold (MLS) — NTREIS
- 2010-04-23 Listing Removed — NTREIS
- 2010-03-26 Listed $61,500 NTREIS
- 2006-09-05 Sold (Public Records) — Public Records
- 2006-08-31 Sold (MLS) — NTREIS
- 2006-08-01 Listing Removed — NTREIS
- 2006-05-12 Listed $11,000 NTREIS
Property tax history
+7.1%/yrLatest (2025): $6,157 · -12.9% YoY. Source: county tax records.
Cash-flow waterfall
monthlySold comps — $/sqft
last 12 mo · ≤1 miLoading sold comps…