1139 Fayes Frst · Clinton, AR
Flood risk 7/10 · Major
- FEMA flood zone
- —
- Chance of flooding over 30 yrs
- 0.99%
- Est. flood insurance / yr
- —
Fire risk 4/10 · Minor
- Est. fire insurance / yr
- $1,499 – $2,785
Heat risk 6/10 · Moderate
- Hot days now (above 108°F)
- 7 days/yr
- Hot days in 30 yrs
- 21 days/yr
Wind risk 3/10 · Minor
- Chance of severe wind over 30 yrs
- 4.0%
Air-quality risk 2/10 · Minimal
- Unhealthy air days now
- 1 days/yr
- Unhealthy air days in 30 yrs
- 1 days/yr
Risk factors via First Street. Map © Google.
Why this score? — see what drove the D- grade
The composite is a weighted blend of 9 inputs, each scored 0–100. Each bar is that input's sub-score; the figure is the points it added to the 100-point composite (weight × sub-score).
- Appreciation +10.0/10.0
- ARV discount +8.7/15.0
- Cash flow +5.0/30.0
- Schools +3.7/10.0
- Livability +3.7/5.0
- Rent growth +2.5/5.0
- Condition / age +2.5/5.0
- 1% rule +0.0/10.0
- DSCR +0.0/10.0
$255,000
🖨 Deal sheet 📄 Offer letter ✓ Due diligence
Listing remarks
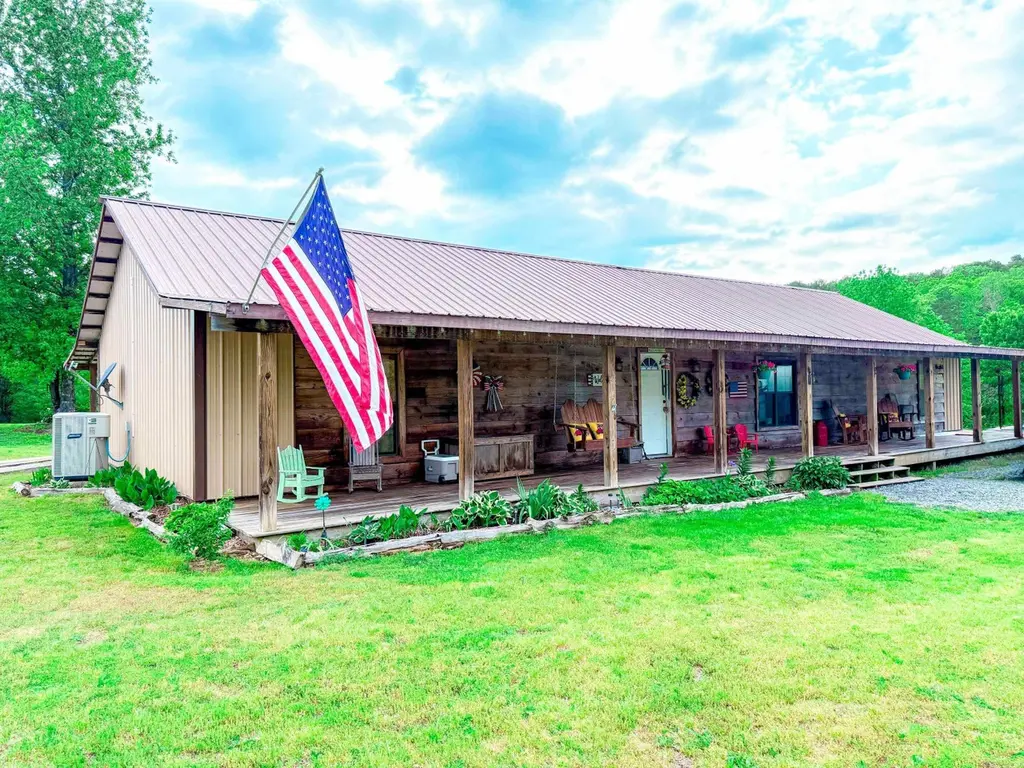
Rustic charm meets modern comfort in this beautiful 3 bedroom, 2 bath home with an office, situated on 2.51 +/- peaceful acres. From the inviting porches to the spacious open-concept interior, this home offers the perfect blend of country living and updated style. Inside, you’ll find a stunning new kitchen with gorgeous countertops, new appliances, abundant cabinetry, and plenty of prep space. The vaulted living area features soaring ceilings and luxury vinyl flooring throughout. The spacious primary suite offers a relaxing retreat, while the dedicated office provides the perfect work-from-home setup. Additional features include a laundry room, two storage sheds for extra storage, and
Key facts
- 2.51 acre lot
- Built 2012
- Listed 52 days
Property features AI
Finance
- Financial info: Financing options include VA, FHA, conventional, cash, and Rural Development
Exterior
- Utilities: Public water; Septic; Electric via co-op; Fiber internet available
- Home design: Metal/vinyl siding exterior; Other exterior details (see remarks)
- Construction: Metal roof; Slab foundation
- Exterior features: Porch; Outside storage area; Sloped, level, cleared lot; Inside city limits; Located in a subdivision
Interior
- Kitchen: Free-standing stove; Dishwasher; Refrigerator stays
- Bedrooms: Office/Study (other room listed); Laundry (other room listed)
- Flooring: Luxury vinyl
- Bathrooms: 2 full bathrooms
- Heating & cooling: Central electric heat; Central electric cooling
- Interior features: Washer connection; Electric dryer connection; Electric water heater; Ceiling fans; Vaulted ceiling
- Laundry & utility: Washer connection; Electric dryer connection
Neighborhood map
What this means for you Summary
Snapshot
- This is a 3-bed/2.0-bath single-family listed at $255k.
Deal economics
- At list price, monthly cash flow is $-598 ($-7k/yr) — negative.
- To cash-flow at today's rent, offer at most $149k (41.4% below list).
- To meet the 1% rule (rent ≥ 1% of price), the offer needs to be $116k (54.6% below list).
- Recommended offer: $116k (54.6% below list) — sets the bar for 1% rule.
Location & tenants
- Location reads 74/100 on livability (#15 in AR, #4,397 nationally) — a middle-class / working-renter tenant base. Strengths: cost of living A+, housing A+, health & safety A+; Watch: schools C-, amenities F, commute F.
- Clinton School District (rural): math 46% / reading 45% proficiency, ranked #41 of 238 in AR (top 17%) — families likely to look elsewhere, expect single-tenant / working-renter base with shorter leases; 68% free/reduced lunch — lower-income household profile, screen leases tightly.
- Market conditions: 100 active listings in the ZIP; 16 units permitted in Van Buren County in 2024 (0 in 5+ unit buildings).
Forward outlook
- In year one you build about $27k of equity ($2k loan paydown + $26k appreciation (10.0% local appreciation)).
- Van Buren County population projected at -27% by 2050 — secular population decline; favor cash flow + early exit over multi-decade hold.
- By year 2, paydown + projected appreciation supports a ~$44k cash-out refi (75% LTV) — recoverable capital for the next deal without selling this one.
Negotiation context
- It's been on market 53 days — a 3% lower offer ($247k) is reasonable based on typical stale-listing flexibility.
Risks & watch-outs
- Climate carrying-cost: major flood risk; extreme-heat days projected 7→21/yr by 2055 (HVAC capex compounding) — expect insurance premiums to compound above CPI over the hold.
Questions for the listing agent
- What do current leases actually rent for vs. the listed asking? Can we see a recent rent roll and the last 12 months of T-12 income?
- It's been on market 53 days. Have you received any prior offers? Is the seller open to a 55% concession, seller financing, or rate buy-down credit?
- Is there a deadline driving the sale (1031 exchange, divorce, estate, relocation)? That informs how much negotiation room exists.
- The area grade is low — what's the realistic commute time and amenity access for the typical tenant pool here? Any planned neighborhood developments (good or bad) we should know about?
- What's the average days-on-market for RENTAL listings here right now (not sales)? A rising rental-DOM trend means longer vacancies and softer asking-rent achievability than the comps imply.
- What's the recent tenant-quality profile in this submarket — average credit score on applications, eviction rate, late-payment / NSF rate, and stable-employment percentage? A property-management company in the area should have these aggregated.
- How much new for-sale + rental construction is in the pipeline within 1–3 miles? Heavy new supply typically softens prices + rents 12–24 months out; constrained supply supports both.
Investment metrics
- 1% rule
- 0.45% ✗
- Cap rate
- 3.48%
- Cash-on-cash
- -10.05%
- DSCR
- 0.55
- GRM
- 18.3
CMA / ARV
- ARV (median comp)
- $262,247
- List price
- $255,000
- Delta
- -2.76%
- Verdict
- FAIR
- Comps
- 12 within 1.0 mi
Show comp detail 2 sales within ~0.75 mi
| Address | Dist | Beds/Ba | Sqft | Sold | Price | $/sf | Match |
|---|---|---|---|---|---|---|---|
| 257 Steve St | 0.14mi | 2/2.5 (-1) | 2,139 (+6%) | 23mo | $345,000 | $161 | 57 |
| 1148 Highway 16 | 0.72mi | 4/3.0 (+1) | 2,031 (+1%) | 13mo | $220,000 | $108 | 45 |
Match score weights: distance 35% · size 25% · config 20% · recency 20%. Top-matched comps best support the ARV.
Projected returns pro-forma
10.0% appreciation · 3.0% rent growth · sell at horizon
- IRR
- 17.2%
- Equity multiple
- 2.41×
- Total profit
- $100,674
- Equity at exit
- $229,724
- IRR
- 16.3%
- Equity multiple
- 5.57×
- Total profit
- $326,136
- Equity at exit
- $495,409
Cash invested: $71,400 (down + closing). Projections, not guarantees.
Landlord ↔ Tenant lean methodology
- Overall (STATE)
- 92 Strongly Landlord-Friendly
- State Arkansas
- 92 Strongly Landlord-Friendly · R+14
- County
- — inherits STATE
- City
- — inherits STATE
ZIP-level market 72031
- Home prices YoY
- 5.2%
- Active inventory
- 100
- Price-to-rent
- 18.3×
Monthly cashflow live
- Estimated rent
- $1,159 medium interval (Pro) →
- Mortgage (P&I)
- −$1,337
- Tax from tax record
- −$70 /mo · $835/yr
- Insurance
- −$106
- HOA
- −$0
- Vacancy / Maint / Mgmt
- −$243
- Net cashflow
- $-598
Break-even live
UW: 25.0% down · 7.5% · 30yr · 1.5% tax · 5.0% vac · 8.0% maint · 8.0% mgmt
Financing live
Cash to close
- Down payment
- $63,750
- Closing costs
- $7,650
- Reserves months
- —
- Total cash needed
- —
Loan-product check · same deal, 3 products live
Conventional
25% down · 7.5% · 30yr
- Down + closing
- —
- Monthly P&I
- —
- Monthly cashflow
- —
- DSCR
- —
- Eligible?
- —
Personal DTI + credit; lowest rate.
DSCR
20% down · 8.5% · 30yr
- Down + closing
- —
- Monthly P&I
- —
- Monthly cashflow
- —
- DSCR
- —
- Eligible?
- —
No personal income docs; deal must DSCR.
Hard money
10% down · 12.0% · 12mo
- Down + closing
- —
- Monthly P&I
- —
- Monthly cashflow
- —
- DSCR
- —
- Eligible?
- —
Short-term bridge; refi at stabilization.
Listing history 17 events
-
2026-06-19days on market $255,000 Active 53 DOM
-
2026-06-18days on market $255,000 Active 52 DOM
-
2026-06-17days on market $255,000 Active 51 DOM
-
2026-06-16days on market $255,000 Active 50 DOM
-
2026-06-15days on market $255,000 Active 49 DOM
-
2026-06-14days on market $255,000 Active 47 DOM
-
2026-06-12days on market $255,000 Active 46 DOM
-
2026-06-09days on market $255,000 Active 43 DOM
-
2026-06-08days on market $255,000 Active 42 DOM
-
2026-06-07days on market $255,000 Active 41 DOM
-
2026-06-07days on market $255,000 Active 40 DOM
-
2026-06-04statusdays on market $255,000 Active 37 DOM
-
2026-06-02days on market $255,000 Price Change 36 DOM
-
2026-06-01days on market $255,000 Price Change 35 DOM
-
2026-05-31days on market $255,000 Price Change 34 DOM
-
2026-05-31days on market $255,000 Price Change 33 DOM
-
2026-04-27$265,000 New Listing 999-char remark
ⓘ Source: listings_history table (triggers on properties + properties_extension) + one-shot
backfill from property_details.listing_events for pre-trigger history.
Tax reassessment forecast AR · Resets to sale price
- Current annual tax
- $835 · $70/mo
- Projected year-2 tax
- $1,632 · $136/mo
- Expected delta
- +$797/yr (+$66/mo · 95.4%)
ⓘ Screening estimate from a state-policy table — verify with the county assessor before closing.
Climate risk First Street
- Flood 7/10 Severe 99% chance over 30 yrs
- Wildfire 4/10 Moderate
- Heat 6/10 Major 7 d/yr ≥108°F today · 21 d/yr by 30 yrs out
- Wind 3/10 Moderate 4% chance of damaging wind over 30 yrs
- Air quality 2/10 Low 1 unhealthy d/yr today · 1 by 30 yrs out
Nearby sold comps map
Loading sold comps map…
Walkable amenities ~0.75 mi
Loading nearby amenities…
Taxation est. · year 1
- Rental income
- $13,904
- − Mortgage interest
- −$14,284
- − Property taxes
- −$835
- − Insurance
- −$1,275
- − Repairs & maintenance
- −$1,112
- − Management
- −$1,112
- − Depreciation
- −$7,418
- Taxable loss
- −$12,133
- Est. tax savings @ 24.0%
- +$2,912
- After-tax cash flow
- $-4,261/yr
For passive investors: Depreciation is non-cash, so a rental often shows a tax loss while cash-flowing — sheltering income. Rental losses are passive: they offset passive income freely, and up to $25,000/yr can offset ordinary (W-2) income if you actively participate and your MAGI is under $100k (phasing out to $0 by $150k); unused losses carry forward. On sale, claimed depreciation is recaptured at up to 25%, and gains may owe capital-gains tax (a 1031 exchange can defer both). Figures are a year-1 estimate at your 24.0% rate — not tax advice; consult a CPA.
Schools (NCES district)
- District
- Clinton School District
- NCES district ID
- 0504410
- Math proficiency
- 46% ▼ -10.00%
- Reading proficiency
- 45% ▼ -12.00%
- Median HH income
- $32,018
- Composite
- 37.34/100
- National rank
- #4438
- State rank
- #41 of 238 in AR
Livability — Clinton
- Score
- 74/100
- State rank
- #15
- US rank
- #4397
Category grades
Schools grade is shown separately in the Schools card above.
Census & demographics
- Census place
- Clinton, AR
- Population (ZIP)
- 7,108
Population outlook (Van Buren County) Hauer SSP2
- Today (2025)
- 15,459 people
- By 2030
- 14,645 · -5.3%
- By 2040
- 12,918 · -16.4%
- By 2050
- 11,263 · -27.1%
- By 2075
- 7,870 · -49.1%
- By 2100
- 4,918 · -68.2%
Race, ethnicity, and origin ACS 2023
- Neighborhood character
- Predominantly White (93%)
- Race & ethnicity
- White 93% Hispanic / Latino 5% Two or more races 3%
- Common ancestry
- Slovak 4% Serbian 2% Romanian 1%
- Foreign-born
- 2% · Canada
- Languages at home
- 95% English-only · Spanish 5%
Political lean MEDSL · Van Buren
- 2024 margin
- Solid R (+60.2) · D 18.9% · R 79.0% · Other 2.1%
- 2008→2024 swing
- -28.5pp toward R · 2008: -31.7pp · 2024: -60.2pp
- All cycles
- 2024: R+60.2 2020: R+56.9 2016: R+53.9 2012: R+39.5 2008: R+31.7
Not yet ingested
- Civics
- —
Market trends
- HPI YoY
- ▲ 12.08%
- Current HPI
- 244.9609
- Rent YoY
- —
- Metro
- —
- State GDP YoY
- ▲ 3.80%
- F500 in state
- 10
Industry mix (Fortune 500 HQ in AR)
| Industry | F500 HQs | Revenue |
|---|---|---|
| Retail | 1 | $681B |
|
||
| Food / Agriculture | 1 | $53B |
|
||
| Retail / Energy | 1 | $22B |
|
||
| Transportation / Logistics | 1 | $12B |
|
||
| Energy | 1 | $4B |
|
||
Price history
-3.8% since first listed2 events — show timeline
- 2026-05-28 Price Changed $255,000 CARMLS
- 2026-04-27 Listed $265,000 CARMLS
Property tax history
-0.2%/yrLatest (2025): $835 · -2.8% YoY. Source: county tax records.
Cash-flow waterfall
monthlySold comps — $/sqft
last 12 mo · ≤1 miLoading sold comps…