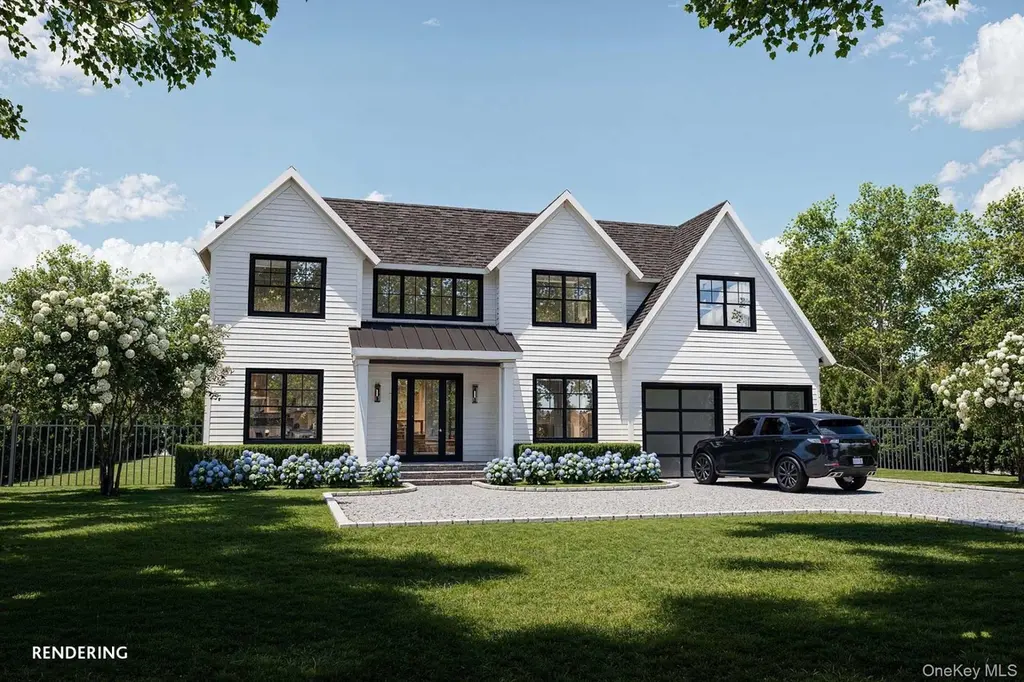
12 Peconic Bay Ave · North Sea, NY
Flood risk 1/10 · Minimal
- FEMA flood zone
- X (unshaded)
- Chance of flooding over 30 yrs
- 0.0%
- Est. flood insurance / yr
- $507 – $1,088
Fire risk 2/10 · Minimal
- Est. fire insurance / yr
- $691 – $1,283
Heat risk 4/10 · Minor
- Hot days now (above 90°F)
- 7 days/yr
- Hot days in 30 yrs
- 20 days/yr
Wind risk 8/10 · Major
- Chance of severe wind over 30 yrs
- 80.0%
Air-quality risk 3/10 · Minor
- Unhealthy air days now
- 2 days/yr
- Unhealthy air days in 30 yrs
- 3 days/yr
Risk factors via First Street. Map © Google.
Why this score? — see what drove the F grade
The composite is a weighted blend of 9 inputs, each scored 0–100. Each bar is that input's sub-score; the figure is the points it added to the 100-point composite (weight × sub-score).
- Cash flow +5.7/30.0
- Rent growth +5.0/5.0
- Schools +4.8/10.0
- Livability +2.9/5.0
- Condition / age +2.5/5.0
- 1% rule +1.2/10.0
- DSCR +0.1/10.0
- ARV discount +0.0/15.0
- Appreciation +0.0/10.0
$3,895,000
🖨 Deal sheet 📄 Offer letter ✓ Due diligence
Listing remarks
Set within Southampton's coveted bayside corridor, this 2026 new construction offers the easy luxury of a private street, deeded Peconic Bay beach access, and effortless proximity to waterfront dining. Built by Cusumano Custom Homes and designed by Ryan Kesner, the 4,500 +/- SF traditional residence offers 5 bedrooms, 6.5 baths, and a thoughtful modern layout on . 34 acres. The main level features a bright great room, formal dining area, open-concept kitchen with premium appliances, a bedroom with en suite bath, mudroom, pantry, and access to the attached 2-car garage. Outdoor living centers around a covered bluestone patio and heated gunite pool, creating an easy setting for summer enterta
Key facts
- Private gym
- Heated gunite pool
- Finished lower level
Tags
Neighborhood map
What this means for you Summary
Snapshot
- This is a 5-bed/6.5-bath land listed at $3.90M.
Deal economics
- At list price, monthly cash flow is $-8k ($-96k/yr) — negative.
- To cash-flow at today's rent, offer at most $2.74M (29.7% below list).
- To meet the 1% rule (rent ≥ 1% of price), the offer needs to be $2.40M (38.5% below list).
- Recommended offer: $2.40M (38.5% below list) — sets the bar for 1% rule.
- Cap rate 3.8% vs local median 6.5% in North Sea — below-typical yield; the buyer is paying a premium for something (appreciation thesis, condition, location) that the cap rate doesn't capture.
Location & tenants
- Location reads 58/100 on livability (#1,063 in NY) — a working-class tenant base; expect higher turnover. Strengths: crime A+, employment A+; Watch: housing C-, amenities F, commute F.
- Southampton Union Free School District (suburban): math 53% / reading 51% proficiency, ranked #293 of 590 in NY (top 50%) — acceptable for families but not a draw, mixed tenant base, ~2y average lease.
- Zoned schools: Southampton Elementary School (math 42% / reading 57%, grade D, #1,085 of 2,108 statewide, top 56%, 376 students, 51% FRL); Southampton Intermediate School (math 30% / reading 47%, grade F, #437 of 729 statewide, top 60%, 363 students, 44% FRL); Southampton High School (math 98%, 595 students, 48% FRL) — zoned schools average 48% FRL vs 30% district-wide (17 pts higher); higher-poverty schools than district average — tighter screening recommended.
- Market conditions: Rents rising fast (+14.6%/yr); 95 active listings in the ZIP; 1 comparable units currently listed for rent nearby; high-income renter base; 1,366 units permitted in Suffolk County in 2024 (216 in 5+ unit buildings).
- At $23,954/mo this rent would consume 184% of the median local household income ($156k/yr) (locally 274% of renters already pay >50% of income on rent) — very limited rent-growth headroom before tenants either downsize or default.
Forward outlook
- Local home prices are declining (-3.0%/yr); year-one equity from $27k of loan paydown is wiped out by about $117k of value loss. Plan a longer hold.
- Suffolk County population projected to shrink 5% by 2050 — rents likely to lag national; underwrite the cash flow, not the appreciation.
Negotiation context
- It's been on market 52 days — a 3% lower offer ($3.78M) is reasonable based on typical stale-listing flexibility.
- Current owner paid $850k; list at $3.90M implies a 358% gain — meaningful room to come down on a strong offer.
Risks & watch-outs
- Climate carrying-cost: severe wind risk, 80% chance of damaging wind over 30y — expect insurance premiums to compound above CPI over the hold.
Questions for the listing agent
- What do current leases actually rent for vs. the listed asking? Can we see a recent rent roll and the last 12 months of T-12 income?
- It's been on market 52 days. Have you received any prior offers? Is the seller open to a 38% concession, seller financing, or rate buy-down credit?
- Is there a deadline driving the sale (1031 exchange, divorce, estate, relocation)? That informs how much negotiation room exists.
- Schools are D-rated, which usually means shorter tenancies and higher turnover. Who's the typical renter profile here, and what's been the actual vacancy rate?
- The area grade is low — what's the realistic commute time and amenity access for the typical tenant pool here? Any planned neighborhood developments (good or bad) we should know about?
- What's the average days-on-market for RENTAL listings here right now (not sales)? A rising rental-DOM trend means longer vacancies and softer asking-rent achievability than the comps imply.
- What's the recent tenant-quality profile in this submarket — average credit score on applications, eviction rate, late-payment / NSF rate, and stable-employment percentage? A property-management company in the area should have these aggregated.
- How much new for-sale + rental construction is in the pipeline within 1–3 miles? Heavy new supply typically softens prices + rents 12–24 months out; constrained supply supports both.
Investment metrics
- 1% rule
- 0.62% ✗
- Cap rate
- 3.83%
- Cash-on-cash
- -8.80%
- DSCR
- 0.61
- GRM
- 13.6
CMA / ARV
- ARV (median comp)
- $2,719,084
- List price
- $3,895,000
- Delta
- 43.25%
- Verdict
- OVERPRICED
- Comps
- 4 within 1.0 mi
Projected returns pro-forma
-3.0% appreciation · 8.0% rent growth · sell at horizon
- IRR
- -26.5%
- Equity multiple
- 0.07×
- Total profit
- $-1,013,313
- Equity at exit
- $580,757
- IRR
- -12.4%
- Equity multiple
- 0.12×
- Total profit
- $-960,289
- Equity at exit
- $336,768
Cash invested: $1,090,600 (down + closing). Projections, not guarantees.
Landlord ↔ Tenant lean methodology
- Overall (STATE)
- 15 Strongly Tenant-Friendly
- State New York
- 15 Strongly Tenant-Friendly · D+10
- County
- — inherits STATE
- City
- — inherits STATE
ZIP-level market 11968
- Home prices YoY
- -28.6%
- Rents YoY
- 14.6%
- Active inventory
- 95
- Price-to-rent
- 13.6×
Monthly cashflow live
- Estimated rent
- $23,954 medium interval (Pro) →
- Mortgage (P&I)
- −$20,426
- Tax est. 1.5%
- −$4,869 /mo · $58,425/yr
- Insurance
- −$1,623
- HOA
- −$0
- Vacancy / Maint / Mgmt
- −$5,030
- Net cashflow
- $-7,994
Break-even live
UW: 25.0% down · 7.5% · 30yr · 1.5% tax · 5.0% vac · 8.0% maint · 8.0% mgmt
Financing live
Cash to close
- Down payment
- $973,750
- Closing costs
- $116,850
- Reserves months
- —
- Total cash needed
- —
Loan-product check · same deal, 3 products live
Conventional
25% down · 7.5% · 30yr
- Down + closing
- —
- Monthly P&I
- —
- Monthly cashflow
- —
- DSCR
- —
- Eligible?
- —
Personal DTI + credit; lowest rate.
DSCR
20% down · 8.5% · 30yr
- Down + closing
- —
- Monthly P&I
- —
- Monthly cashflow
- —
- DSCR
- —
- Eligible?
- —
No personal income docs; deal must DSCR.
Hard money
10% down · 12.0% · 12mo
- Down + closing
- —
- Monthly P&I
- —
- Monthly cashflow
- —
- DSCR
- —
- Eligible?
- —
Short-term bridge; refi at stabilization.
Rent comps 1 comps
| Address | Beds | Baths | Sqft | Rent | $/sqft | DOM | Units | Dist |
|---|---|---|---|---|---|---|---|---|
| 779 Noyack Rd Southampton, NY | 6.0 | 7.5 | 4653 | $45,000 | $9.67 | 43d | 1 | 0.93mi |
Listing history 17 events
-
2026-06-18days on market $3,895,000 Active 52 DOM
-
2026-06-17days on market $3,895,000 Active 51 DOM
-
2026-06-16days on market $3,895,000 Active 50 DOM
-
2026-06-15days on market $3,895,000 Active 49 DOM
-
2026-06-13days on market $3,895,000 Active 47 DOM
-
2026-06-13days on market $3,895,000 Active 46 DOM
-
2026-06-09days on market $3,895,000 Active 43 DOM
-
2026-06-08days on market $3,895,000 Active 42 DOM
-
2026-06-07days on market $3,895,000 Active 41 DOM
-
2026-06-04days on market $3,895,000 Active 38 DOM
-
2026-06-03days on market $3,895,000 Active 37 DOM
-
2026-06-02days on market $3,895,000 Active 36 DOM
-
2026-06-01days on market $3,895,000 Active 35 DOM
-
2026-05-31days on market $3,895,000 Active 34 DOM
-
2026-04-27$3,895,000 Active 1249-char remark
-
2025-04-14soldstatus $850,000
-
2000-05-31soldstatus $70,000
ⓘ Source: listings_history table (triggers on properties + properties_extension) + one-shot
backfill from property_details.listing_events for pre-trigger history.
Climate risk First Street
- Flood 1/10 Low FEMA zone X (unshaded) · 0% chance over 30 yrs
- Wildfire 2/10 Low
- Heat 4/10 Moderate 7 d/yr ≥90°F today · 20 d/yr by 30 yrs out
- Wind 8/10 Severe 80% chance of damaging wind over 30 yrs
- Air quality 3/10 Moderate 2 unhealthy d/yr today · 3 by 30 yrs out
Nearby sold comps map
Loading sold comps map…
Walkable amenities ~0.75 mi
Loading nearby amenities…
Taxation est. · year 1
- Rental income
- $287,453
- − Mortgage interest
- −$218,181
- − Property taxes
- −$58,425
- − Insurance
- −$19,475
- − Repairs & maintenance
- −$22,996
- − Management
- −$22,996
- − Depreciation
- −$113,309
- Taxable loss
- −$167,929
- Est. tax savings @ 24.0%
- +$40,303
- After-tax cash flow
- $-55,619/yr
For passive investors: Depreciation is non-cash, so a rental often shows a tax loss while cash-flowing — sheltering income. Rental losses are passive: they offset passive income freely, and up to $25,000/yr can offset ordinary (W-2) income if you actively participate and your MAGI is under $100k (phasing out to $0 by $150k); unused losses carry forward. On sale, claimed depreciation is recaptured at up to 25%, and gains may owe capital-gains tax (a 1031 exchange can defer both). Figures are a year-1 estimate at your 24.0% rate — not tax advice; consult a CPA.
Schools (NCES district)
- District
- Southampton Union Free School District
- NCES district ID
- 3627540
- Math proficiency
- 53% ▬ 0.00%
- Reading proficiency
- 51% ▲ 4.00%
- Median HH income
- $85,977
- Composite
- 47.9/100
- National rank
- #2213
- State rank
- #293 of 590 in NY
Livability — North Sea
- Score
- 58/100
- State rank
- #1063
- US rank
- #21178
Category grades
Schools grade is shown separately in the Schools card above.
Census & demographics
- Census place
- North Sea, NY
- County
- Suffolk County · 679,920 people
- Metro
- New York-Newark-Jersey City, NY-NJ-PA
- Population (ZIP)
- 15,312
- Household income
- $156,219
- Rent vs Own
- Severe rent burden
- 274.0
Population outlook (Suffolk County) Hauer SSP2
- Today (2025)
- 1,505,262 people
- By 2030
- 1,498,318 · -0.5%
- By 2040
- 1,471,101 · -2.3%
- By 2050
- 1,424,848 · -5.3%
- By 2075
- 1,337,157 · -11.2%
- By 2100
- 1,217,720 · -19.1%
Race, ethnicity, and origin ACS 2023
- Neighborhood character
- Predominantly White (71%)
- Race & ethnicity
- White 71% Hispanic / Latino 13% Two or more races 10% Black 9% Asian 3% Native American 2%
- Hispanic origin (detail)
- Mexican 3% Puerto Rican 2%
- Common ancestry
- Romanian 5% Scotch-Irish 2% Danish 2%
- Foreign-born
- 15% · Canada, Jamaica, Vietnam
- Languages at home
- 81% English-only · Spanish 11% Other Indo-European 3% German/W. Germanic 2%
Political lean MEDSL · Suffolk
- 2024 margin
- Lean R (+10.0) · D 45.0% · R 55.0%
- 2008→2024 swing
- -16.0pp toward R · 2008: 6.0pp · 2024: -10.0pp
- All cycles
- 2024: R+10.0 2020: R+0.0 2016: R+8.2 2012: D+2.9 2008: D+6.0
Not yet ingested
- Civics
- —
Market trends
- HPI YoY
- ▼ -184.86%
- Current HPI
- 461.1144
- Rent YoY
- ▲ 14.62%
- Metro
- New York-Newark-Jersey City, NY-NJ-PA
- State GDP YoY
- ▲ 2.60%
- F500 in state
- 92
Industry mix (Fortune 500 HQ in NY)
| Industry | F500 HQs | Revenue |
|---|---|---|
| Financial Services | 10 | $950B |
|
||
| Consumer Goods | 9 | $162B |
|
||
| Insurance | 4 | $225B |
|
||
| Telecommunications | 2 | $144B |
|
||
| Pharmaceuticals | 2 | $112B |
|
||
| Media / Entertainment | 2 | $69B |
|
||
Price history
+5464.3% since first listed3 events — show timeline
- 2026-04-27 Listed $3,895,000 OneKey® MLS as Distributed by MLS Grid
- 2025-04-14 Sold (Public Records) $850,000 Public Records
- 2000-05-31 Sold (Public Records) $70,000 Public Records
Property tax history
-0.1%/yrLatest (2022): $1,404 · +0.0% YoY. Source: county tax records.
Cash-flow waterfall
monthlySold comps — $/sqft
last 12 mo · ≤1 miLoading sold comps…