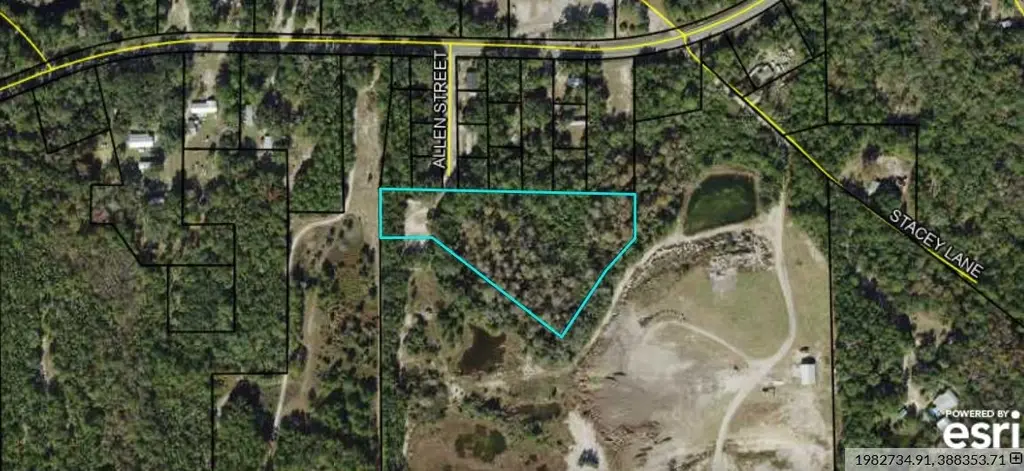
28 Allen St · Sopchoppy, FL
Flood risk No data
- FEMA flood zone
- —
- Chance of flooding over 30 yrs
- —
- Est. flood insurance / yr
- —
Fire risk No data
- Est. fire insurance / yr
- —
Heat risk No data
- Hot days now (above threshold)
- —
- Hot days in 30 yrs
- —
Wind risk No data
- Chance of severe wind over 30 yrs
- —
Air-quality risk No data
- Unhealthy air days now
- —
- Unhealthy air days in 30 yrs
- —
Risk factors via First Street. Map © Google.
Why this score? — see what drove the C grade
The composite is a weighted blend of 9 inputs, each scored 0–100. Each bar is that input's sub-score; the figure is the points it added to the 100-point composite (weight × sub-score).
- Cash flow +19.2/30.0
- ARV discount +7.5/15.0
- Appreciation +6.9/10.0
- DSCR +6.1/10.0
- Schools +4.8/10.0
- 1% rule +4.5/10.0
- Livability +3.2/5.0
- Rent growth +2.5/5.0
- Condition / age +1.0/5.0
$114,000
🖨 Deal sheet 📄 Offer letter ✓ Due diligence
Listing remarks MLS
Discover the perfect opportunity to own your slice of countryside! This 5 acre property offers peace and privacy, with plenty of room to garden, raise animals , or simply enjoy the wide open space! Mobile home needs major repair, No VIN for mobile home. Property is being listed for land value. Please do not walk out on back porch- missing steps.
Key facts
- Quiet street
- Vacant acreage
- 5 acres
Tags
Property features AI
Finance
- Financial info: Offered for sale
Exterior
- Parking: Driveway
- Utilities: Septic tank sewer
- Home design: Vinyl siding
- Construction: Vinyl siding construction
- Exterior features: Paved road access; Lot of approximately 5.01 acres
Interior
- Kitchen: Oven; Range; Refrigerator
- Bedrooms: Bedroom 2 (9 x 9); Bedroom 3 (9 x 9)
- Flooring: Tile
- Bathrooms: 2 full bathrooms
- Heating & cooling: Central heating (electric); Central air conditioning (electric)
- Interior features: Split bedroom floor plan; Tile flooring; Fireplace
- Laundry & utility: Utility room (10 x 10)
Neighborhood map
What this means for you Summary
Snapshot
- This is a 3-bed/2.0-bath manufactured listed at $114k. Condition is rated poor.
Deal economics
- At list price, monthly cash flow is $123 ($1k/yr) — positive.
- The deal already cash-flows at list — no discount required.
- To meet the 1% rule (rent ≥ 1% of price), the offer needs to be $108k (5.0% below list).
- Recommended offer: $108k (5.0% below list) — sets the bar for 1% rule.
Location & tenants
- Location reads 65/100 on livability (#647 in FL) — a middle-class / working-renter tenant base. Strengths: cost of living A+, housing A+; Watch: employment D+, schools D-, amenities F.
- Wakulla (rural): math 56% / reading 56% proficiency, ranked #18 of 73 in FL (top 25%) — acceptable for families but not a draw, mixed tenant base, ~2y average lease.
- Market conditions: 73 active listings in the ZIP; 468 units permitted in Wakulla County in 2024 (0 in 5+ unit buildings).
Forward outlook
- In year one you build about $5k of equity ($788 loan paydown + $4k appreciation (3.8% local appreciation)).
- At projected returns (3.8% appreciation + 3.0% rent growth), your $32k cash investment doubles in ~5 years — after that, you're playing with house money.
- By year 7, paydown + projected appreciation supports a ~$32k cash-out refi (75% LTV) — recoverable capital for the next deal without selling this one.
Negotiation context
- Only 14 days on market — expect competitive offers; lowballing is unlikely to land.
- 6 sale attempts since 4y ago with the ask held roughly flat each time — persistent listings suggest the price (not the market) is what's stuck; bring a comps-based counter.
- Current owner paid $72k; list at $114k implies a 58% gain — meaningful room to come down on a strong offer.
Questions for the listing agent
- Have any recent inspections been done? Can we get a copy of the seller's disclosures and any deferred-maintenance estimates?
- Is there a deadline driving the sale (1031 exchange, divorce, estate, relocation)? That informs how much negotiation room exists.
- Schools are D-rated, which usually means shorter tenancies and higher turnover. Who's the typical renter profile here, and what's been the actual vacancy rate?
- What's the average days-on-market for RENTAL listings here right now (not sales)? A rising rental-DOM trend means longer vacancies and softer asking-rent achievability than the comps imply.
- What's the recent tenant-quality profile in this submarket — average credit score on applications, eviction rate, late-payment / NSF rate, and stable-employment percentage? A property-management company in the area should have these aggregated.
- How much new for-sale + rental construction is in the pipeline within 1–3 miles? Heavy new supply typically softens prices + rents 12–24 months out; constrained supply supports both.
Investment metrics
- 1% rule
- 0.95% ✗
- Cap rate
- 7.59%
- Cash-on-cash
- 4.62%
- DSCR
- 1.21
- GRM
- 8.8
CMA / ARV
No comps found within radius.
Projected returns pro-forma
3.75% appreciation · 3.0% rent growth · sell at horizon
- IRR
- 13.7%
- Equity multiple
- 1.82×
- Total profit
- $26,129
- Equity at exit
- $56,135
- IRR
- 15.1%
- Equity multiple
- 3.40×
- Total profit
- $76,543
- Equity at exit
- $90,509
Cash invested: $31,920 (down + closing). Projections, not guarantees.
Landlord ↔ Tenant lean methodology
- Overall (STATE)
- 87 Strongly Landlord-Friendly
- State Florida
- 87 Strongly Landlord-Friendly · R+3
- County
- — inherits STATE
- City
- — inherits STATE
ZIP-level market 32358
- Home prices YoY
- 1.1%
- Active inventory
- 73
- Price-to-rent
- 8.8×
Monthly cashflow live
- Estimated rent
- $1,083 medium interval (Pro) →
- Mortgage (P&I)
- −$598
- Tax from tax record
- −$87 /mo · $1,044/yr
- Insurance
- −$48
- HOA
- −$0
- Vacancy / Maint / Mgmt
- −$227
- Net cashflow
- $123
Break-even live
UW: 25.0% down · 7.5% · 30yr · 1.5% tax · 5.0% vac · 8.0% maint · 8.0% mgmt
Financing live
Cash to close
- Down payment
- $28,500
- Closing costs
- $3,420
- Reserves months
- —
- Total cash needed
- —
Loan-product check · same deal, 3 products live
Conventional
25% down · 7.5% · 30yr
- Down + closing
- —
- Monthly P&I
- —
- Monthly cashflow
- —
- DSCR
- —
- Eligible?
- —
Personal DTI + credit; lowest rate.
DSCR
20% down · 8.5% · 30yr
- Down + closing
- —
- Monthly P&I
- —
- Monthly cashflow
- —
- DSCR
- —
- Eligible?
- —
No personal income docs; deal must DSCR.
Hard money
10% down · 12.0% · 12mo
- Down + closing
- —
- Monthly P&I
- —
- Monthly cashflow
- —
- DSCR
- —
- Eligible?
- —
Short-term bridge; refi at stabilization.
Listing history 11 events
-
2026-06-18pricedays on market $114,000 Active 14 DOM
-
2026-06-17days on market $119,000 Active 13 DOM
-
2026-06-16days on market $119,000 Active 12 DOM
-
2026-06-15days on market $119,000 Active 11 DOM
-
2026-06-14days on market $119,000 Active 9 DOM
-
2026-06-10days on market $119,000 Active 6 DOM
-
2026-06-09days on market $119,000 Active 5 DOM
-
2026-06-08days on market $119,000 Active 4 DOM
-
2026-06-07days on market $119,000 Active 3 DOM
-
2026-06-05remarks 239-char remark
-
2026-06-05$119,000 Active 1 DOM
ⓘ Source: listings_history table (triggers on properties + properties_extension) + one-shot
backfill from property_details.listing_events for pre-trigger history.
Tax reassessment forecast FL · Resets to sale price
- Current annual tax
- $1,044 · $87/mo
- Projected year-2 tax
- $1,044 · $87/mo
- Expected delta
- $0/yr ($0/mo · 0.0%)
ⓘ Screening estimate from a state-policy table — verify with the county assessor before closing.
Nearby sold comps map
Loading sold comps map…
Walkable amenities ~0.75 mi
Loading nearby amenities…
Taxation est. · year 1
- Rental income
- $12,991
- − Mortgage interest
- −$6,386
- − Property taxes
- −$1,044
- − Insurance
- −$570
- − Repairs & maintenance
- −$1,039
- − Management
- −$1,039
- − Depreciation
- −$3,316
- Taxable loss
- −$403
- Est. tax savings @ 24.0%
- +$97
- After-tax cash flow
- $1,572/yr
For passive investors: Depreciation is non-cash, so a rental often shows a tax loss while cash-flowing — sheltering income. Rental losses are passive: they offset passive income freely, and up to $25,000/yr can offset ordinary (W-2) income if you actively participate and your MAGI is under $100k (phasing out to $0 by $150k); unused losses carry forward. On sale, claimed depreciation is recaptured at up to 25%, and gains may owe capital-gains tax (a 1031 exchange can defer both). Figures are a year-1 estimate at your 24.0% rate — not tax advice; consult a CPA.
Condition & rehab AI · 1 photo
This 5-acre property with a mobile home requires extensive repairs and improvements to become move-in ready. Significant work is needed on the exterior, interior, HVAC, and landscaping to increase its resale and rental value.
Repairs flagged
- Major Back porch steps — Missing steps on the back porch
- Major Exterior walls — Significant disrepair visible
- Major Roof — Overall condition suggests it may need replacement
- Major Flooring — Overall condition suggests it may need replacement
- Major Interior walls/paint — Significant disrepair visible
- Major HVAC/mechanicals — Overall condition suggests they may need replacement
- Major Landscaping — No visible landscaping
Value-add opportunities
- Both Landscaping and curb appeal — Improving the landscaping and curb appeal can enhance both resale and rental value
- Both Exterior repairs — Repairing the exterior can improve the home's appearance and increase its value
- Both Interior repairs and paint — Updating the interior and painting can significantly improve the home's appearance and value
- Both HVAC and mechanicals — Upgrading the HVAC and mechanicals can improve comfort and energy efficiency, increasing both resale and rental value
Renovation cost estimate screening
| Repair item | Severity | Est. cost |
|---|---|---|
| Back porch steps · Missing steps on the back porch | Major | $15,000–50,000 |
| Exterior walls · Significant disrepair visible | Major | $15,000–50,000 |
| Roof · Overall condition suggests it may need replacement | Major | $15,000–50,000 |
| Flooring · Overall condition suggests it may need replacement | Major | $15,000–50,000 |
| Interior walls/paint · Significant disrepair visible | Major | $15,000–50,000 |
| HVAC/mechanicals · Overall condition suggests they may need replacement | Major | $15,000–50,000 |
| Landscaping · No visible landscaping | Major | $15,000–50,000 |
| Total estimated repair cost · 7 items | $105,000–350,000 |
Value-add ROI direction
- Both Landscaping and curb appeal — Improving the landscaping and curb appeal can enhance both resale and rental value ↑
- Both Exterior repairs — Repairing the exterior can improve the home's appearance and increase its value ↑
- Both Interior repairs and paint — Updating the interior and painting can significantly improve the home's appearance and value ↑
- Both HVAC and mechanicals — Upgrading the HVAC and mechanicals can improve comfort and energy efficiency, increasing both resale and rental value ↑
ⓘ Cost ranges are severity-bucket heuristics (US national rule-of-thumb). Get contractor quotes + a written scope before underwriting a rehab budget.
Schools (NCES district)
- District
- Wakulla
- NCES district ID
- 1201950
- Math proficiency
- 56% ▼ -7.00%
- Reading proficiency
- 56% ▼ -5.00%
- Median HH income
- $53,740
- Composite
- 48.12/100
- National rank
- #2183
- State rank
- #18 of 73 in FL
Livability — Sopchoppy
- Score
- 65/100
- State rank
- #647
- US rank
- #12779
Category grades
Schools grade is shown separately in the Schools card above.
Census & demographics
- Population (ZIP)
- 1,813
Population outlook (Wakulla County) Hauer SSP2
- Today (2025)
- 32,809 people
- By 2030
- 33,165 · +1.1%
- By 2040
- 33,245 · +1.3%
- By 2050
- 32,539 · -0.8%
- By 2075
- 29,676 · -9.5%
- By 2100
- 22,931 · -30.1%
Race, ethnicity, and origin ACS 2023
- Neighborhood character
- Predominantly White (83%)
- Race & ethnicity
- White 83% Black 16%
- Common ancestry
- Hispanic 4% Scandinavian 3% Slovak 2%
- Foreign-born
- 6% · Canada
- Languages at home
- 92% English-only · French/Haitian/Cajun 7% Other Indo-European 1%
Political lean MEDSL · Wakulla
- 2024 margin
- Solid R (+44.4) · D 27.4% · R 71.8%
- 2008→2024 swing
- -19.5pp toward R · 2008: -24.8pp · 2024: -44.4pp
- All cycles
- 2024: R+44.4 2020: R+40.9 2016: R+40.1 2012: R+28.1 2008: R+24.8
Not yet ingested
- Civics
- —
Market trends
- HPI YoY
- ▲ 3.75%
- Current HPI
- 361.5033
- Rent YoY
- —
- Metro
- —
- State GDP YoY
- ▲ 3.28%
- F500 in state
- 36
Industry mix (Fortune 500 HQ in FL)
| Industry | F500 HQs | Revenue |
|---|---|---|
| Industrial Technology | 2 | $29B |
|
||
| Insurance | 2 | $17B |
|
||
| Retail | 1 | $60B |
|
||
| Technology Distribution | 1 | $58B |
|
||
| Homebuilding | 1 | $35B |
|
||
| Technology Manufacturing | 1 | $35B |
|
||
Price history
-71.0% since first listed20 events — show timeline
- 2026-06-04 Listed $119,000 CATRS
- 2026-01-30 Sold (MLS) $72,000 CATRS
- 2026-01-16 Contingent — CATRS
- 2026-01-15 Price Changed $75,000 CATRS
- 2025-12-05 Price Changed $89,500 CATRS
- 2025-11-20 Listed $99,500 CATRS
- 2025-05-26 Listing Removed — CATRS
- 2025-05-26 Listing Removed — CATRS
- 2025-03-27 Price Changed $105,000 CATRS
- 2025-03-26 Listed $105,000,000 CATRS
- 2025-02-04 Listed $125,000 CATRS
- 2023-05-03 Listing Removed — CATRS
- 2023-03-29 Price Changed $124,900 CATRS
- 2023-01-30 Listed $137,500 CATRS
- 2022-03-11 Sold (MLS) $75,000 CATRS
- 2022-02-11 Contingent — CATRS
- 2022-01-26 Price Changed $90,000 CATRS
- 2022-01-20 Price Changed $99,900 CATRS
- 2022-01-10 Listed $110,000 CATRS
- 2008-10-21 Sold (Public Records) $410,000 Public Records
Cash-flow waterfall
monthlySold comps — $/sqft
last 12 mo · ≤1 miLoading sold comps…