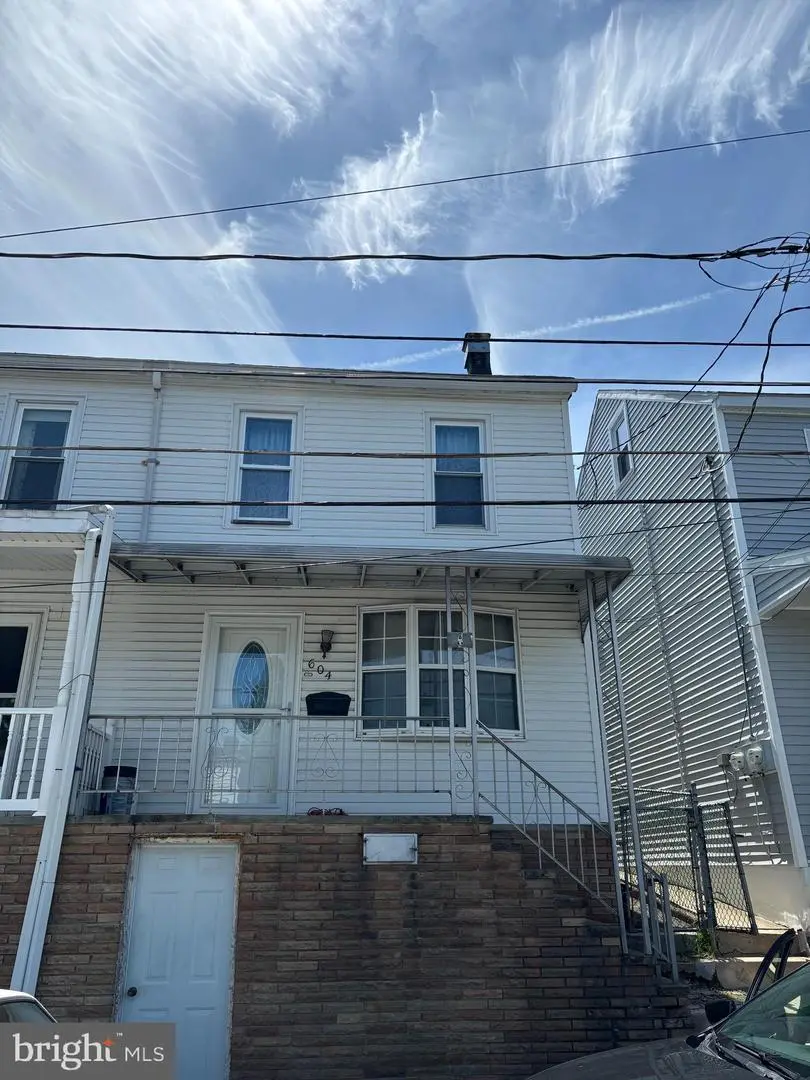
604 3rd St · Port Carbon, PA
Flood risk 1/10 · Minimal
- FEMA flood zone
- X (unshaded)
- Chance of flooding over 30 yrs
- 0.0%
- Est. flood insurance / yr
- $473 – $860
Fire risk 3/10 · Minor
- Est. fire insurance / yr
- $511 – $949
Heat risk 4/10 · Minor
- Hot days now (above 96°F)
- 7 days/yr
- Hot days in 30 yrs
- 16 days/yr
Wind risk 4/10 · Minor
- Chance of severe wind over 30 yrs
- 7.0%
Air-quality risk 2/10 · Minimal
- Unhealthy air days now
- 1 days/yr
- Unhealthy air days in 30 yrs
- 1 days/yr
Risk factors via First Street. Map © Google.
Why this score? — see what drove the B+ grade
The composite is a weighted blend of 9 inputs, each scored 0–100. Each bar is that input's sub-score; the figure is the points it added to the 100-point composite (weight × sub-score).
- Cash flow +30.0/30.0
- 1% rule +10.0/10.0
- DSCR +10.0/10.0
- ARV discount +8.2/15.0
- Appreciation +5.0/10.0
- Livability +4.2/5.0
- Schools +3.1/10.0
- Rent growth +2.5/5.0
- Condition / age +2.5/5.0
$79,900
🖨 Deal sheet (PDF) 📄 Offer letter ✓ Due diligence
Listing remarks
Opportunity is knocking in the Schoentown neighborhood of Port Carbon! This 3-bedroom, 1.5-bath semi-detached home is packed with potential and ready for its next chapter. Whether you're an investor searching for your next flip, a landlord looking to expand your portfolio, or a buyer eager to build sweat equity, this property offers the value and location to make it happen. The home features durable vinyl siding, a covered front porch with block construction, and a fenced rear yard perfect for pets, outdoor entertaining, or future landscaping ideas. Out back, you’ll also find a beautiful modern Amish-built shed offering excellent storage or workshop space. Inside, the property needs u
Key facts
- Built 1900
- Listed 17 days
Property features AI
Exterior
- Parking: On-street parking
- Utilities: Public water; Public sewer; Electric cooling fuel
- Home design: Semi-detached design; Stick-built construction; Estimated year built
- Construction: Block and stone foundation
- Exterior features: Lot roughly 20 x 116 feet; Not in a federal flood zone; Above-grade and below-grade structures
Interior
- Kitchen: Stove
- Bedrooms: Three bedrooms on the first upper level
- Bathrooms: One full bathroom on the upper level; One half bathroom on the main level
- Heating & cooling: Baseboard hot water heating; Radiator heating; Ceiling fans for cooling; Oil-fired heating and hot water
- Interior features: Stove included; Full basement
Neighborhood map
What this means for you Summary
Snapshot
- This is a 3-bed/1.0-bath townhouse listed at $80k.
Deal economics
- At list price, monthly cash flow is $451 ($5k/yr) — positive.
- The deal already cash-flows at list — no discount required.
- Meets the 1% rule at list price ($1k rent vs $80k).
- Recommended offer: $79k (1.5% below list) — sets the bar for market timing.
Location & tenants
- Location reads 83/100 on livability (#131 in PA, #1,039 nationally) — a professional / high-income tenant draw. Strengths: crime A+, cost of living A+, housing A+; Watch: amenities F.
- Pottsville Area SD (town): math 29% / reading 46% proficiency, ranked #395 of 539 in PA (top 73%) — families likely to look elsewhere, expect single-tenant / working-renter base with shorter leases.
- Zoned schools: Clarke El Ctr (math 26% / reading 49%, grade F, #997 of 1,518 statewide, top 66%, 805 students, 70% FRL); Lengel Ms (math 22% / reading 43%, grade F, #355 of 512 statewide, top 70%, 699 students, 66% FRL); Pottsville Area Hs (math 52% / reading 74%, grade B-, #69 of 437 statewide, top 16%, 898 students, 57% FRL).
- Market conditions: 11 active listings in the ZIP; 1 comparable units currently listed for rent nearby; 169 units permitted in Schuylkill County in 2024 (0 in 5+ unit buildings).
Forward outlook
- In year one you build about $505 of equity ($552 loan paydown + $-47 appreciation (-0.1% local appreciation)).
- Schuylkill County population projected at -16% by 2050 — secular population decline; favor cash flow + early exit over multi-decade hold.
- At projected returns (-0.1% appreciation + 3.0% rent growth), your $22k cash investment doubles in ~4 years — after that, you're playing with house money.
Negotiation context
- It's been on market 18 days — a 2% lower offer ($79k) is reasonable based on typical stale-listing flexibility.
- Current owner paid $36k; list at $80k implies a 122% gain — meaningful room to come down on a strong offer.
Risks & watch-outs
- Watch-outs: built in 1900 — expect roof / HVAC / electrical / plumbing capex.
Questions for the listing agent
- Built in 1900 — when were the roof, HVAC, electrical panel, plumbing, and water heater last replaced?
- Is there a deadline driving the sale (1031 exchange, divorce, estate, relocation)? That informs how much negotiation room exists.
- Schools are F-rated, which usually means shorter tenancies and higher turnover. Who's the typical renter profile here, and what's been the actual vacancy rate?
- What's the average days-on-market for RENTAL listings here right now (not sales)? A rising rental-DOM trend means longer vacancies and softer asking-rent achievability than the comps imply.
- What's the recent tenant-quality profile in this submarket — average credit score on applications, eviction rate, late-payment / NSF rate, and stable-employment percentage? A property-management company in the area should have these aggregated.
- How much new for-sale + rental construction is in the pipeline within 1–3 miles? Heavy new supply typically softens prices + rents 12–24 months out; constrained supply supports both.
Investment metrics
- 1% rule
- 1.63% ✓
- Cap rate
- 13.06%
- Cash-on-cash
- 24.17%
- DSCR
- 2.08
- GRM
- 5.1
CMA / ARV
- ARV (on-the-fly)
- $81,168
- Comps found
- 5
Show comp detail 5 sales within ~0.75 mi
| Address | Dist | Beds/Ba | Sqft | Sold | Price | $/sf | Match |
|---|---|---|---|---|---|---|---|
| 602 5th St | 0.15mi | 4/1.0 (+1) | 1,408 (-1%) | 9mo | $79,000 | $56 | 78 |
| 553 3rd St | 0.06mi | 3/1.0 | 1,238 (-13%) | 20mo | $70,000 | $57 | 59 |
| 228 Coal St | 0.47mi | 4/1.0 (+1) | 1,400 (-2%) | 18mo | $90,000 | $64 | 55 |
| 214 S Jackson St | 0.72mi | 3/1.5 | 1,466 (+3%) | 15mo | $77,500 | $53 | 47 |
| 76 Rose St | 0.69mi | 3/1.0 | 1,216 (-15%) | 22mo | $80,000 | $66 | 25 |
Match score weights: distance 35% · size 25% · config 20% · recency 20%. Top-matched comps best support the ARV.
Projected returns pro-forma
-0.06% appreciation · 3.0% rent growth · sell at horizon
- IRR
- 24.2%
- Equity multiple
- 2.17×
- Total profit
- $26,177
- Equity at exit
- $22,967
- IRR
- 28.2%
- Equity multiple
- 4.13×
- Total profit
- $70,123
- Equity at exit
- $27,422
Cash invested: $22,372 (down + closing). Projections, not guarantees.
Landlord ↔ Tenant lean methodology
- Overall (STATE)
- 62 Landlord-Friendly
- State Pennsylvania
- 62 Landlord-Friendly · EVEN
- County
- — inherits STATE
- City
- — inherits STATE
ZIP-level market 17965
- Home prices YoY
- -0.0%
- Active inventory
- 11
- Price-to-rent
- 5.1×
Monthly cashflow live
- Estimated rent
- $1,300 medium interval (Pro) →
- Mortgage (P&I)
- −$419
- Tax from tax record
- −$124 /mo · $1,489/yr
- Insurance
- −$33
- HOA
- −$0
- Vacancy / Maint / Mgmt
- −$273
- Net cashflow
- $451
Break-even live
Sensitivity live
| Price | -10% $496 | -5% $473 | +0% $451 | +5% $428 | +10% $405 |
|---|---|---|---|---|---|
| Rent | -10% $348 | -5% $399 | +0% $451 | +5% $502 | +10% $553 |
| Rate | -1.0pp $491 | -0.5pp $471 | base $451 | +0.5pp $430 | +1.0pp $409 |
UW: 25.0% down · 7.5% · 30yr · 1.5% tax · 5.0% vac · 8.0% maint · 8.0% mgmt
Financing live
Cash to close
- Down payment
- $19,975
- Closing costs
- $2,397
- Reserves months
- —
- Total cash needed
- —
Loan-product check · same deal, 3 products live
Conventional
25% down · 7.5% · 30yr
- Down + closing
- —
- Monthly P&I
- —
- Monthly cashflow
- —
- DSCR
- —
- Eligible?
- —
Personal DTI + credit; lowest rate.
DSCR
20% down · 8.5% · 30yr
- Down + closing
- —
- Monthly P&I
- —
- Monthly cashflow
- —
- DSCR
- —
- Eligible?
- —
No personal income docs; deal must DSCR.
Hard money
10% down · 12.0% · 12mo
- Down + closing
- —
- Monthly P&I
- —
- Monthly cashflow
- —
- DSCR
- —
- Eligible?
- —
Short-term bridge; refi at stabilization.
Rent comps 1 comps
| Address | Beds | Baths | Sqft | Rent | $/sqft | DOM | Units | Dist |
|---|---|---|---|---|---|---|---|---|
| 72 E Bacon St Pottsville, PA | 3.0 | 1.0 | 1640 | $1,300 | $0.79 | 45d | 1 | 1.24mi |
Listing history 19 events
-
2026-06-21days on market $79,900 Active 18 DOM
-
2026-06-19days on market $79,900 Active 16 DOM
-
2026-06-18days on market $79,900 Active 15 DOM
-
2026-06-17days on market $79,900 Active 14 DOM
-
2026-06-16days on market $79,900 Active 13 DOM
-
2026-06-15days on market $79,900 Active 12 DOM
-
2026-06-14days on market $79,900 Active 10 DOM
-
2026-06-12days on market $79,900 Active 9 DOM
-
2026-06-09days on market $79,900 Active 6 DOM
-
2026-06-08days on market $79,900 Active 5 DOM
-
2026-06-07days on market $79,900 Active 4 DOM
-
2026-06-07statusdays on market $79,900 Active 3 DOM
-
2026-06-04days on market $79,900 Coming Soon 6 DOM
-
2026-06-02days on market $79,900 Coming Soon 5 DOM
-
2026-06-01days on market $79,900 Coming Soon 4 DOM
-
2026-05-31days on market $79,900 Coming Soon 3 DOM
-
2026-05-31days on market $79,900 Coming Soon 2 DOM
-
2026-05-28historical $79,900
-
1999-09-23soldstatus $36,000
ⓘ Source: listings_history table (triggers on properties + properties_extension) + one-shot
backfill from property_details.listing_events for pre-trigger history.
Tax reassessment forecast PA · Partial reset (capped growth)
- Current annual tax
- $1,489 · $124/mo
- Projected year-2 tax
- $1,489 · $124/mo
- Expected delta
- $0/yr ($0/mo · 0.0%)
ⓘ Screening estimate from a state-policy table — verify with the county assessor before closing.
Climate risk First Street
- Flood 1/10 Low FEMA zone X (unshaded) · 0% chance over 30 yrs
- Wildfire 3/10 Moderate
- Heat 4/10 Moderate 7 d/yr ≥96°F today · 16 d/yr by 30 yrs out
- Wind 4/10 Moderate 7% chance of damaging wind over 30 yrs
- Air quality 2/10 Low 1 unhealthy d/yr today · 1 by 30 yrs out
Nearby sold comps map
Loading sold comps map…
Walkable amenities ~0.75 mi
Loading nearby amenities…
Taxation est. · year 1
- Rental income
- $15,600
- − Mortgage interest
- −$4,476
- − Property taxes
- −$1,489
- − Insurance
- −$400
- − Repairs & maintenance
- −$1,248
- − Management
- −$1,248
- − Depreciation
- −$2,324
- Taxable income
- $4,415
- Est. tax owed @ 24.0%
- −$1,060
- After-tax cash flow
- $4,348/yr
For passive investors: Depreciation is non-cash, so a rental often shows a tax loss while cash-flowing — sheltering income. Rental losses are passive: they offset passive income freely, and up to $25,000/yr can offset ordinary (W-2) income if you actively participate and your MAGI is under $100k (phasing out to $0 by $150k); unused losses carry forward. On sale, claimed depreciation is recaptured at up to 25%, and gains may owe capital-gains tax (a 1031 exchange can defer both). Figures are a year-1 estimate at your 24.0% rate — not tax advice; consult a CPA.
Schools (NCES district)
- District
- Pottsville Area SD
- NCES district ID
- 4219710
- Math proficiency
- 29% ▼ -14.00%
- Reading proficiency
- 46% ▼ -12.00%
- Median HH income
- $39,157
- Composite
- 31.32/100
- National rank
- #6002
- State rank
- #395 of 539 in PA
Livability — Port Carbon
- Score
- 83/100
- State rank
- #131
- US rank
- #1039
Category grades
Schools grade is shown separately in the Schools card above.
Census & demographics
- Census place
- Port Carbon, PA
- City population
- 1,869
- Population (ZIP)
- 1,869
Population outlook (Schuylkill County) Hauer SSP2
- Today (2025)
- 137,447 people
- By 2030
- 133,121 · -3.1%
- By 2040
- 124,172 · -9.7%
- By 2050
- 115,611 · -15.9%
- By 2075
- 100,796 · -26.7%
- By 2100
- 86,667 · -36.9%
Race, ethnicity, and origin ACS 2023
- Neighborhood character
- Predominantly White (93%)
- Race & ethnicity
- White 93% Hispanic / Latino 3% Black 2% Two or more races 2%
- Common ancestry
- Romanian 12% Polish 3% Danish 3%
- Foreign-born
- 1% · Canada
- Languages at home
- 97% English-only · Spanish 3%
Political lean MEDSL · Schuylkill
- 2024 margin
- Solid R (+42.1) · D 28.5% · R 70.6%
- 2008→2024 swing
- -33.4pp toward R · 2008: -8.7pp · 2024: -42.1pp
- All cycles
- 2024: R+42.1 2020: R+39.9 2016: R+43.4 2012: R+13.4 2008: R+8.7
Not yet ingested
- Civics
- —
Market trends
- HPI YoY
- ▼ -0.06%
- Current HPI
- 169.9943
- Rent YoY
- —
- Metro
- —
- State GDP YoY
- ▲ 1.68%
- F500 in state
- 34
Industry mix (Fortune 500 HQ in PA)
| Industry | F500 HQs | Revenue |
|---|---|---|
| Healthcare | 2 | $309B |
|
||
| Insurance | 2 | $27B |
|
||
| Telecommunications / Media | 1 | $124B |
|
||
| Industrial Distribution | 1 | $22B |
|
||
| Financial Services | 1 | $20B |
|
||
| Chemicals / Materials | 1 | $18B |
|
||
Price history
+121.9% since first listed2 events — show timeline
- 2026-05-28 Coming Soon $79,900 BRIGHT MLS
- 1999-09-23 Sold (Public Records) $36,000 Public Records
Property tax history
+3.0%/yrLatest (2025): $1,489 · +9.8% YoY. Source: county tax records.
Cash-flow waterfall
monthlySold comps — $/sqft
last 12 mo · ≤1 miLoading sold comps…