1616 Sparkman St NW · Hartselle, AL
Flood risk 1/10 · Minimal
- FEMA flood zone
- X (unshaded)
- Chance of flooding over 30 yrs
- 0.0%
- Est. flood insurance / yr
- $507 – $1,088
Fire risk 4/10 · Minor
- Est. fire insurance / yr
- $916 – $1,700
Heat risk 5/10 · Moderate
- Hot days now (above 106°F)
- 7 days/yr
- Hot days in 30 yrs
- 20 days/yr
Wind risk 5/10 · Moderate
- Chance of severe wind over 30 yrs
- 26.0%
Air-quality risk 2/10 · Minimal
- Unhealthy air days now
- 1 days/yr
- Unhealthy air days in 30 yrs
- 1 days/yr
Risk factors via First Street. Map © Google.
Why this score? — see what drove the D grade
The composite is a weighted blend of 9 inputs, each scored 0–100. Each bar is that input's sub-score; the figure is the points it added to the 100-point composite (weight × sub-score).
- ARV discount +15.0/15.0
- Cash flow +9.1/30.0
- Schools +4.5/10.0
- Livability +3.6/5.0
- 1% rule +2.8/10.0
- DSCR +2.5/10.0
- Rent growth +2.5/5.0
- Condition / age +2.5/5.0
- Appreciation +0.0/10.0
$155,000
🖨 Deal sheet (PDF) 📄 Offer letter ✓ Due diligence
Listing remarks
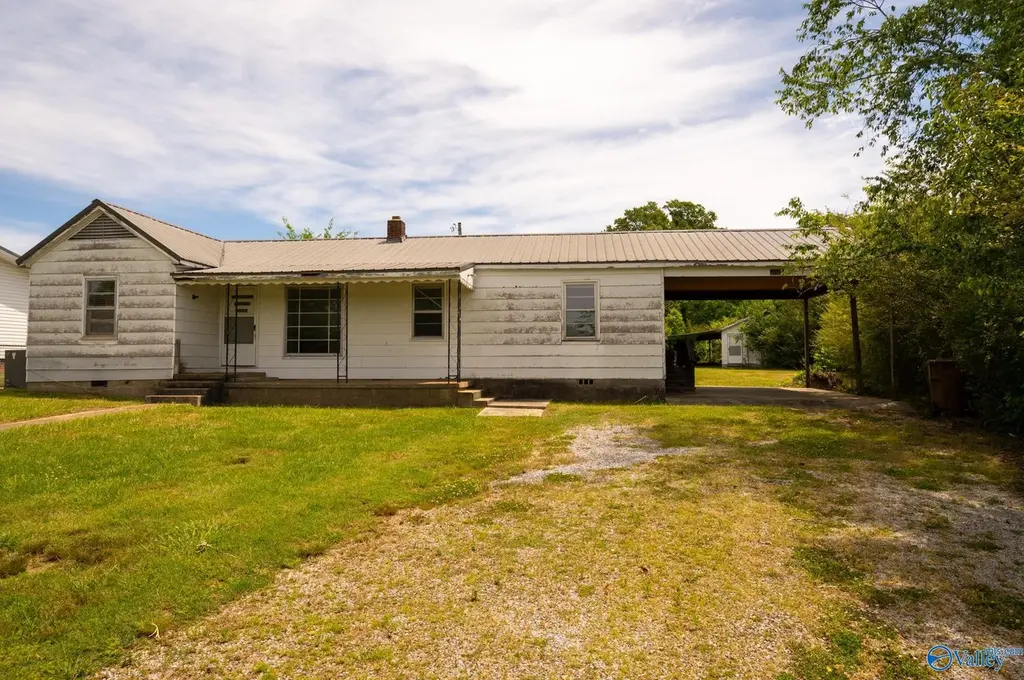
Located just off Highway 31 in Hartselle, this unique property offers a rare opportunity with potential for either residential or limited commercial use. Situated on a 1-acre lot, the 3-bedroom, 1.75-bath home is being sold in where-is, as-is condition. This property is located in a highly visible and convenient area, making it ideal for a variety of possibilities. Enjoy easy access to downtown Hartselle, medical facilities, shopping, dining, and everyday amenities while benefiting from a quick, accessible location. This property presents an excellent opportunity for the right buyer to make it their own.
Key facts
- Highly visible area
- 1 acre lot
- Unique property
Tags
Property features AI
Finance
- Other: Located in Metes And Bounds subdivision
- HOA & community: No association
Exterior
- Parking: Attached carport
- Utilities: Public sewer; Public water
- Home design: Single-family residence; One story; Built in 1950; Not new construction; Vinyl siding
- Construction: Vinyl siding construction; Built in 1950
- Exterior features: 1-acre lot; Public water
Interior
- Bathrooms: 1 full bathroom; 1 three-quarter bathroom
- Heating & cooling: Central heating; Central cooling
- Interior features: 7 total rooms; Crawl space basement
Neighborhood map
What this means for you Summary
Snapshot
- This is a 3-bed/1.0-bath single-family listed at $155k.
Deal economics
- At list price, monthly cash flow is $-120 ($-1k/yr) — negative.
- To cash-flow at today's rent, offer at most $138k (11.2% below list).
- To meet the 1% rule (rent ≥ 1% of price), the offer needs to be $120k (22.3% below list).
- Recommended offer: $120k (22.3% below list) — sets the bar for 1% rule.
- Cap rate 5.4% vs local median 4.0% in Hartselle — top-decile yield for the area; either an underpriced asset or a hidden risk that comps aren't pricing in. Stress-test before assuming the spread holds.
Location & tenants
- Location reads 72/100 on livability (#32 in AL) — a middle-class / working-renter tenant base. Strengths: cost of living A+, housing A+, health & safety A+; Watch: amenities F, commute F.
- Hartselle City (other): math 41% / reading 64% proficiency, ranked #10 of 129 in AL (top 8%) — acceptable for families but not a draw, mixed tenant base, ~2y average lease.
- Zoned schools: Crestline Elementary School (math 32% / reading 57%, grade F, #171 of 627 statewide, top 31%, 550 students, 49% FRL); Hartselle Junior High School (math 33% / reading 63%, grade C-, #29 of 257 statewide, top 12%, 527 students, 38% FRL); Hartselle High School (math 44% / reading 48%, grade D-, #18 of 305 statewide, top 6%, 1,031 students, 34% FRL) — zoned schools average 40% FRL vs 25% district-wide (16 pts higher); higher-poverty schools than district average — tighter screening recommended.
- Market conditions: 193 active listings in the ZIP; 2 comparable units currently listed for rent nearby; 231 units permitted in Morgan County in 2024 (0 in 5+ unit buildings).
Forward outlook
- Local home prices are declining (-3.0%/yr); year-one equity from $1k of loan paydown is wiped out by about $5k of value loss. Plan a longer hold.
- Morgan County population projected at -11% by 2050 — secular population decline; favor cash flow + early exit over multi-decade hold.
Negotiation context
- It's been on market 38 days — a 3% lower offer ($150k) is reasonable based on typical stale-listing flexibility.
- 3 sale attempts with the ask held roughly flat each time — persistent listings suggest the price (not the market) is what's stuck; bring a comps-based counter.
Risks & watch-outs
- Watch-outs: built in 1950 — expect roof / HVAC / electrical / plumbing capex.
- Climate carrying-cost: moderate wind risk, 26% chance of damaging wind over 30y; extreme-heat days projected 7→20/yr by 2055 (HVAC capex compounding) — expect insurance premiums to compound above CPI over the hold.
Questions for the listing agent
- What do current leases actually rent for vs. the listed asking? Can we see a recent rent roll and the last 12 months of T-12 income?
- It's been on market 38 days. Have you received any prior offers? Is the seller open to a 22% concession, seller financing, or rate buy-down credit?
- Built in 1950 — when were the roof, HVAC, electrical panel, plumbing, and water heater last replaced?
- Is there a deadline driving the sale (1031 exchange, divorce, estate, relocation)? That informs how much negotiation room exists.
- The area grade is low — what's the realistic commute time and amenity access for the typical tenant pool here? Any planned neighborhood developments (good or bad) we should know about?
- What's the average days-on-market for RENTAL listings here right now (not sales)? A rising rental-DOM trend means longer vacancies and softer asking-rent achievability than the comps imply.
- What's the recent tenant-quality profile in this submarket — average credit score on applications, eviction rate, late-payment / NSF rate, and stable-employment percentage? A property-management company in the area should have these aggregated.
- How much new for-sale + rental construction is in the pipeline within 1–3 miles? Heavy new supply typically softens prices + rents 12–24 months out; constrained supply supports both.
Investment metrics
- 1% rule
- 0.78% ✗
- Cap rate
- 5.36%
- Cash-on-cash
- -3.32%
- DSCR
- 0.85
- GRM
- 10.7
CMA / ARV
- ARV (median comp)
- $204,448
- List price
- $155,000
- Delta
- -24.19%
- Verdict
- UNDERPRICED
- Comps
- 20 within 1.0 mi
Show comp detail 12 sales within ~0.75 mi
| Address | Dist | Beds/Ba | Sqft | Sold | Price | $/sf | Match |
|---|---|---|---|---|---|---|---|
| 1722 Memory Ln NW | 0.29mi | 3/2.0 | 1,320 (+5%) | 6mo | $210,000 | $159 | 69 |
| 604 Douglas Dr NW | 0.27mi | 3/2.0 | 1,348 (+8%) | 6mo | $217,000 | $161 | 66 |
| 904 Rhodes St | 0.23mi | 2/1.0 (-1) | 1,316 (+5%) | 12mo | $158,000 | $120 | 66 |
| 1850 Peach Orchard Rd NW | 0.32mi | 3/2.0 | 1,333 (+6%) | 8mo | $215,000 | $161 | 64 |
| 1620 Peach Orchard Rd NW | 0.18mi | 3/1.0 | 1,088 (-13%) | 9mo | $192,000 | $176 | 62 |
| 1306 Sparkman St NW | 0.42mi | 3/1.0 | 1,133 (-10%) | 4mo | $162,000 | $143 | 62 |
| 501 Carol St | 0.37mi | 3/2.0 | 1,169 (-7%) | 10mo | $205,000 | $175 | 59 |
| 1401 Sparkman St | 0.26mi | 4/2.0 (+1) | 1,332 (+6%) | 13mo | $238,500 | $179 | 57 |
| 1515 Peach Orchard Rd NW | 0.22mi | 4/2.0 (+1) | 1,356 (+8%) | 15mo | $239,900 | $177 | 55 |
| 1935 Peach Orchard Rd NW | 0.43mi | 3/1.5 | 1,090 (-13%) | 20mo | $280,000 | $257 | 40 |
| 1111 NW Sparkman St | 0.59mi | 3/2.0 | 1,140 (-9%) | 22mo | $194,900 | $171 | 35 |
| 2006 Bailey St NW | 0.67mi | 3/2.0 | 1,397 (+12%) | 20mo | $235,000 | $168 | 29 |
Match score weights: distance 35% · size 25% · config 20% · recency 20%. Top-matched comps best support the ARV.
Projected returns pro-forma
-3.0% appreciation · 3.0% rent growth · sell at horizon
- IRR
- -21.8%
- Equity multiple
- 0.25×
- Total profit
- $-32,736
- Equity at exit
- $23,111
- IRR
- -15.6%
- Equity multiple
- 0.12×
- Total profit
- $-38,268
- Equity at exit
- $13,402
Cash invested: $43,400 (down + closing). Projections, not guarantees.
Landlord ↔ Tenant lean methodology
- Overall (STATE)
- 90 Strongly Landlord-Friendly
- State Alabama
- 90 Strongly Landlord-Friendly · R+15
- County
- — inherits STATE
- City
- — inherits STATE
ZIP-level market 35640
- Home prices YoY
- -13.6%
- Active inventory
- 193
- Price-to-rent
- 10.7×
Monthly cashflow live
- Estimated rent
- $1,204 medium interval (Pro) →
- Mortgage (P&I)
- −$813
- Tax est. 1.5%
- −$194 /mo · $2,325/yr
- Insurance
- −$65
- HOA
- −$0
- Vacancy / Maint / Mgmt
- −$253
- Net cashflow
- $-120
Break-even live
Sensitivity live
| Price | -10% $-13 | -5% $-66 | +0% $-120 | +5% $-173 | +10% $-227 |
|---|---|---|---|---|---|
| Rent | -10% $-215 | -5% $-167 | +0% $-120 | +5% $-72 | +10% $-25 |
| Rate | -1.0pp $-42 | -0.5pp $-81 | base $-120 | +0.5pp $-160 | +1.0pp $-201 |
UW: 25.0% down · 7.5% · 30yr · 1.5% tax · 5.0% vac · 8.0% maint · 8.0% mgmt
Financing live
Cash to close
- Down payment
- $38,750
- Closing costs
- $4,650
- Reserves months
- —
- Total cash needed
- —
Loan-product check · same deal, 3 products live
Conventional
25% down · 7.5% · 30yr
- Down + closing
- —
- Monthly P&I
- —
- Monthly cashflow
- —
- DSCR
- —
- Eligible?
- —
Personal DTI + credit; lowest rate.
DSCR
20% down · 8.5% · 30yr
- Down + closing
- —
- Monthly P&I
- —
- Monthly cashflow
- —
- DSCR
- —
- Eligible?
- —
No personal income docs; deal must DSCR.
Hard money
10% down · 12.0% · 12mo
- Down + closing
- —
- Monthly P&I
- —
- Monthly cashflow
- —
- DSCR
- —
- Eligible?
- —
Short-term bridge; refi at stabilization.
Rent comps 2 comps
| Address | Beds | Baths | Sqft | Rent | $/sqft | DOM | Units | Dist |
|---|---|---|---|---|---|---|---|---|
| 710 Midway St NW Hartselle, AL | 2.0 | 2.0 | 943 | $1,124 | $1.19 | 45d | 1 | 0.31mi |
| 500 Crestline Dr SW Hartselle, AL | 3.0 | 2.0 | 1420 | $1,500 | $1.06 | 16d | 1 | 1.32mi |
Listing history 24 events
-
2026-06-22days on market $155,000 Active 38 DOM
-
2026-06-21days on market $155,000 Active 37 DOM
-
2026-06-19days on market $155,000 Active 35 DOM
-
2026-06-18days on market $155,000 Active 34 DOM
-
2026-06-17days on market $155,000 Active 33 DOM
-
2026-06-16days on market $155,000 Active 32 DOM
-
2026-06-15days on market $155,000 Active 31 DOM
-
2026-06-14days on market $155,000 Active 29 DOM
-
2026-06-12days on market $155,000 Active 28 DOM
-
2026-06-09days on market $155,000 Active 25 DOM
-
2026-06-08days on market $155,000 Active 24 DOM
-
2026-06-07days on market $155,000 Active 23 DOM
-
2026-06-07days on market $155,000 Active 22 DOM
-
2026-06-04days on market $155,000 Active 19 DOM
-
2026-06-02days on market $155,000 Active 18 DOM
-
2026-06-01days on market $155,000 Active 17 DOM
-
2026-05-31days on market $155,000 Active 16 DOM
-
2026-05-31days on market $155,000 Active 15 DOM
-
2026-05-15$155,000 Active 611-char remark
-
2026-02-08historical Contingent
-
2026-01-23status Active
-
2026-01-12historical Contingent
-
2025-12-08price $172,000
-
2025-12-08$164,000 Active
ⓘ Source: listings_history table (triggers on properties + properties_extension) + one-shot
backfill from property_details.listing_events for pre-trigger history.
Climate risk First Street
- Flood 1/10 Low FEMA zone X (unshaded) · 0% chance over 30 yrs
- Wildfire 4/10 Moderate
- Heat 5/10 Major 7 d/yr ≥106°F today · 20 d/yr by 30 yrs out
- Wind 5/10 Major 26% chance of damaging wind over 30 yrs
- Air quality 2/10 Low 1 unhealthy d/yr today · 1 by 30 yrs out
Nearby sold comps map
Loading sold comps map…
Walkable amenities ~0.75 mi
Loading nearby amenities…
Taxation est. · year 1
- Rental income
- $14,449
- − Mortgage interest
- −$8,682
- − Property taxes
- −$2,325
- − Insurance
- −$775
- − Repairs & maintenance
- −$1,156
- − Management
- −$1,156
- − Depreciation
- −$4,509
- Taxable loss
- −$4,154
- Est. tax savings @ 24.0%
- +$997
- After-tax cash flow
- $-442/yr
For passive investors: Depreciation is non-cash, so a rental often shows a tax loss while cash-flowing — sheltering income. Rental losses are passive: they offset passive income freely, and up to $25,000/yr can offset ordinary (W-2) income if you actively participate and your MAGI is under $100k (phasing out to $0 by $150k); unused losses carry forward. On sale, claimed depreciation is recaptured at up to 25%, and gains may owe capital-gains tax (a 1031 exchange can defer both). Figures are a year-1 estimate at your 24.0% rate — not tax advice; consult a CPA.
Schools (NCES district)
- District
- Hartselle City
- NCES district ID
- 0101730
- Math proficiency
- 41% ▼ -25.00%
- Reading proficiency
- 64% ▼ -1.00%
- Median HH income
- $51,169
- Composite
- 44.88/100
- National rank
- #2717
- State rank
- #10 of 129 in AL
Livability — Hartselle
- Score
- 72/100
- State rank
- #32
- US rank
- #6515
Category grades
Schools grade is shown separately in the Schools card above.
Census & demographics
- Census place
- Hartselle, AL
- City population
- 26,976
- Population (ZIP)
- 26,976
Population outlook (Morgan County) Hauer SSP2
- Today (2025)
- 118,775 people
- By 2030
- 116,979 · -1.5%
- By 2040
- 111,800 · -5.9%
- By 2050
- 105,181 · -11.4%
- By 2075
- 87,736 · -26.1%
- By 2100
- 67,624 · -43.1%
Race, ethnicity, and origin ACS 2023
- Neighborhood character
- Predominantly White (89%)
- Race & ethnicity
- White 89% Black 5% Two or more races 4% Hispanic / Latino 2%
- Common ancestry
- Slovak 3% Italian 2% Lithuanian 1%
- Foreign-born
- 1% · Canada
- Languages at home
- 98% English-only · Spanish 2%
Political lean MEDSL · Morgan
- 2024 margin
- Solid R (+52.6) · D 23.2% · R 75.8%
- 2008→2024 swing
- -8.8pp toward R · 2008: -43.8pp · 2024: -52.6pp
- All cycles
- 2024: R+52.6 2020: R+49.2 2016: R+52.4 2012: R+44.5 2008: R+43.8
Not yet ingested
- Civics
- —
Market trends
- HPI YoY
- ▼ -38.12%
- Current HPI
- 242.5778
- Rent YoY
- —
- Metro
- —
- State GDP YoY
- ▲ 2.94%
- F500 in state
- 4
Industry mix (Fortune 500 HQ in AL)
| Industry | F500 HQs | Revenue |
|---|---|---|
| Financial Services | 1 | $8B |
|
||
| Healthcare | 1 | $5B |
|
||
Price history
-5.5% since first listed6 events — show timeline
- 2026-05-15 Listed $155,000 VMLS
- 2026-02-08 Contingent — VMLS
- 2026-01-23 Relisted — VMLS
- 2026-01-12 Contingent — VMLS
- 2025-12-08 Price Changed $172,000 VMLS
- 2025-12-08 Listed $164,000 VMLS
Property tax history
+4.5%/yrLatest (2025): $307 · +18.3% YoY. Source: county tax records.
Cash-flow waterfall
monthlySold comps — $/sqft
last 12 mo · ≤1 miLoading sold comps…