1113 Railroad · Silsbee, TX
Flood risk 1/10 · Minimal
- FEMA flood zone
- X (unshaded)
- Chance of flooding over 30 yrs
- 0.0%
- Est. flood insurance / yr
- $507 – $1,088
Fire risk 3/10 · Minor
- Est. fire insurance / yr
- $1,222 – $2,270
Heat risk 9/10 · Severe
- Hot days now (above 112°F)
- 7 days/yr
- Hot days in 30 yrs
- 23 days/yr
Wind risk 8/10 · Major
- Chance of severe wind over 30 yrs
- 99.0%
Air-quality risk 2/10 · Minimal
- Unhealthy air days now
- 0 days/yr
- Unhealthy air days in 30 yrs
- 1 days/yr
Risk factors via First Street. Map © Google.
Why this score? — see what drove the C grade
The composite is a weighted blend of 9 inputs, each scored 0–100. Each bar is that input's sub-score; the figure is the points it added to the 100-point composite (weight × sub-score).
- Cash flow +28.1/30.0
- DSCR +10.0/10.0
- 1% rule +7.4/10.0
- Livability +3.6/5.0
- Schools +2.6/10.0
- Rent growth +2.5/5.0
- Condition / age +2.5/5.0
- ARV discount +0.0/15.0
- Appreciation +0.0/10.0
$109,900
🖨 Deal sheet 📄 Offer letter ✓ Due diligence
Listing remarks MLS
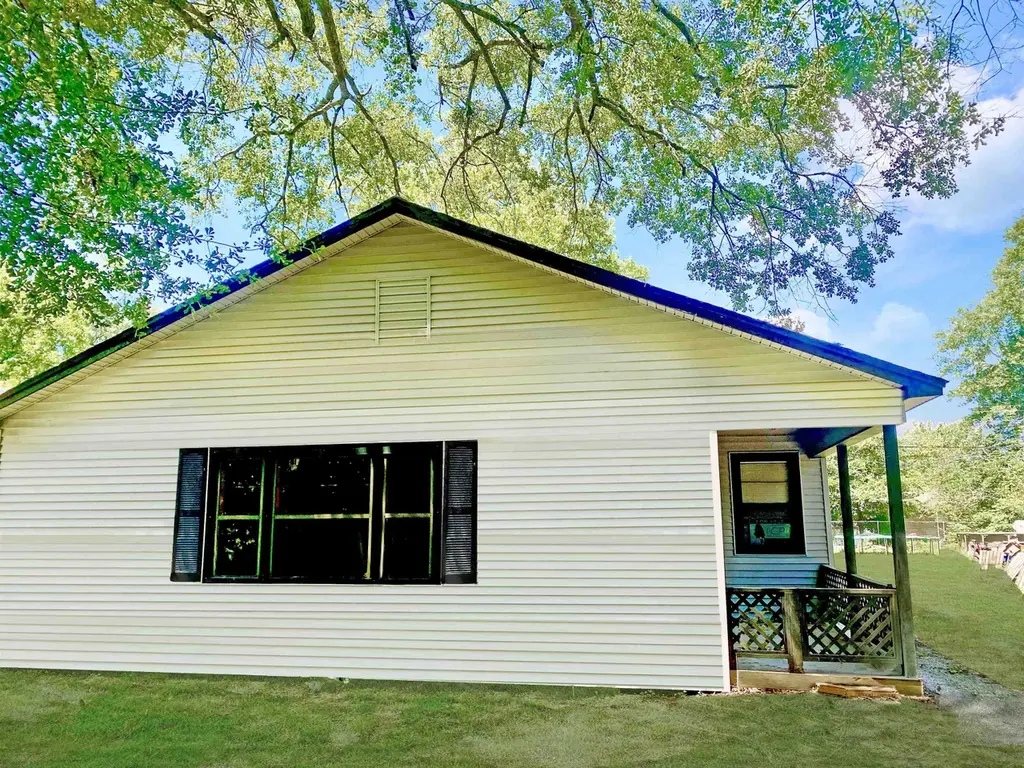
Investors Purchase with built-in renters! Charming Silsbee Home with Covered Outdoor Living & Easy Hwy Access. Welcome to this well-kept 2-bedroom, 1-bath home in the heart of Silsbee. Step inside to a spacious living room that flows seamlessly into a functional U-shaped kitchen, complete with appliances and a charming garden window—perfect for growing fresh herbs or adding natural light. A separate laundry closet/pantry provides practical storage, while durable vinyl click-and-lock flooring throughout offers easy maintenance with no carpet to worry about. Outside, enjoy a large 24x20 gazebo ideal for covered entertaining, outdoor gatherings, or relaxing evenings. The structure also offers the potential to be enclosed and converted into a garage, adding future value. The fully fenced yard provides privacy and flexibility for pets, play, or projects. Conveniently located with quick access to Hwy 96, this home is commuter-friendly and zoned to Silsbee ISD.
Key facts
- U-shaped kitchen
- Vinyl flooring
- Large gazebo
Tags
Neighborhood map
What this means for you Summary
Snapshot
- This is a 2-bed/1.0-bath single-family listed at $110k.
Deal economics
- At list price, monthly cash flow is $347 ($4k/yr) — positive.
- The deal already cash-flows at list — no discount required.
- Meets the 1% rule at list price ($1k rent vs $110k).
- Recommended offer: $97k (12.0% below list) — sets the bar for market timing.
- Cap rate 10.1% vs local median 5.2% in Silsbee — top-decile yield for the area; either an underpriced asset or a hidden risk that comps aren't pricing in. Stress-test before assuming the spread holds.
Location & tenants
- Location reads 72/100 on livability (#263 in TX) — a middle-class / working-renter tenant base. Strengths: cost of living A+, housing A+, health & safety A+; Watch: schools C-, amenities F, commute F.
- Silsbee ISD (town): math 25% / reading 36% proficiency, ranked #614 of 826 in TX (top 74%) — families likely to look elsewhere, expect single-tenant / working-renter base with shorter leases.
- Market conditions: 127 active listings in the ZIP; 5 comparable units currently listed for rent nearby; rentals at typical pace (median 21d on market — plan ~3-4 weeks tenant-placement turnaround); 40% of comp listings sitting > 30 days — soft ceiling on asking rent; 358 units permitted in Hardin County in 2024 (0 in 5+ unit buildings).
Forward outlook
- Local home prices are declining (-3.0%/yr); year-one equity from $760 of loan paydown is wiped out by about $3k of value loss. Plan a longer hold.
- At projected returns (-3.0% appreciation + 3.0% rent growth), your $31k cash investment doubles in ~9 years — after that, you're playing with house money.
Negotiation context
- It's been on market 151 days — a 12% lower offer ($97k) is reasonable based on typical stale-listing flexibility.
- 7 sale attempts; this cycle's ask is 9891% above the opening price — seller raised mid-cycle; expect resistance to lowballs.
Risks & watch-outs
- Watch-outs: built in 1958 — expect roof / HVAC / electrical / plumbing capex.
- Climate carrying-cost: severe wind risk, 99% chance of damaging wind over 30y; extreme-heat days projected 7→23/yr by 2055 (HVAC capex compounding) — expect insurance premiums to compound above CPI over the hold.
Questions for the listing agent
- It's been on market 151 days. Have you received any prior offers? Is the seller open to a 12% concession, seller financing, or rate buy-down credit?
- Built in 1958 — when were the roof, HVAC, electrical panel, plumbing, and water heater last replaced?
- Why hasn't it sold? Are there any deal-killer items the seller is aware of (foundation, flood, title, zoning, code violations)?
- Is there a deadline driving the sale (1031 exchange, divorce, estate, relocation)? That informs how much negotiation room exists.
- What's the average days-on-market for RENTAL listings here right now (not sales)? A rising rental-DOM trend means longer vacancies and softer asking-rent achievability than the comps imply.
- What's the recent tenant-quality profile in this submarket — average credit score on applications, eviction rate, late-payment / NSF rate, and stable-employment percentage? A property-management company in the area should have these aggregated.
- How much new for-sale + rental construction is in the pipeline within 1–3 miles? Heavy new supply typically softens prices + rents 12–24 months out; constrained supply supports both.
Investment metrics
- 1% rule
- 1.24% ✓
- Cap rate
- 10.08%
- Cash-on-cash
- 13.52%
- DSCR
- 1.60
- GRM
- 6.7
CMA / ARV
- ARV (median comp)
- $92,797
- List price
- $109,900
- Delta
- 18.43%
- Verdict
- OVERPRICED
- Comps
- 6 within 1.0 mi
Show comp detail 2 sales within ~0.75 mi
| Address | Dist | Beds/Ba | Sqft | Sold | Price | $/sf | Match |
|---|---|---|---|---|---|---|---|
| 1153 Railroad St | 0.10mi | 2/1.0 | 1,046 (-2%) | 3mo | $147,000 | $141 | 89 |
| 655 N 2nd St | 0.27mi | 3/1.0 (+1) | 1,128 (+5%) | 19mo | $49,900 | $44 | 58 |
Match score weights: distance 35% · size 25% · config 20% · recency 20%. Top-matched comps best support the ARV.
Projected returns pro-forma
-3.0% appreciation · 3.0% rent growth · sell at horizon
- IRR
- 3.6%
- Equity multiple
- 1.14×
- Total profit
- $4,273
- Equity at exit
- $16,386
- IRR
- 13.1%
- Equity multiple
- 2.05×
- Total profit
- $32,167
- Equity at exit
- $9,502
Cash invested: $30,772 (down + closing). Projections, not guarantees.
Landlord ↔ Tenant lean methodology
- Overall (STATE)
- 87 Strongly Landlord-Friendly
- State Texas
- 87 Strongly Landlord-Friendly · R+5
- County
- — inherits STATE
- City
- — inherits STATE
ZIP-level market 77656
- Active inventory
- 127
- Price-to-rent
- 6.7×
Monthly cashflow live
- Estimated rent
- $1,368 high interval (Pro) →
- Mortgage (P&I)
- −$576
- Tax from tax record
- −$112 /mo · $1,340/yr
- Insurance
- −$46
- HOA
- −$0
- Vacancy / Maint / Mgmt
- −$287
- Net cashflow
- $347
Break-even live
UW: 25.0% down · 7.5% · 30yr · 1.5% tax · 5.0% vac · 8.0% maint · 8.0% mgmt
Financing live
Cash to close
- Down payment
- $27,475
- Closing costs
- $3,297
- Reserves months
- —
- Total cash needed
- —
Loan-product check · same deal, 3 products live
Conventional
25% down · 7.5% · 30yr
- Down + closing
- —
- Monthly P&I
- —
- Monthly cashflow
- —
- DSCR
- —
- Eligible?
- —
Personal DTI + credit; lowest rate.
DSCR
20% down · 8.5% · 30yr
- Down + closing
- —
- Monthly P&I
- —
- Monthly cashflow
- —
- DSCR
- —
- Eligible?
- —
No personal income docs; deal must DSCR.
Hard money
10% down · 12.0% · 12mo
- Down + closing
- —
- Monthly P&I
- —
- Monthly cashflow
- —
- DSCR
- —
- Eligible?
- —
Short-term bridge; refi at stabilization.
Rent comps 5 comps
| Address | Beds | Baths | Sqft | Rent | $/sqft | DOM | Units | Dist |
|---|---|---|---|---|---|---|---|---|
| 1108 N 3rd St Silsbee, TX | 3.0 | 1.5 | 1500 | $1,500 | $1.00 | 21d | 1 | 0.12mi |
| 454 Winters St Silsbee, TX | 3.0 | 2.0 | 1330 | $1,695 | $1.27 | 21d | 1 | 0.88mi |
| 1135 Texas 327 Unit T204 Silsbee, TX | 2.0 | 2.0 | 782 | $745 | $0.95 | 43d | 1 | 1.07mi |
| 1135 Texas 327 Unit T212 Silsbee, TX | 2.0 | 2.0 | 782 | $745 | $0.95 | 21d | 1 | 1.07mi |
| 750 S 3rd St Unit 12 Silsbee, TX | 2.0 | 1.0 | 900 | $875 | $0.97 | 43d | 1 | 1.11mi |
Listing history 25 events
-
2026-06-10days on market $109,900 Active 151 DOM
-
2026-06-09days on market $109,900 Active 150 DOM
-
2026-06-08days on market $109,900 Active 149 DOM
-
2026-06-07days on market $109,900 Active 148 DOM
-
2026-06-03days on market $109,900 Active 144 DOM
-
2026-06-02days on market $109,900 Active 143 DOM
-
2026-06-01days on market $109,900 Active 142 DOM
-
2026-05-31days on market $109,900 Active 141 DOM
-
2026-05-30days on market $109,900 Active 140 DOM
-
2026-03-16historical $1,075
-
2026-03-05price $1,075
-
2026-02-09$1,100
-
2026-01-11$109,900 Active 981-char remark
Show marketing remark (981 chars)
Investors Purchase with built-in renters! Charming Silsbee Home with Covered Outdoor Living & Easy Hwy Access. Welcome to this well-kept 2-bedroom, 1-bath home in the heart of Silsbee. Step inside to a spacious living room that flows seamlessly into a functional U-shaped kitchen, complete with appliances and a charming garden window—perfect for growing fresh herbs or adding natural light. A separate laundry closet/pantry provides practical storage, while durable vinyl click-and-lock flooring throughout offers easy maintenance with no carpet to worry about. Outside, enjoy a large 24x20 gazebo ideal for covered entertaining, outdoor gatherings, or relaxing evenings. The structure also offers the potential to be enclosed and converted into a garage, adding future value. The fully fenced yard provides privacy and flexibility for pets, play, or projects. Conveniently located with quick access to Hwy 96, this home is commuter-friendly and zoned to Silsbee ISD.
-
2025-06-29historical $1,100
-
2025-05-13$1,100
-
2025-05-07historical $1,100
-
2025-05-04$1,100
-
2025-05-03historical $1,100
-
2025-04-05price $1,100
-
2025-03-21$1,225
-
2025-03-21historical $1,265
-
2025-03-10$1,265
-
2025-03-10historical $1,265
-
2025-02-17$1,265
-
2018-03-06soldstatus
ⓘ Source: listings_history table (triggers on properties + properties_extension) + one-shot
backfill from property_details.listing_events for pre-trigger history.
Tax reassessment forecast TX · Resets to sale price
- Current annual tax
- $1,340 · $112/mo
- Projected year-2 tax
- $2,011 · $168/mo
- Expected delta
- +$672/yr (+$56/mo · 50.1%)
ⓘ Screening estimate from a state-policy table — verify with the county assessor before closing.
Climate risk First Street
- Flood 1/10 Low FEMA zone X (unshaded) · 0% chance over 30 yrs
- Wildfire 3/10 Moderate
- Heat 9/10 Extreme 7 d/yr ≥112°F today · 23 d/yr by 30 yrs out
- Wind 8/10 Severe 99% chance of damaging wind over 30 yrs
- Air quality 2/10 Low 0 unhealthy d/yr today · 1 by 30 yrs out
Nearby sold comps map
Loading sold comps map…
Walkable amenities ~0.75 mi
Loading nearby amenities…
Taxation est. · year 1
- Rental income
- $16,411
- − Mortgage interest
- −$6,156
- − Property taxes
- −$1,340
- − Insurance
- −$550
- − Repairs & maintenance
- −$1,313
- − Management
- −$1,313
- − Depreciation
- −$3,197
- Taxable income
- $2,543
- Est. tax owed @ 24.0%
- −$610
- After-tax cash flow
- $3,549/yr
For passive investors: Depreciation is non-cash, so a rental often shows a tax loss while cash-flowing — sheltering income. Rental losses are passive: they offset passive income freely, and up to $25,000/yr can offset ordinary (W-2) income if you actively participate and your MAGI is under $100k (phasing out to $0 by $150k); unused losses carry forward. On sale, claimed depreciation is recaptured at up to 25%, and gains may owe capital-gains tax (a 1031 exchange can defer both). Figures are a year-1 estimate at your 24.0% rate — not tax advice; consult a CPA.
Schools (NCES district)
- District
- Silsbee ISD
- NCES district ID
- 4840230
- Math proficiency
- 25% ▼ -23.00%
- Reading proficiency
- 36% ▼ -11.00%
- Median HH income
- $44,907
- Composite
- 26.09/100
- National rank
- #7292
- State rank
- #614 of 826 in TX
Livability — Silsbee
- Score
- 72/100
- State rank
- #263
- US rank
- #6215
Category grades
Schools grade is shown separately in the Schools card above.
Census & demographics
- Census place
- Silsbee, TX
- County
- Hardin County · 39,783 people
- City population
- 17,525
- Metro
- Beaumont-Port Arthur, TX
- Population (ZIP)
- 17,525
- Household income
- $62,303
- Rent vs Own
- Severe rent burden
- 306.0
Population outlook (Hardin County) Hauer SSP2
- Today (2025)
- 57,780 people
- By 2030
- 58,296 · +0.9%
- By 2040
- 58,421 · +1.1%
- By 2050
- 57,391 · -0.7%
- By 2075
- 53,132 · -8.0%
- By 2100
- 44,905 · -22.3%
Race, ethnicity, and origin ACS 2023
- Neighborhood character
- Predominantly White (74%)
- Race & ethnicity
- White 74% Black 14% Two or more races 8% Hispanic / Latino 7%
- Hispanic origin (detail)
- Mexican 4%
- Common ancestry
- Lithuanian 4% Serbian 3% Italian 2%
- Foreign-born
- 3% · Canada
- Languages at home
- 96% English-only · Spanish 3% Other Indo-European 1%
Political lean MEDSL · Hardin
- 2024 margin
- Solid R (+75.8) · D 11.9% · R 87.7%
- 2008→2024 swing
- -14.6pp toward R · 2008: -61.2pp · 2024: -75.8pp
- All cycles
- 2024: R+75.8 2020: R+73.8 2016: R+73.9 2012: R+67.6 2008: R+61.2
Not yet ingested
- Civics
- —
Market trends
- HPI YoY
- ▼ -93.73%
- Current HPI
- 141.1371
- Rent YoY
- —
- Metro
- Beaumont-Port Arthur, TX
- State GDP YoY
- ▲ 3.95%
- F500 in state
- 110
Industry mix (Fortune 500 HQ in TX)
| Industry | F500 HQs | Revenue |
|---|---|---|
| Energy | 16 | $1,198B |
|
||
| Technology | 5 | $198B |
|
||
| Engineering / Construction | 4 | $72B |
|
||
| Energy Services | 3 | $60B |
|
||
| Utilities | 3 | $41B |
|
||
| Healthcare | 2 | $330B |
|
||
Price history
-15.0% since first listed16 events — show timeline
- 2026-03-16 Rental Removed $1,075 BBOR
- 2026-03-05 Price Changed $1,075 BBOR
- 2026-02-09 Listed for Rent $1,100 BBOR
- 2026-01-11 Listed $109,900 BBOR
- 2025-06-29 Rental Removed $1,100 BBOR
- 2025-05-13 Listed for Rent $1,100 BBOR
- 2025-05-07 Rental Removed $1,100 LISTANZA
- 2025-05-04 Listed for Rent $1,100 LISTANZA
- 2025-05-03 Rental Removed $1,100 BBOR
- 2025-04-05 Price Changed $1,100 BBOR
- 2025-03-21 Listed for Rent $1,225 BBOR
- 2025-03-21 Rental Removed $1,265 LISTANZA
- 2025-03-10 Listed for Rent $1,265 LISTANZA
- 2025-03-10 Rental Removed $1,265 BBOR
- 2025-02-17 Listed for Rent $1,265 BBOR
- 2018-03-06 Sold (Public Records) — Public Records
Property tax history
+2.2%/yrLatest (2025): $1,340 · -1.4% YoY. Source: county tax records.
Cash-flow waterfall
monthlySold comps — $/sqft
last 12 mo · ≤1 miLoading sold comps…