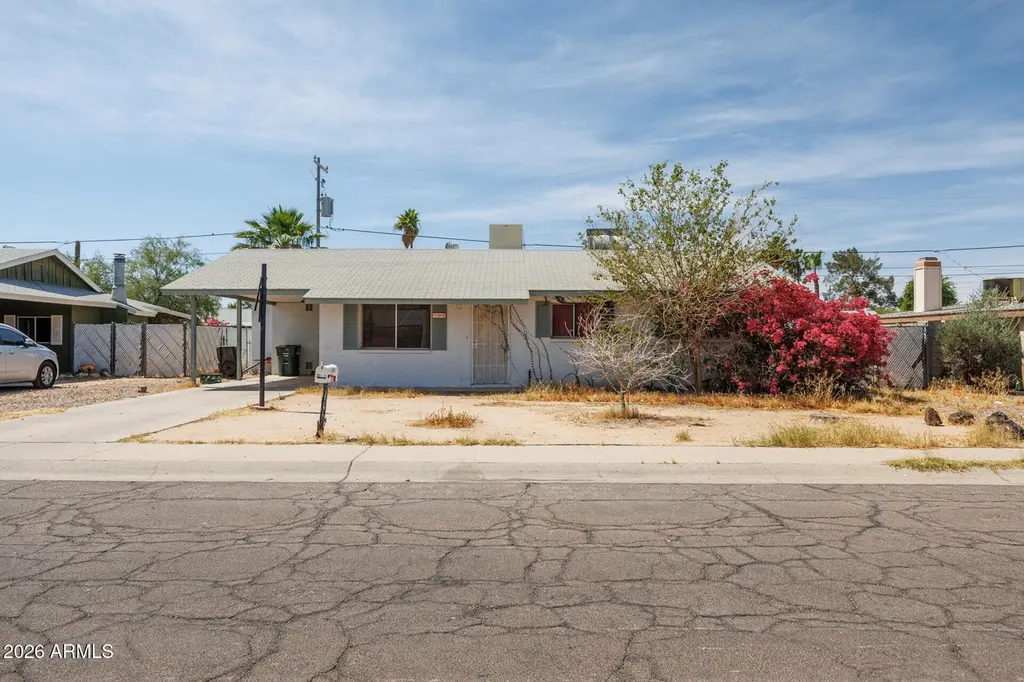
725 E Manor Dr · Casa Grande, AZ
Flood risk 1/10 · Minimal
- FEMA flood zone
- X (unshaded)
- Chance of flooding over 30 yrs
- 0.0%
- Est. flood insurance / yr
- $507 – $1,088
Fire risk 6/10 · Moderate
- Est. fire insurance / yr
- $610 – $1,132
Heat risk 9/10 · Severe
- Hot days now (above 113°F)
- 7 days/yr
- Hot days in 30 yrs
- 19 days/yr
Wind risk 1/10 · Minimal
- Chance of severe wind over 30 yrs
- —
Air-quality risk 1/10 · Minimal
- Unhealthy air days now
- 0 days/yr
- Unhealthy air days in 30 yrs
- 0 days/yr
Risk factors via First Street. Map © Google.
Why this score? — see what drove the B- grade
The composite is a weighted blend of 9 inputs, each scored 0–100. Each bar is that input's sub-score; the figure is the points it added to the 100-point composite (weight × sub-score).
- Cash flow +27.9/30.0
- ARV discount +15.0/15.0
- DSCR +9.9/10.0
- 1% rule +6.6/10.0
- Rent growth +3.7/5.0
- Livability +2.9/5.0
- Condition / age +2.5/5.0
- Schools +1.5/10.0
- Appreciation +0.0/10.0
$179,000
🖨 Deal sheet 📄 Offer letter ✓ Due diligence
Listing remarks
This 1691 sq/ft home features 3 bedroom and 2 bathrooms with tile throughout the home. Great location in town - close to shopping and amenities. This property needs some work but has huge potential.
Key facts
- 7,105 sq ft lot
- Parking
- Built 1967
Property features AI
Finance
- Financial info: Non-assumable financing
- HOA & community: No association fees
Exterior
- Parking: Covered parking for 1 vehicle; RV gate; 1-car carport
- Utilities: City water; Public sewer
- Home design: Single family residence; Fee simple ownership
- Construction: Stucco, painted, and block construction; Composition roof
- Exterior features: Chain link fencing; Dirt front yard; Dirt back yard
Interior
- Kitchen: Built-in electric oven
- Bedrooms: Up to 3 bedrooms
- Bathrooms: 2 full bathrooms
- Heating & cooling: Central air conditioning; Natural gas heating
- Interior features: Eat-in kitchen; Full bathroom in primary bedroom
- Laundry & utility: Washer/dryer hookup only; Gas dryer hookup
Neighborhood map
What this means for you Summary
Snapshot
- This is a 3-bed/2.0-bath single-family listed at $179k.
Deal economics
- At list price, monthly cash flow is $551 ($7k/yr) — positive.
- The deal already cash-flows at list — no discount required.
- Meets the 1% rule at list price ($2k rent vs $179k).
- Recommended offer: $176k (1.5% below list) — sets the bar for market timing.
- Cap rate 10.0% vs local median 4.1% in Casa Grande — top-decile yield for the area; either an underpriced asset or a hidden risk that comps aren't pricing in. Stress-test before assuming the spread holds.
Location & tenants
- Location reads 58/100 on livability (#220 in AZ) — a working-class tenant base; expect higher turnover. Strengths: cost of living A+, housing A+; Watch: crime D+, employment D+, amenities F.
- Casa Grande Union High School District (4453) (suburban): math 14% / reading 21% proficiency, ranked #193 of 249 in AZ (top 78%) — low school quality limits family demand, transient renter base, plan for 1-2y turnover.
- Zoned schools: Casa Grande Union High School (math 18% / reading 25%, grade F, #217 of 381 statewide, top 57%, 2,132 students, 52% FRL).
- Market conditions: Rents rising fast (+4.6%/yr); 628 active listings in the ZIP; 33 comparable units currently listed for rent nearby; rentals at typical pace (median 15d on market — plan ~3-4 weeks tenant-placement turnaround); 9,504 units permitted in Pinal County in 2024 (776 in 5+ unit buildings).
- This rent runs 36% of the median local income ($68k/yr) — at the standard rent-burdened threshold; future hikes will face affordability resistance.
Forward outlook
- Local home prices are declining (-3.0%/yr); year-one equity from $1k of loan paydown is wiped out by about $5k of value loss. Plan a longer hold.
- At projected returns (-3.0% appreciation + 4.6% rent growth), your $50k cash investment doubles in ~8 years — after that, you're playing with house money.
Negotiation context
- It's been on market 28 days — a 2% lower offer ($176k) is reasonable based on typical stale-listing flexibility.
- 2 sale attempts since 19y ago with the ask held roughly flat each time — persistent listings suggest the price (not the market) is what's stuck; bring a comps-based counter.
- Current owner paid $70k; list at $179k implies a 154% gain — meaningful room to come down on a strong offer.
Risks & watch-outs
- Climate carrying-cost: major wildfire risk; extreme-heat days projected 7→19/yr by 2055 (HVAC capex compounding) — expect insurance premiums to compound above CPI over the hold.
Questions for the listing agent
- Built in 1967 — when were the roof, HVAC, electrical panel, plumbing, and water heater last replaced?
- Is there a deadline driving the sale (1031 exchange, divorce, estate, relocation)? That informs how much negotiation room exists.
- Schools are F-rated, which usually means shorter tenancies and higher turnover. Who's the typical renter profile here, and what's been the actual vacancy rate?
- Crime grade is D in this area — have there been break-ins, vandalism, or insurance claims at this property in the last 3 years? What carrier currently insures it and at what premium?
- What's the average days-on-market for RENTAL listings here right now (not sales)? A rising rental-DOM trend means longer vacancies and softer asking-rent achievability than the comps imply.
- What's the recent tenant-quality profile in this submarket — average credit score on applications, eviction rate, late-payment / NSF rate, and stable-employment percentage? A property-management company in the area should have these aggregated.
- How much new for-sale + rental construction is in the pipeline within 1–3 miles? Heavy new supply typically softens prices + rents 12–24 months out; constrained supply supports both.
Investment metrics
- 1% rule
- 1.16% ✓
- Cap rate
- 9.98%
- Cash-on-cash
- 13.18%
- DSCR
- 1.59
- GRM
- 7.2
CMA / ARV
- ARV (on-the-fly)
- $300,998
- Comps found
- 12
Show comp detail 12 sales within ~0.75 mi
| Address | Dist | Beds/Ba | Sqft | Sold | Price | $/sf | Match |
|---|---|---|---|---|---|---|---|
| 1180 E Brenda Dr | 0.27mi | 3/2.0 | 1,736 (+3%) | 1mo | $225,000 | $130 | 82 |
| 1116 E 11th St E | 0.33mi | 4/2.0 (+1) | 1,669 (-1%) | 1mo | $265,000 | $159 | 77 |
| 1156 E 12th St | 0.39mi | 3/1.5 | 1,705 (+1%) | 4mo | $224,500 | $132 | 75 |
| 1237 E Paul Dr | 0.52mi | 4/2.0 (+1) | 1,690 (-0%) | 0mo | $320,000 | $189 | 70 |
| 1469 N Pueblo Dr | 0.30mi | 3/2.0 | 1,850 (+9%) | 1mo | $250,000 | $135 | 69 |
| 1580 N Himosa Dr | 0.49mi | 3/2.0 | 1,600 (-5%) | 4mo | $435,000 | $272 | 65 |
| 702 E Manor Dr | 0.16mi | 4/2.0 (+1) | 1,452 (-14%) | 3mo | $259,900 | $179 | 62 |
| 1462 N Kadota Ave | 0.18mi | 4/3.0 (+1) | 1,460 (-14%) | 0mo | $60,000 | $41 | 60 |
| 1732 N Cameron St | 0.72mi | 3/2.0 | 1,640 (-3%) | 3mo | $350,000 | $213 | 59 |
| 1112 N Olive Ave | 0.67mi | 3/2.0 | 1,597 (-6%) | 1mo | $275,000 | $172 | 58 |
| 1137 E Viola Ct | 0.72mi | 4/2.0 (+1) | 1,690 (-0%) | 5mo | $300,000 | $178 | 57 |
| 1103 N Olive Ave | 0.71mi | 3/2.0 | 1,910 (+13%) | 1mo | $379,900 | $199 | 44 |
Match score weights: distance 35% · size 25% · config 20% · recency 20%. Top-matched comps best support the ARV.
Projected returns pro-forma
-3.0% appreciation · 4.6% rent growth · sell at horizon
- IRR
- 4.8%
- Equity multiple
- 1.19×
- Total profit
- $9,380
- Equity at exit
- $26,689
- IRR
- 15.5%
- Equity multiple
- 2.35×
- Total profit
- $67,418
- Equity at exit
- $15,477
Cash invested: $50,120 (down + closing). Projections, not guarantees.
Landlord ↔ Tenant lean methodology
- Overall (STATE)
- 87 Strongly Landlord-Friendly
- State Arizona
- 87 Strongly Landlord-Friendly · R+3
- County
- — inherits STATE
- City
- — inherits STATE
ZIP-level market 85122
- Home prices YoY
- -22.4%
- Rents YoY
- 4.6%
- Active inventory
- 628
- Price-to-rent
- 7.2×
Monthly cashflow live
- Estimated rent
- $2,070 high interval (Pro) →
- Mortgage (P&I)
- −$939
- Tax from tax record
- −$72 /mo · $860/yr
- Insurance
- −$75
- HOA
- −$0
- Vacancy / Maint / Mgmt
- −$435
- Net cashflow
- $551
Break-even live
UW: 25.0% down · 7.5% · 30yr · 1.5% tax · 5.0% vac · 8.0% maint · 8.0% mgmt
Financing live
Cash to close
- Down payment
- $44,750
- Closing costs
- $5,370
- Reserves months
- —
- Total cash needed
- —
Loan-product check · same deal, 3 products live
Conventional
25% down · 7.5% · 30yr
- Down + closing
- —
- Monthly P&I
- —
- Monthly cashflow
- —
- DSCR
- —
- Eligible?
- —
Personal DTI + credit; lowest rate.
DSCR
20% down · 8.5% · 30yr
- Down + closing
- —
- Monthly P&I
- —
- Monthly cashflow
- —
- DSCR
- —
- Eligible?
- —
No personal income docs; deal must DSCR.
Hard money
10% down · 12.0% · 12mo
- Down + closing
- —
- Monthly P&I
- —
- Monthly cashflow
- —
- DSCR
- —
- Eligible?
- —
Short-term bridge; refi at stabilization.
Rent comps 33 comps
| Address | Beds | Baths | Sqft | Rent | $/sqft | DOM | Units | Dist |
|---|---|---|---|---|---|---|---|---|
| 1620 N Trekell Rd Casa Grande, AZ | 1.0–3.0 | 1.0–2.5 | 1090 | $2,640 | $2.42 | 1d | 1 | 0.41mi |
| 1131 E Trinity Pl Casa Grande, AZ | 4.0 | 2.5 | 1600 | $1,650 | $1.03 | 24d | 1 | 0.46mi |
| 1642 N Cameron St Casa Grande, AZ | 3.0 | 2.5 | 1577 | $3,250 | $2.06 | 24d | 1 | 0.52mi |
| 919 N Gilbert Ave Casa Grande, AZ | 3.0 | 2.0 | 1630 | $1,975 | $1.21 | 5d | 1 | 0.52mi |
| 1640 N Cameron St Unit 1640 Casa Grande, AZ | 3.0 | 2.5 | 1577 | $3,250 | $2.06 | 24d | 1 | 0.53mi |
| 1640 N Cameron St Casa Grande, AZ | 3.0 | 2.0 | 1577 | $3,250 | $2.06 | 22d | 1 | 0.53mi |
| 1640 N Cameron St Casa Grande, AZ | 3.0 | 2.0 | 1577 | $3,250 | $2.06 | 24d | 1 | 0.53mi |
| 928 N Pueblo Dr Casa Grande, AZ | 3.0 | 2.0 | 1300 | $1,550 | $1.19 | 24d | 1 | 0.55mi |
| 1025 N Menze St Casa Grande, AZ | 3.0 | 1.5 | 1301 | $1,695 | $1.30 | 13d | 1 | 0.58mi |
| 1007 N Menze St Casa Grande, AZ | 4.0 | 2.0 | 1539 | $1,580 | $1.03 | 5d | 1 | 0.61mi |
| 846 N Pueblo Dr #138 Casa Grande, AZ | 3.0 | 2.0 | 1324 | $1,700 | $1.28 | 15d | 1 | 0.64mi |
| 1161 E O'Neil Dr Casa Grande, AZ | 2.0–4.0 | 2.0 | 1144 | $1,498 | $1.31 | 3d | 12 | 0.68mi |
| 1775 N Terrace Cir Casa Grande, AZ | 3.0 | 2.0 | 1628 | $1,699 | $1.04 | 15d | 1 | 0.75mi |
| 1153 E Gabrilla Dr Casa Grande, AZ | 4.0 | 2.0 | 1689 | $1,795 | $1.06 | 20d | 1 | 0.79mi |
| 920 E 4th St Casa Grande, AZ | 3.0 | 2.0 | 1073 | $1,295 | $1.21 | 4d | 1 | 0.92mi |
| 1437 E 12th St Casa Grande, AZ | 3.0 | 2.5 | 1963 | $1,900 | $0.97 | 24d | 1 | 0.98mi |
| 1256 E Jahns Dr Casa Grande, AZ | 4.0 | 3.0 | 2094 | $2,199 | $1.05 | 5d | 1 | 1.00mi |
| 1467 E 12th St Casa Grande, AZ | 3.0 | 2.0 | 1604 | $1,725 | $1.08 | 24d | 1 | 1.03mi |
| 1846 N Princeton Ave Casa Grande, AZ | 4.0 | 2.0 | 1786 | $1,750 | $0.98 | 4d | 1 | 1.05mi |
| 1926 N Avenida de Palmas Casa Grande, AZ | 2.0 | 2.0 | 1106 | $1,199 | $1.08 | 22d | 3 | 1.10mi |
| 801 E 2nd St Casa Grande, AZ | 3.0 | 2.0 | 1200 | $1,650 | $1.38 | 24d | 1 | 1.12mi |
| 1858 N Center Ave Casa Grande, AZ | 2.0 | 2.0 | 1146 | $1,500 | $1.31 | 24d | 1 | 1.16mi |
| 1715 N Peart Rd Casa Grande, AZ | 2.0–4.0 | 1.0–2.0 | 1221 | $1,710 | $1.40 | 2d | 22 | 1.16mi |
| 541 W Melrose Dr Casa Grande, AZ | 3.0 | 2.0 | 1101 | $1,600 | $1.45 | 24d | 1 | 1.19mi |
| 1936 N Trekell Rd Casa Grande, AZ | 1.0–4.0 | 1.0–2.0 | 1033 | $1,723 | $1.67 | 2d | 29 | 1.19mi |
| 1013 E Doan St Casa Grande, AZ | 4.0 | 2.0 | 1120 | $1,700 | $1.52 | 24d | 1 | 1.22mi |
| 1979 N Vista Ln Casa Grande, AZ | 4.0 | 2.0 | 1636 | $2,200 | $1.34 | 24d | 1 | 1.26mi |
| 344 N Pottebaum Rd Casa Grande, AZ | 2.0–3.0 | 2.0 | 1162 | $1,494 | $1.29 | 1d | 4 | 1.30mi |
| 1265 E Kingman St Casa Grande, AZ | 4.0 | 2.0 | 1874 | $2,099 | $1.12 | 5d | 1 | 1.32mi |
| 1584 N Wood St Casa Grande, AZ | 4.0 | 2.0 | 1928 | $1,800 | $0.93 | 15d | 1 | 1.34mi |
| 75 S Trekell Rd Casa Grande, AZ | 2.0–3.0 | 2.0 | 1035 | $1,750 | $1.69 | 1d | 18 | 1.38mi |
| 1565 N Wildflower Dr Casa Grande, AZ | 1.0–3.0 | 1.0–2.0 | 998 | $1,550 | $1.55 | 1d | 9 | 1.39mi |
| 351 N Peart Rd Casa Grande, AZ | 1.0–3.0 | 1.0–2.0 | 962 | $1,687 | $1.75 | 1d | 12 | 1.41mi |
Listing history 19 events
-
2026-06-18days on market $179,000 Active 28 DOM
-
2026-06-17days on market $179,000 Active 27 DOM
-
2026-06-16days on market $179,000 Active 26 DOM
-
2026-06-15days on market $179,000 Active 25 DOM
-
2026-06-13days on market $179,000 Active 23 DOM
-
2026-06-13days on market $179,000 Active 22 DOM
-
2026-06-09days on market $179,000 Active 19 DOM
-
2026-06-08days on market $179,000 Active 18 DOM
-
2026-06-07days on market $179,000 Active 17 DOM
-
2026-06-04days on market $179,000 Active 14 DOM
-
2026-06-03days on market $179,000 Active 13 DOM
-
2026-06-02days on market $179,000 Active 12 DOM
-
2026-06-01days on market $179,000 Active 11 DOM
-
2026-05-31days on market $179,000 Active 10 DOM
-
2026-05-21$179,000 Active
-
2007-08-01historical
-
2007-02-23$149,900
-
1998-09-04soldstatus $70,500
-
1978-07-18soldstatus $36,315
ⓘ Source: listings_history table (triggers on properties + properties_extension) + one-shot
backfill from property_details.listing_events for pre-trigger history.
Tax reassessment forecast AZ · Resets to sale price
- Current annual tax
- $860 · $72/mo
- Projected year-2 tax
- $1,181 · $98/mo
- Expected delta
- +$321/yr (+$27/mo · 37.3%)
ⓘ Screening estimate from a state-policy table — verify with the county assessor before closing.
Climate risk First Street
- Flood 1/10 Low FEMA zone X (unshaded) · 0% chance over 30 yrs
- Wildfire 6/10 Major
- Heat 9/10 Extreme 7 d/yr ≥113°F today · 19 d/yr by 30 yrs out
- Wind 1/10 Low
- Air quality 1/10 Low 0 unhealthy d/yr today · 0 by 30 yrs out
Nearby sold comps map
Loading sold comps map…
Walkable amenities ~0.75 mi
Loading nearby amenities…
Taxation est. · year 1
- Rental income
- $24,843
- − Mortgage interest
- −$10,027
- − Property taxes
- −$860
- − Insurance
- −$895
- − Repairs & maintenance
- −$1,987
- − Management
- −$1,987
- − Depreciation
- −$5,207
- Taxable income
- $3,879
- Est. tax owed @ 24.0%
- −$931
- After-tax cash flow
- $5,675/yr
For passive investors: Depreciation is non-cash, so a rental often shows a tax loss while cash-flowing — sheltering income. Rental losses are passive: they offset passive income freely, and up to $25,000/yr can offset ordinary (W-2) income if you actively participate and your MAGI is under $100k (phasing out to $0 by $150k); unused losses carry forward. On sale, claimed depreciation is recaptured at up to 25%, and gains may owe capital-gains tax (a 1031 exchange can defer both). Figures are a year-1 estimate at your 24.0% rate — not tax advice; consult a CPA.
Schools (NCES district)
- District
- Casa Grande Union High School District (4453)
- NCES district ID
- 0401740
- Math proficiency
- 14% ▼ -15.00%
- Reading proficiency
- 21% ▼ -10.00%
- Median HH income
- $45,373
- Composite
- 15.38/100
- National rank
- #9319
- State rank
- #193 of 249 in AZ
Livability — Casa Grande
- Score
- 58/100
- State rank
- #220
- US rank
- #21534
Category grades
Schools grade is shown separately in the Schools card above.
Census & demographics
- Census place
- Casa Grande, AZ
- County
- Pinal County · 399,947 people
- City population
- 69,701
- Metro
- Phoenix-Mesa-Chandler, AZ
- Population (ZIP)
- 61,624
- Household income
- $68,443
- Rent vs Own
- Severe rent burden
- 1250.0
Population outlook (Pinal County) Hauer SSP2
- Today (2025)
- 437,574 people
- By 2030
- 446,903 · +2.1%
- By 2040
- 452,589 · +3.4%
- By 2050
- 444,126 · +1.5%
- By 2075
- 430,300 · -1.7%
- By 2100
- 393,536 · -10.1%
Race, ethnicity, and origin ACS 2023
- Neighborhood character
- Diverse neighborhood (Simpson 0.63)
- Race & ethnicity
- Hispanic / Latino 44% White 42% Two or more races 21% Black 4% Native American 4% Asian 1%
- Hispanic origin (detail)
- Mexican 40%
- Common ancestry
- Lithuanian 1% Slovak 1% Portuguese 1%
- Foreign-born
- 12% · Canada
- Languages at home
- 75% English-only · Spanish 23% Tagalog/Filipino 1% Other Indo-European 1%
Political lean MEDSL · Pinal
- 2024 margin
- Strong R (+22.1) · D 38.5% · R 60.6%
- 2008→2024 swing
- -7.6pp toward R · 2008: -14.5pp · 2024: -22.1pp
- All cycles
- 2024: R+22.1 2020: R+17.3 2016: R+19.3 2012: R+17.1 2008: R+14.5
Not yet ingested
- Civics
- —
Market trends
- HPI YoY
- ▼ -67.32%
- Current HPI
- 233.148
- Rent YoY
- ▲ 4.60%
- Metro
- Phoenix-Mesa-Chandler, AZ
- State GDP YoY
- ▲ 4.54%
- F500 in state
- 20
Industry mix (Fortune 500 HQ in AZ)
| Industry | F500 HQs | Revenue |
|---|---|---|
| Technology | 2 | $13B |
|
||
| Mining / Metals | 1 | $23B |
|
||
| Environmental Services | 1 | $16B |
|
||
| Metals / Steel | 1 | $14B |
|
||
| Technology Distribution | 1 | $9B |
|
||
| Homebuilding | 1 | $8B |
|
||
Price history
+392.9% since first listed5 events — show timeline
- 2026-05-21 Listed $179,000 ARMLS
- 2007-08-01 Listing Removed — ARMLS
- 2007-02-23 Listed $149,900 ARMLS
- 1998-09-04 Sold (Public Records) $70,500 Public Records
- 1978-07-18 Sold (Public Records) $36,315 Public Records
Property tax history
-1.0%/yrLatest (2025): $860 · +6.7% YoY. Source: county tax records.
Cash-flow waterfall
monthlySold comps — $/sqft
last 12 mo · ≤1 miLoading sold comps…