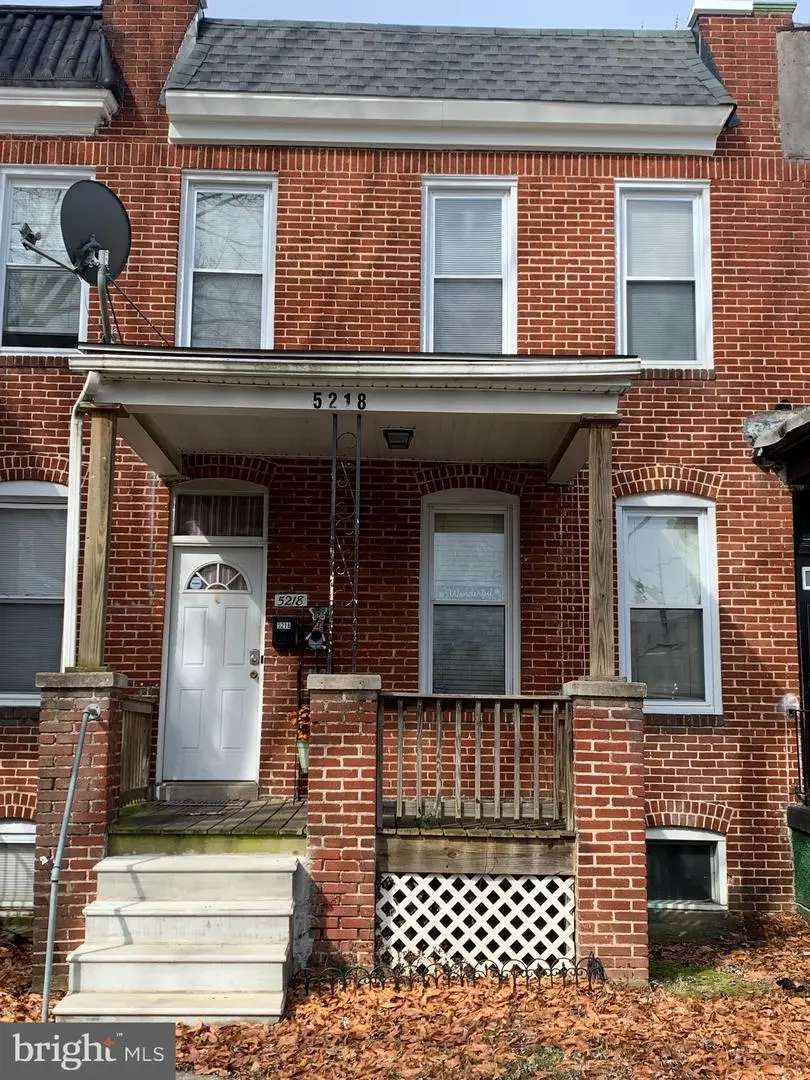
5218 Ivanhoe Ave · Baltimore, MD
Flood risk 1/10 · Minimal
- FEMA flood zone
- X (unshaded)
- Chance of flooding over 30 yrs
- 0.0%
- Est. flood insurance / yr
- $473 – $860
Fire risk 1/10 · Minimal
- Est. fire insurance / yr
- $755 – $1,403
Heat risk 6/10 · Moderate
- Hot days now (above 103°F)
- 7 days/yr
- Hot days in 30 yrs
- 14 days/yr
Wind risk 6/10 · Moderate
- Chance of severe wind over 30 yrs
- 27.0%
Air-quality risk 4/10 · Minor
- Unhealthy air days now
- 3 days/yr
- Unhealthy air days in 30 yrs
- 6 days/yr
Risk factors via First Street. Map © Google.
Why this score? — see what drove the C grade
The composite is a weighted blend of 9 inputs, each scored 0–100. Each bar is that input's sub-score; the figure is the points it added to the 100-point composite (weight × sub-score).
- Cash flow +24.0/30.0
- ARV discount +8.0/15.0
- DSCR +7.7/10.0
- 1% rule +5.5/10.0
- Livability +3.8/5.0
- Rent growth +3.7/5.0
- Condition / age +2.5/5.0
- Schools +1.0/10.0
- Appreciation +0.0/10.0
$169,900
🖨 Deal sheet 📄 Offer letter ✓ Due diligence
Listing remarks
Attention First Time Home buyers. .. .. Welcome to this BEAUTIFUL 3 bedroom 2 full bath home. Conveniently located with easy access to all things Baltimore! Move In ready, freshly painted, ceiling fans and original hardwood floors throughout. The kitchen has a balcony with a view of the open grassy public area and children's playground . The upper level includes three bedrooms and a full bath. The unfinished lower level has another full bathroom and has a ground level exit to the rear fenced yard. The basement can be finished out for additional living/entertaining space. Don't miss this one. It won't last.
Key facts
- Rear fenced yard
- Balcony with a view
- Built 1924
Tags
Property features AI
Finance
- Other: Total below-grade area: 540 (unfinished); Above-grade finished area source: Assessor; Below-grade unfinished area source: Assessor; Year built source: Assessor
Exterior
- Parking: On-street parking; Other parking
- Utilities: Public water; Public sewer; Natural gas hot water
- Home design: Interior townhouse/rowhouse; Fee simple ownership
- Construction: Brick construction; Block foundation; Double-hung and double-pane replacement windows; Skylights
- Exterior features: Not in a federal flood zone; Above grade and below grade structures
Interior
- Kitchen: Built-in microwave; Electric oven/range
- Bedrooms: 3 bedrooms on the first upper level
- Flooring: Wood floors
- Bathrooms: 2 full bathrooms (1 on upper level, 1 on lower level)
- Heating & cooling: Radiator heating (natural gas); Ceiling fans for cooling (electric)
- Interior features: Ceiling fans; Dining area; Traditional floor plan; Skylights; Wood floors
Neighborhood map
What this means for you Summary
Snapshot
- This is a 3-bed/2.0-bath townhouse listed at $170k.
Deal economics
- At list price, monthly cash flow is $333 ($4k/yr) — positive.
- The deal already cash-flows at list — no discount required.
- Meets the 1% rule at list price ($2k rent vs $170k).
- Recommended offer: $165k (3.0% below list) — sets the bar for market timing.
- Cap rate 8.6% vs local median 6.0% in Baltimore — top-decile yield for the area; either an underpriced asset or a hidden risk that comps aren't pricing in. Stress-test before assuming the spread holds.
Location & tenants
- Location reads 76/100 on livability (#90 in MD, #3,396 nationally) — a middle-class / working-renter tenant base. Strengths: amenities A+, commute A+, housing A+; Watch: schools D, crime F.
- Baltimore City Public Schools (urban): math 7% / reading 16% proficiency, ranked #24 of 24 in MD (top 100%) — low school quality limits family demand, transient renter base, plan for 1-2y turnover; 79% free/reduced lunch — lower-income household profile, screen leases tightly.
- Market conditions: Rents rising fast (+4.7%/yr); 133 active listings in the ZIP; 40 comparable units currently listed for rent nearby; rentals at typical pace (median 24d on market — plan ~3-4 weeks tenant-placement turnaround); 42% of comp listings sitting > 30 days — soft ceiling on asking rent; solid renter incomes; 1,273 units permitted in Baltimore city in 2024 (1,104 in 5+ unit buildings).
Forward outlook
- Local home prices are declining (-3.0%/yr); year-one equity from $1k of loan paydown is wiped out by about $5k of value loss. Plan a longer hold.
- Baltimore County population projected to shrink 4% by 2050 — rents likely to lag national; underwrite the cash flow, not the appreciation.
- At projected returns (-3.0% appreciation + 4.7% rent growth), your $48k cash investment doubles in ~10 years — after that, you're playing with house money.
Negotiation context
- It's been on market 48 days — a 3% lower offer ($165k) is reasonable based on typical stale-listing flexibility.
- 6 sale attempts since 25y ago; this cycle's ask has dropped $20k (11%) from the opening price — seller is motivated, your offer sets the floor, not the list.
- Current owner paid $10k; list at $170k implies a 1688% gain — meaningful room to come down on a strong offer.
Risks & watch-outs
- Watch-outs: built in 1924 — expect roof / HVAC / electrical / plumbing capex.
- Climate carrying-cost: major wind risk, 27% chance of damaging wind over 30y; extreme-heat days projected 7→14/yr by 2055 (HVAC capex compounding) — expect insurance premiums to compound above CPI over the hold.
Questions for the listing agent
- It's been on market 48 days. Have you received any prior offers? Is the seller open to a 3% concession, seller financing, or rate buy-down credit?
- Built in 1924 — when were the roof, HVAC, electrical panel, plumbing, and water heater last replaced?
- Is there a deadline driving the sale (1031 exchange, divorce, estate, relocation)? That informs how much negotiation room exists.
- Schools are D-rated, which usually means shorter tenancies and higher turnover. Who's the typical renter profile here, and what's been the actual vacancy rate?
- Crime grade is F in this area — have there been break-ins, vandalism, or insurance claims at this property in the last 3 years? What carrier currently insures it and at what premium?
- What's the average days-on-market for RENTAL listings here right now (not sales)? A rising rental-DOM trend means longer vacancies and softer asking-rent achievability than the comps imply.
- What's the recent tenant-quality profile in this submarket — average credit score on applications, eviction rate, late-payment / NSF rate, and stable-employment percentage? A property-management company in the area should have these aggregated.
- How much new for-sale + rental construction is in the pipeline within 1–3 miles? Heavy new supply typically softens prices + rents 12–24 months out; constrained supply supports both.
Investment metrics
- 1% rule
- 1.05% ✓
- Cap rate
- 8.65%
- Cash-on-cash
- 8.40%
- DSCR
- 1.37
- GRM
- 8.0
CMA / ARV
- ARV (median comp)
- $171,882
- List price
- $169,900
- Delta
- -1.15%
- Verdict
- FAIR
- Comps
- 20 within 1.0 mi
Show comp detail 12 sales within ~0.75 mi
| Address | Dist | Beds/Ba | Sqft | Sold | Price | $/sf | Match |
|---|---|---|---|---|---|---|---|
| 812 Mccabe Ave | 0.06mi | 3/1.0 | 1,080 (0%) | 1mo | $150,000 | $139 | 92 |
| 1018 Cameron Rd | 0.38mi | 2/2.0 (-1) | 1,032 (-4%) | 1mo | $169,000 | $164 | 69 |
| 4811 Kimberleigh Rd | 0.40mi | 3/1.5 | 1,024 (-5%) | 4mo | $240,000 | $234 | 67 |
| 355 Homeland Southway Unit 2B | 0.45mi | 2/1.5 (-1) | 1,043 (-3%) | 0mo | $205,000 | $197 | 66 |
| 380 Homeland Southway Unit 3A | 0.51mi | 2/2.0 (-1) | 1,066 (-1%) | 3mo | $225,000 | $211 | 66 |
| 365 Homeland Southway Unit 2B | 0.52mi | 2/2.0 (-1) | 1,061 (-2%) | 4mo | $240,000 | $226 | 64 |
| 5627 Ready Ave | 0.43mi | 3/2.0 | 1,186 (+10%) | 3mo | $95,400 | $80 | 61 |
| 327 Homeland Southway Unit 3B | 0.58mi | 2/2.0 (-1) | 1,055 (-2%) | 4mo | $199,990 | $190 | 60 |
| 800 Radnor Ave | 0.38mi | 3/1.5 | 1,224 (+13%) | 2mo | $99,900 | $82 | 56 |
| 634 Willow Ave | 0.60mi | 2/1.0 (-1) | 986 (-9%) | 4mo | $90,000 | $91 | 45 |
| 1312 E Cold Spring Ln | 0.73mi | 3/1.0 | 1,216 (+13%) | 1mo | $147,000 | $121 | 40 |
| 1324 Crofton Rd | 0.69mi | 3/1.5 | 1,240 (+15%) | 4mo | $235,000 | $190 | 38 |
Match score weights: distance 35% · size 25% · config 20% · recency 20%. Top-matched comps best support the ARV.
Projected returns pro-forma
-3.0% appreciation · 4.65% rent growth · sell at horizon
- IRR
- -1.8%
- Equity multiple
- 0.93×
- Total profit
- $-3,348
- Equity at exit
- $25,333
- IRR
- 9.4%
- Equity multiple
- 1.78×
- Total profit
- $36,995
- Equity at exit
- $14,690
Cash invested: $47,572 (down + closing). Projections, not guarantees.
Landlord ↔ Tenant lean methodology
- Overall (CITY)
- 12 Strongly Tenant-Friendly
- State Maryland
- 27 Tenant-Leaning · D+14
- County
- — inherits STATE
- City Baltimore
- 12 Strongly Tenant-Friendly · D+58
ZIP-level market 21212
- Rents YoY
- 4.7%
- Active inventory
- 133
- Price-to-rent
- 8.0×
Monthly cashflow live
- Estimated rent
- $1,778 high interval (Pro) →
- Mortgage (P&I)
- −$891
- Tax from tax record
- −$110 /mo · $1,319/yr
- Insurance
- −$71
- HOA
- −$0
- Vacancy / Maint / Mgmt
- −$373
- Net cashflow
- $333
Break-even live
UW: 25.0% down · 7.5% · 30yr · 1.5% tax · 5.0% vac · 8.0% maint · 8.0% mgmt
Financing live
Cash to close
- Down payment
- $42,475
- Closing costs
- $5,097
- Reserves months
- —
- Total cash needed
- —
Loan-product check · same deal, 3 products live
Conventional
25% down · 7.5% · 30yr
- Down + closing
- —
- Monthly P&I
- —
- Monthly cashflow
- —
- DSCR
- —
- Eligible?
- —
Personal DTI + credit; lowest rate.
DSCR
20% down · 8.5% · 30yr
- Down + closing
- —
- Monthly P&I
- —
- Monthly cashflow
- —
- DSCR
- —
- Eligible?
- —
No personal income docs; deal must DSCR.
Hard money
10% down · 12.0% · 12mo
- Down + closing
- —
- Monthly P&I
- —
- Monthly cashflow
- —
- DSCR
- —
- Eligible?
- —
Short-term bridge; refi at stabilization.
Rent comps 40 comps
| Address | Beds | Baths | Sqft | Rent | $/sqft | DOM | Units | Dist |
|---|---|---|---|---|---|---|---|---|
| 711 1/2 McCabe Ave Baltimore, MD | 4.0 | 3.0 | 1204 | $2,350 | $1.95 | 4d | 1 | 0.10mi |
| 5200 Ready Ave Baltimore, MD | 3.0 | 1.5 | 1116 | $1,950 | $1.75 | 3d | 1 | 0.17mi |
| 543 Chateau Ave Baltimore, MD | 3.0 | 2.0 | 1152 | $1,900 | $1.65 | 4d | 1 | 0.23mi |
| 5307 York Rd Baltimore, MD | 2.0 | 1.0 | 1120 | $1,200 | $1.07 | 43d | 1 | 0.26mi |
| 5001 Midwood Ave Apt 2A Baltimore, MD | 2.0 | 1.0 | 750 | $1,265 | $1.69 | 43d | 1 | 0.32mi |
| 1006 Cameron Rd Baltimore, MD | 2.0 | 1.0 | 1032 | $950 | $0.92 | 43d | 1 | 0.36mi |
| 1221 Glenwood Ave Baltimore, MD | 3.0 | 2.0 | 1390 | $2,595 | $1.87 | 43d | 1 | 0.40mi |
| 416 Winston Ave Unit 426-01 Baltimore, MD | 2.0 | 1.0 | 890 | $1,250 | $1.40 | 43d | 1 | 0.41mi |
| 416 Winston Ave Unit 426-08 Baltimore, MD | 2.0 | 1.0 | 790 | $1,050 | $1.33 | 23d | 1 | 0.41mi |
| 5618 Midwood Ave Unit 1 Baltimore, MD | 2.0 | 1.0 | 800 | $1,250 | $1.56 | 23d | 1 | 0.41mi |
| 5622 Midwood Ave Baltimore, MD | 3.0 | 2.0 | 1452 | $2,300 | $1.58 | 43d | 1 | 0.42mi |
| 5626 Midwood Ave Unit 2 Baltimore, MD | 2.0 | 1.0 | 1452 | $1,100 | $0.76 | 23d | 1 | 0.43mi |
| 818 Bradhurst Rd Baltimore, MD | 2.0 | 1.0 | 1216 | $1,250 | $1.03 | 43d | 1 | 0.43mi |
| 818 Bradhurst Rd Baltimore, MD | 2.0 | 1.0 | 1216 | $1,350 | $1.11 | 3d | 1 | 0.43mi |
| 1224 Winston Ave Baltimore, MD | 3.0 | 2.0 | 1248 | $2,100 | $1.68 | 17d | 1 | 0.46mi |
| 1275 Kitmore Rd Unit 1276B-A Baltimore, MD | 2.0 | 1.0 | 812 | $1,360 | $1.67 | 43d | 1 | 0.48mi |
| 1275 Kitmore Rd Unit 1248B-A Baltimore, MD | 2.0 | 1.0 | 812 | $1,360 | $1.67 | 4d | 1 | 0.48mi |
| 1275 Kitmore Rd Unit 1262B-A Baltimore, MD | 2.0 | 1.0 | 923 | $1,320 | $1.43 | 2d | 1 | 0.48mi |
| 1275 Kitmore Rd Unit 1260K-T Baltimore, MD | 2.0 | 1.0 | 811 | $1,410 | $1.74 | 4d | 1 | 0.48mi |
| 1275 Kitmore Rd Unit 1245K-T Baltimore, MD | 3.0 | 1.0 | 935 | $1,895 | $2.03 | 4d | 1 | 0.48mi |
| 1275 Kitmore Rd Unit 1215B-T Baltimore, MD | 2.0 | 1.0 | 811 | $1,435 | $1.77 | 4d | 1 | 0.48mi |
| 1275 Kitmore Rd Unit 1263K-T Baltimore, MD | 2.0 | 1.0 | 811 | $1,485 | $1.83 | 4d | 1 | 0.48mi |
| 1275 Kitmore Rd Unit 1259K-T Baltimore, MD | 2.0 | 1.0 | 811 | $1,535 | $1.89 | 4d | 1 | 0.48mi |
| 1275 Kitmore Rd Unit 1221B-T Baltimore, MD | 2.0 | 1.0 | 811 | $1,560 | $1.92 | 23d | 1 | 0.48mi |
| 1275 Kitmore Rd Unit 1267K-T Baltimore, MD | 2.0 | 1.0 | 827 | $1,585 | $1.92 | 43d | 1 | 0.48mi |
| 1275 Kitmore Rd Baltimore, MD | 2.0 | 1.0 | 827 | $1,525 | $1.84 | 43d | 1 | 0.48mi |
| 1090 Cameron Rd Baltimore, MD | 2.0 | 1.0 | 832 | $1,675 | $2.01 | 3d | 1 | 0.48mi |
| 1260 Rossiter Ave Baltimore, MD | 2.0 | 1.0 | 710 | $1,250 | $1.76 | 1d | 37 | 0.52mi |
| 835 E Cold Spring Ln Baltimore, MD | 2.0 | 1.5 | 997 | $1,400 | $1.40 | 23d | 1 | 0.53mi |
| 531 Willow Ave Unit Na Baltimore, MD | 4.0 | 1.0 | 1300 | $1,800 | $1.38 | 20d | 1 | 0.60mi |
| 4407 Old York Rd Baltimore, MD | 3.0 | 1.5 | 1356 | $1,574 | $1.16 | 20d | 1 | 0.65mi |
| 4407 Old York Rd Baltimore, MD | 3.0 | 1.5 | 1356 | $1,574 | $1.16 | 43d | 1 | 0.65mi |
| 917 Reverdy Rd Unit A Baltimore, MD | 3.0 | 1.0 | 1200 | $2,100 | $1.75 | 43d | 1 | 0.70mi |
| 5307 Leith Rd Baltimore, MD | 2.0 | 1.0 | 630 | $1,350 | $2.14 | 12d | 1 | 0.77mi |
| 720 Springfield Ave Baltimore, MD | 3.0 | 1.0 | 1160 | $2,000 | $1.72 | 43d | 1 | 0.79mi |
| 815 Gilrubin Ct Baltimore, MD | 2.0 | 1.0 | 900 | $1,695 | $1.88 | 43d | 1 | 0.80mi |
| 812 Nat Ct Apt 12 Baltimore, MD | 2.0 | 1.0 | 900 | $1,295 | $1.44 | 43d | 1 | 0.80mi |
| 1111 Gleneagle Rd Unit 2 Baltimore, MD | 2.0 | 1.0 | 1452 | $1,050 | $0.72 | 43d | 1 | 0.89mi |
| 5664 Woodmont Ave Baltimore, MD | 1.0–2.0 | 1.0 | 710 | $1,175 | $1.65 | 3d | 10 | 0.90mi |
| 1106 Gleneagle Rd Unit 2 Baltimore, MD | 2.0 | 1.0 | 1100 | $1,450 | $1.32 | 43d | 1 | 0.90mi |
Listing history 34 events
-
2026-06-18days on market $169,900 Active 48 DOM
-
2026-06-17days on market $169,900 Active 47 DOM
-
2026-06-16days on market $169,900 Active 46 DOM
-
2026-06-15days on market $169,900 Active 45 DOM
-
2026-06-13days on market $169,900 Active 43 DOM
-
2026-06-09days on market $169,900 Active 39 DOM
-
2026-06-08days on market $169,900 Active 38 DOM
-
2026-06-07days on market $169,900 Active 37 DOM
-
2026-06-04days on market $169,900 Active 34 DOM
-
2026-06-03days on market $169,900 Active 33 DOM
-
2026-06-02days on market $169,900 Active 32 DOM
-
2026-06-01days on market $169,900 Active 31 DOM
-
2026-05-31days on market $169,900 Active 30 DOM
-
2026-05-09price $1,800
-
2026-05-08price $179,900 614-char remark
-
2026-05-01$189,900 Active 614-char remark
-
2026-04-29price $1,900
-
2026-03-25price $1,800
-
2026-01-22price $2,200
-
2025-11-19price $1,850
-
2025-11-16$1,500
-
2019-02-15historical
-
2019-01-15price $97,000
-
2018-12-11$104,900 Active
-
2018-07-09historical
-
2018-07-09historical Temporarily Off-Market
-
2018-05-23price $99,000
-
2018-05-23price
-
2018-04-11$107,800 Active
-
2018-04-11Active
-
2001-08-31soldstatus $9,500
-
2001-07-03historical
-
2001-03-22$9,900
-
2000-03-20soldstatus $45,000
ⓘ Source: listings_history table (triggers on properties + properties_extension) + one-shot
backfill from property_details.listing_events for pre-trigger history.
Tax reassessment forecast MD · Partial reset (capped growth)
- Current annual tax
- $1,319 · $110/mo
- Projected year-2 tax
- $1,586 · $132/mo
- Expected delta
- +$266/yr (+$22/mo · 20.2%)
ⓘ Screening estimate from a state-policy table — verify with the county assessor before closing.
Climate risk First Street
- Flood 1/10 Low FEMA zone X (unshaded) · 0% chance over 30 yrs
- Wildfire 1/10 Low
- Heat 6/10 Major 7 d/yr ≥103°F today · 14 d/yr by 30 yrs out
- Wind 6/10 Major 27% chance of damaging wind over 30 yrs
- Air quality 4/10 Moderate 3 unhealthy d/yr today · 6 by 30 yrs out
Nearby sold comps map
Loading sold comps map…
Walkable amenities ~0.75 mi
Loading nearby amenities…
Taxation est. · year 1
- Rental income
- $21,339
- − Mortgage interest
- −$9,517
- − Property taxes
- −$1,319
- − Insurance
- −$850
- − Repairs & maintenance
- −$1,707
- − Management
- −$1,707
- − Depreciation
- −$4,943
- Taxable income
- $1,297
- Est. tax owed @ 24.0%
- −$311
- After-tax cash flow
- $3,687/yr
For passive investors: Depreciation is non-cash, so a rental often shows a tax loss while cash-flowing — sheltering income. Rental losses are passive: they offset passive income freely, and up to $25,000/yr can offset ordinary (W-2) income if you actively participate and your MAGI is under $100k (phasing out to $0 by $150k); unused losses carry forward. On sale, claimed depreciation is recaptured at up to 25%, and gains may owe capital-gains tax (a 1031 exchange can defer both). Figures are a year-1 estimate at your 24.0% rate — not tax advice; consult a CPA.
Schools (NCES district)
- District
- Baltimore City Public Schools
- NCES district ID
- 2400090
- Math proficiency
- 7% ▼ -9.00%
- Reading proficiency
- 16% ▼ -5.00%
- Median HH income
- $42,108
- Composite
- 10.08/100
- National rank
- #9805
- State rank
- #24 of 24 in MD
Livability — Baltimore
- Score
- 76/100
- State rank
- #90
- US rank
- #3396
Category grades
Schools grade is shown separately in the Schools card above.
Census & demographics
- Census place
- Baltimore, MD
- County
- Baltimore City · 558,601 people
- City population
- 588,727
- Metro
- Baltimore-Columbia-Towson, MD
- Population (ZIP)
- 33,974
- Household income
- $96,685
- Rent vs Own
- Severe rent burden
- 769.0
Population outlook (Baltimore County) Hauer SSP2
- Today (2025)
- 624,249 people
- By 2030
- 621,541 · -0.4%
- By 2040
- 609,756 · -2.3%
- By 2050
- 597,249 · -4.3%
- By 2075
- 552,236 · -11.5%
- By 2100
- 513,934 · -17.7%
Race, ethnicity, and origin ACS 2023
- Neighborhood character
- Diverse neighborhood (Simpson 0.64)
- Race & ethnicity
- White 49% Black 35% Two or more races 9% Hispanic / Latino 7% Asian 4%
- Hispanic origin (detail)
- Mexican 1% Puerto Rican 1%
- Common ancestry
- Romanian 3% Italian 2% Slovak 2%
- Foreign-born
- 9% · Canada, China
- Languages at home
- 87% English-only · Spanish 5% Other Indo-European 2% French/Haitian/Cajun 1%
Political lean MEDSL · Baltimore
- 2024 margin
- Solid D (+73.0) · D 85.2% · R 12.2% · Other 2.6%
- 2008→2024 swing
- -2.5pp toward R · 2008: 75.5pp · 2024: 73.0pp
- All cycles
- 2024: D+73.0 2020: D+76.6 2016: D+74.6 2012: D+76.4 2008: D+75.5
Not yet ingested
- Civics
- —
Market trends
- HPI YoY
- ▼ -392.44%
- Current HPI
- 267.4569
- Rent YoY
- ▲ 4.65%
- Metro
- Baltimore-Columbia-Towson, MD
- State GDP YoY
- ▲ 2.97%
- F500 in state
- 12
Industry mix (Fortune 500 HQ in MD)
| Industry | F500 HQs | Revenue |
|---|---|---|
| Aerospace / Defense | 1 | $71B |
|
||
| Utilities | 1 | $25B |
|
||
| Hotels | 1 | $24B |
|
||
| Consumer Goods | 1 | $7B |
|
||
| Real Estate | 1 | $6B |
|
||
| Chemicals | 1 | $2B |
|
||
Price history
-96.2% since first listed23 events — show timeline
- 2026-05-28 Price Changed $1,700 BRIGHTMLS
- 2026-05-28 Price Changed $169,900 BRIGHT MLS
- 2026-05-09 Price Changed $1,800 BRIGHTMLS
- 2026-05-08 Price Changed $179,900 BRIGHT MLS
- 2026-05-01 Listed $189,900 BRIGHT MLS
- 2026-04-29 Price Changed $1,900 BRIGHTMLS
- 2026-03-25 Price Changed $1,800 BRIGHTMLS
- 2026-01-22 Price Changed $2,200 BRIGHTMLS
- 2025-11-19 Price Changed $1,850 BRIGHTMLS
- 2025-11-16 Listed for Rent $1,500 BRIGHTMLS
- 2019-02-15 Listing Removed — BRIGHT MLS
- 2019-01-15 Price Changed $97,000 BRIGHT MLS
- 2018-12-11 Listed $104,900 BRIGHT MLS
- 2018-07-09 Delisted — MRIS
- 2018-07-09 Listing Removed — BRIGHT MLS
- 2018-05-23 Price Changed $99,000 BRIGHT MLS
- 2018-05-23 Price Changed — MRIS
- 2018-04-11 Listed — MRIS
- 2018-04-11 Listed $107,800 BRIGHT MLS
- 2001-08-31 Sold (MLS) $9,500 MRIS
- 2001-07-03 Delisted — MRIS
- 2001-03-22 Listed $9,900 MRIS
- 2000-03-20 Sold (Public Records) $45,000 Public Records
Property tax history
-2.2%/yrLatest (2025): $1,319 · +12.1% YoY. Source: county tax records.
Cash-flow waterfall
monthlySold comps — $/sqft
last 12 mo · ≤1 miLoading sold comps…