97046 Katfish · Yulee, FL
Flood risk 7/10 · Major
- FEMA flood zone
- X (shaded)
- Chance of flooding over 30 yrs
- 0.76%
- Est. flood insurance / yr
- $507 – $1,088
Fire risk 4/10 · Minor
- Est. fire insurance / yr
- $947 – $1,759
Heat risk 9/10 · Severe
- Hot days now (above 106°F)
- 7 days/yr
- Hot days in 30 yrs
- 20 days/yr
Wind risk 9/10 · Severe
- Chance of severe wind over 30 yrs
- 99.0%
Air-quality risk 4/10 · Minor
- Unhealthy air days now
- 5 days/yr
- Unhealthy air days in 30 yrs
- 5 days/yr
Risk factors via First Street. Map © Google.
Why this score? — see what drove the C+ grade
The composite is a weighted blend of 9 inputs, each scored 0–100. Each bar is that input's sub-score; the figure is the points it added to the 100-point composite (weight × sub-score).
- ARV discount +15.0/15.0
- Cash flow +12.1/30.0
- Appreciation +10.0/10.0
- Schools +6.0/10.0
- 1% rule +4.6/10.0
- DSCR +3.6/10.0
- Livability +3.3/5.0
- Rent growth +3.2/5.0
- Condition / age +2.5/5.0
$256,000
🖨 Deal sheet (PDF) 📄 Offer letter ✓ Due diligence
Listing remarks MLS
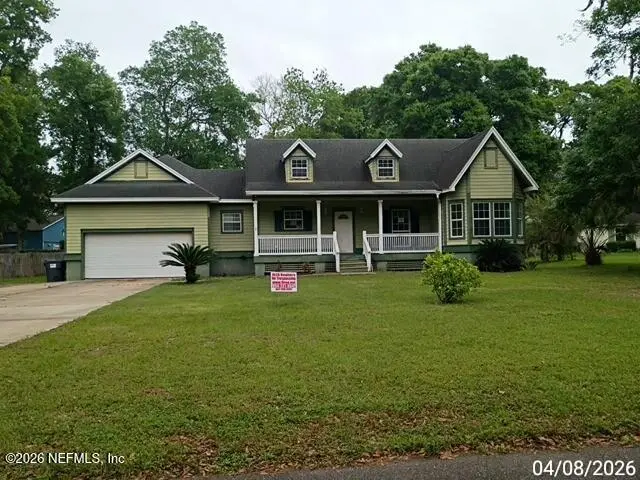
Welcome to your dream home in Pirates Wood! This delightful 3-bed, 2.5-bath home offers 2,050 square feet of comfort and elegance. Built in 2005 on a generous 0.52-acre lot, relish cozy living with hardwood floors, a kitchen peninsula, and fairly recently updated roof and HVAC (2017). Enjoy the serene neighborhood ambiance while still being conveniently located near all the amenities, including the community boat ramp, pool and clubhouse. Coastal living awaits you here! Seller would like buyers to be prequalified by a preferred lender, Summit Mortgage Corporation NMLS #1041. Contact Susan Lazcano. No obligation to use lender.
Key facts
- Large lot
- 0.52 acre lot
- 2 garage spots
Tags
Neighborhood map
What this means for you Summary
Snapshot
- This is a 3-bed/2.0-bath single-family listed at $256k.
Deal economics
- At list price, monthly cash flow is $-123 ($-1k/yr) — negative.
- To cash-flow at today's rent, offer at most $234k (8.5% below list).
- To meet the 1% rule (rent ≥ 1% of price), the offer needs to be $246k (3.9% below list).
- Recommended offer: $234k (8.5% below list) — sets the bar for cash-flow.
- Cap rate 6.0% vs local median 3.2% in Yulee — top-decile yield for the area; either an underpriced asset or a hidden risk that comps aren't pricing in. Stress-test before assuming the spread holds.
Location & tenants
- Location reads 66/100 on livability (#605 in FL) — a middle-class / working-renter tenant base. Strengths: housing A+, cost of living A-, crime B+; Watch: amenities F, commute F, health & safety F.
- Nassau (town): math 74% / reading 65% proficiency, ranked #4 of 73 in FL (top 6%) — acceptable for families but not a draw, mixed tenant base, ~2y average lease.
- Market conditions: Rents rising (+2.9%/yr); 601 active listings in the ZIP; 1 comparable units currently listed for rent nearby; solid renter incomes; 953 units permitted in Nassau County in 2024 (24 in 5+ unit buildings).
- This rent runs 32% of the median local income ($93k/yr) — at the standard rent-burdened threshold; future hikes will face affordability resistance.
Forward outlook
- In year one you build about $27k of equity ($2k loan paydown + $26k appreciation (10.0% local appreciation)).
- Nassau County population projected at +17% by 2050 — long-run rental-demand tailwind backs the buy-and-hold thesis.
- By year 2, paydown + projected appreciation supports a ~$44k cash-out refi (75% LTV) — recoverable capital for the next deal without selling this one.
Negotiation context
- Only 11 days on market — expect competitive offers; lowballing is unlikely to land.
- 4 sale attempts since 19y ago with the ask held roughly flat each time — persistent listings suggest the price (not the market) is what's stuck; bring a comps-based counter.
- Current owner paid $20k; list at $256k implies a 1180% gain — meaningful room to come down on a strong offer.
Risks & watch-outs
- Watch-outs: property tax is 2.6% of price; flood insurance adds $66/mo.
- Climate carrying-cost: major flood risk; severe wind risk, 99% chance of damaging wind over 30y; extreme-heat days projected 7→20/yr by 2055 (HVAC capex compounding) — expect insurance premiums to compound above CPI over the hold.
Questions for the listing agent
- What do current leases actually rent for vs. the listed asking? Can we see a recent rent roll and the last 12 months of T-12 income?
- Property tax is high relative to price — has the assessment been appealed recently, and will the sale trigger a re-assessment?
- What's the actual annual flood-insurance premium (NFIP or private), and is the property in a SFHA with mandatory coverage?
- Is there a deadline driving the sale (1031 exchange, divorce, estate, relocation)? That informs how much negotiation room exists.
- Schools are B-rated — typically a magnet for longer-tenancy family renters. What's the average tenant stay here, and is there a school-zone premium baked into asking?
- What's the average days-on-market for RENTAL listings here right now (not sales)? A rising rental-DOM trend means longer vacancies and softer asking-rent achievability than the comps imply.
- What's the recent tenant-quality profile in this submarket — average credit score on applications, eviction rate, late-payment / NSF rate, and stable-employment percentage? A property-management company in the area should have these aggregated.
- How much new for-sale + rental construction is in the pipeline within 1–3 miles? Heavy new supply typically softens prices + rents 12–24 months out; constrained supply supports both.
Investment metrics
- 1% rule
- 0.96% ✗
- Cap rate
- 6.03%
- Cash-on-cash
- -0.94%
- DSCR
- 0.96
- GRM
- 8.7
CMA / ARV
- ARV (on-the-fly)
- $479,700
- Comps found
- 8
Show comp detail 8 sales within ~0.75 mi
| Address | Dist | Beds/Ba | Sqft | Sold | Price | $/sf | Match |
|---|---|---|---|---|---|---|---|
| 88083 Maybourne Rd | 0.58mi | 3/2.0 | 2,016 (-2%) | 11mo | $472,000 | $234 | 61 |
| 97472 Pirates Point Rd | 0.40mi | 3/3.0 | 2,207 (+8%) | 15mo | $785,000 | $356 | 52 |
| 97295 Laffites Way | 0.43mi | 4/3.0 (+1) | 1,932 (-6%) | 12mo | $350,000 | $181 | 51 |
| 97071 Laffites Way | 0.52mi | 4/3.0 (+1) | 2,244 (+10%) | 6mo | $420,000 | $187 | 46 |
| 97125 Pirates Point Rd | 0.35mi | 3/2.5 | 2,320 (+13%) | 23mo | $535,000 | $231 | 40 |
| 97020 Landing Trl | 0.64mi | 3/3.0 | 2,240 (+9%) | 18mo | $1,205,000 | $538 | 36 |
| 88137 Maybourne Rd | 0.63mi | 4/2.0 (+1) | 2,320 (+13%) | 10mo | $580,000 | $250 | 35 |
| 96893 Blackrock Rd | 0.43mi | 4/2.0 (+1) | 2,320 (+13%) | 23mo | $452,500 | $195 | 34 |
Match score weights: distance 35% · size 25% · config 20% · recency 20%. Top-matched comps best support the ARV.
Projected returns pro-forma
10.0% appreciation · 2.88% rent growth · sell at horizon
- IRR
- 22.8%
- Equity multiple
- 2.83×
- Total profit
- $131,531
- Equity at exit
- $230,625
- IRR
- 20.4%
- Equity multiple
- 6.49×
- Total profit
- $393,321
- Equity at exit
- $497,352
Cash invested: $71,680 (down + closing). Projections, not guarantees.
Landlord ↔ Tenant lean methodology
- Overall (STATE)
- 87 Strongly Landlord-Friendly
- State Florida
- 87 Strongly Landlord-Friendly · R+3
- County
- — inherits STATE
- City
- — inherits STATE
ZIP-level market 32097
- Home prices YoY
- 19.5%
- Rents YoY
- 2.9%
- Active inventory
- 601
- Price-to-rent
- 8.7×
Monthly cashflow live
- Estimated rent
- $2,461 medium interval (Pro) →
- Mortgage (P&I)
- −$1,342
- Tax from tax record
- −$551 /mo · $6,612/yr
- Insurance
- −$107
- Flood insurance flood zone
- −$66 /mo · $798/yr
- HOA
- −$0
- Vacancy / Maint / Mgmt
- −$517
- Net cashflow
- $-123
Break-even live
Sensitivity live
| Price | -10% $22 | -5% $-50 | +0% $-123 | +5% $-195 | +10% $-268 |
|---|---|---|---|---|---|
| Rent | -10% $-317 | -5% $-220 | +0% $-123 | +5% $-26 | +10% $72 |
| Rate | -1.0pp $6 | -0.5pp $-58 | base $-123 | +0.5pp $-189 | +1.0pp $-257 |
UW: 25.0% down · 7.5% · 30yr · 1.5% tax · 5.0% vac · 8.0% maint · 8.0% mgmt
Financing live
Cash to close
- Down payment
- $64,000
- Closing costs
- $7,680
- Reserves months
- —
- Total cash needed
- —
Loan-product check · same deal, 3 products live
Conventional
25% down · 7.5% · 30yr
- Down + closing
- —
- Monthly P&I
- —
- Monthly cashflow
- —
- DSCR
- —
- Eligible?
- —
Personal DTI + credit; lowest rate.
DSCR
20% down · 8.5% · 30yr
- Down + closing
- —
- Monthly P&I
- —
- Monthly cashflow
- —
- DSCR
- —
- Eligible?
- —
No personal income docs; deal must DSCR.
Hard money
10% down · 12.0% · 12mo
- Down + closing
- —
- Monthly P&I
- —
- Monthly cashflow
- —
- DSCR
- —
- Eligible?
- —
Short-term bridge; refi at stabilization.
Rent comps 1 comps
| Address | Beds | Baths | Sqft | Rent | $/sqft | DOM | Units | Dist |
|---|---|---|---|---|---|---|---|---|
| 97122 Yorkshire Dr Yulee, FL | 4.0 | 2.0 | 2522 | $2,640 | $1.05 | 5d | 1 | 1.47mi |
Listing history 9 events
-
2026-04-25status Pending
-
2026-04-14$256,000 Active
-
2025-12-30$5,000 Active
-
2024-04-18historical 640-char remark
Show marketing remark (640 chars)
Welcome to your dream home in Pirates Wood! This delightful 3-bed, 2.5-bath home offers 2,050 square feet of comfort and elegance. Built in 2005 on a generous 0.52-acre lot, relish cozy living with hardwood floors, a kitchen peninsula, and fairly recently updated roof and HVAC (2017). Enjoy the serene neighborhood ambiance while still being conveniently located near all the amenities, including the community boat ramp, pool and clubhouse. Coastal living awaits you here! Seller would like buyers to be prequalified by a preferred lender, Summit Mortgage Corporation NMLS #1041. Contact Susan Lazcano. No obligation to use lender.
-
2024-04-02$419,000 Active 640-char remark
Show marketing remark (640 chars)
Welcome to your dream home in Pirates Wood! This delightful 3-bed, 2.5-bath home offers 2,050 square feet of comfort and elegance. Built in 2005 on a generous 0.52-acre lot, relish cozy living with hardwood floors, a kitchen peninsula, and fairly recently updated roof and HVAC (2017). Enjoy the serene neighborhood ambiance while still being conveniently located near all the amenities, including the community boat ramp, pool and clubhouse. Coastal living awaits you here! Seller would like buyers to be prequalified by a preferred lender, Summit Mortgage Corporation NMLS #1041. Contact Susan Lazcano. No obligation to use lender.
-
2007-12-15historical
-
2007-06-15$337,000
-
2004-10-08soldstatus $20,000
-
1991-07-24soldstatus $20,000
ⓘ Source: listings_history table (triggers on properties + properties_extension) + one-shot
backfill from property_details.listing_events for pre-trigger history.
Tax reassessment forecast FL · Resets to sale price
- Current annual tax
- $6,612 · $551/mo
- Projected year-2 tax
- $6,612 · $551/mo
- Expected delta
- $0/yr ($0/mo · 0.0%)
ⓘ Screening estimate from a state-policy table — verify with the county assessor before closing.
Climate risk First Street
- Flood 7/10 Severe FEMA zone X (shaded) · 76% chance over 30 yrs
- Wildfire 4/10 Moderate
- Heat 9/10 Extreme 7 d/yr ≥106°F today · 20 d/yr by 30 yrs out
- Wind 9/10 Extreme 99% chance of damaging wind over 30 yrs
- Air quality 4/10 Moderate 5 unhealthy d/yr today · 5 by 30 yrs out
Nearby sold comps map
Loading sold comps map…
Walkable amenities ~0.75 mi
Loading nearby amenities…
Taxation est. · year 1
- Rental income
- $29,527
- − Mortgage interest
- −$14,340
- − Property taxes
- −$6,612
- − Insurance
- −$2,078
- − Repairs & maintenance
- −$2,362
- − Management
- −$2,362
- − Depreciation
- −$7,447
- Taxable loss
- −$5,674
- Est. tax savings @ 24.0%
- +$1,362
- After-tax cash flow
- $-111/yr
For passive investors: Depreciation is non-cash, so a rental often shows a tax loss while cash-flowing — sheltering income. Rental losses are passive: they offset passive income freely, and up to $25,000/yr can offset ordinary (W-2) income if you actively participate and your MAGI is under $100k (phasing out to $0 by $150k); unused losses carry forward. On sale, claimed depreciation is recaptured at up to 25%, and gains may owe capital-gains tax (a 1031 exchange can defer both). Figures are a year-1 estimate at your 24.0% rate — not tax advice; consult a CPA.
Schools (NCES district)
- District
- Nassau
- NCES district ID
- 1201350
- Math proficiency
- 74% ▼ -2.00%
- Reading proficiency
- 65% ▼ -2.00%
- Median HH income
- $58,267
- Composite
- 59.79/100
- National rank
- #899
- State rank
- #4 of 73 in FL
Livability — Yulee
- Score
- 66/100
- State rank
- #605
- US rank
- #11615
Category grades
Schools grade is shown separately in the Schools card above.
Census & demographics
- Census place
- Yulee, FL
- County
- Nassau County · 67,729 people
- City population
- 26,700
- Metro
- Jacksonville, FL
- Population (ZIP)
- 26,700
- Household income
- $93,161
- Rent vs Own
- Severe rent burden
- 404.0
Population outlook (Nassau County) Hauer SSP2
- Today (2025)
- 88,419 people
- By 2030
- 92,679 · +4.8%
- By 2040
- 99,257 · +12.3%
- By 2050
- 103,378 · +16.9%
- By 2075
- 109,726 · +24.1%
- By 2100
- 107,006 · +21.0%
Race, ethnicity, and origin ACS 2023
- Neighborhood character
- Predominantly White (75%)
- Race & ethnicity
- White 75% Two or more races 9% Black 9% Hispanic / Latino 8% Asian 1% Native American 1%
- Hispanic origin (detail)
- Mexican 2% Puerto Rican 2%
- Common ancestry
- Lithuanian 4% Italian 3% Romanian 2%
- Foreign-born
- 4% · Canada, Vietnam
- Languages at home
- 93% English-only · Spanish 5% Vietnamese 1%
Political lean MEDSL · Nassau
- 2024 margin
- Solid R (+46.9) · D 26.1% · R 73.1%
- 2008→2024 swing
- -3.1pp toward R · 2008: -43.8pp · 2024: -46.9pp
- All cycles
- 2024: R+46.9 2020: R+45.9 2016: R+50.2 2012: R+48.6 2008: R+43.8
Not yet ingested
- Civics
- —
Market trends
- HPI YoY
- ▲ 49.35%
- Current HPI
- 301.9299
- Rent YoY
- ▲ 2.88%
- Metro
- Jacksonville, FL
- State GDP YoY
- ▲ 3.28%
- F500 in state
- 36
Industry mix (Fortune 500 HQ in FL)
| Industry | F500 HQs | Revenue |
|---|---|---|
| Industrial Technology | 2 | $29B |
|
||
| Insurance | 2 | $17B |
|
||
| Retail | 1 | $60B |
|
||
| Technology Distribution | 1 | $58B |
|
||
| Homebuilding | 1 | $35B |
|
||
| Technology Manufacturing | 1 | $35B |
|
||
Price history
+1180.0% since first listed9 events — show timeline
- 2026-04-25 Pending — realMLS
- 2026-04-14 Listed $256,000 realMLS
- 2025-12-30 Listed $5,000 NFMLS
- 2024-04-18 Listing Removed — realMLS
- 2024-04-02 Listed $419,000 realMLS
- 2007-12-15 Listing Removed — realMLS
- 2007-06-15 Listed $337,000 realMLS
- 2004-10-08 Sold (Public Records) $20,000 Public Records
- 1991-07-24 Sold (Public Records) $20,000 Public Records
Property tax history
+12.1%/yrLatest (2025): $6,612 · +1.6% YoY. Source: county tax records.
Cash-flow waterfall
monthlySold comps — $/sqft
last 12 mo · ≤1 miLoading sold comps…