250 Valleybrook Dr · Athens-Clarke County unified government (balance), GA
Flood risk 1/10 · Minimal
- FEMA flood zone
- X (unshaded)
- Chance of flooding over 30 yrs
- 0.0%
- Est. flood insurance / yr
- $507 – $1,088
Fire risk 1/10 · Minimal
- Est. fire insurance / yr
- $963 – $1,789
Heat risk 6/10 · Moderate
- Hot days now (above 106°F)
- 7 days/yr
- Hot days in 30 yrs
- 17 days/yr
Wind risk 6/10 · Moderate
- Chance of severe wind over 30 yrs
- 27.0%
Air-quality risk 3/10 · Minor
- Unhealthy air days now
- 4 days/yr
- Unhealthy air days in 30 yrs
- 4 days/yr
Risk factors via First Street. Map © Google.
Why this score? — see what drove the C grade
The composite is a weighted blend of 9 inputs, each scored 0–100. Each bar is that input's sub-score; the figure is the points it added to the 100-point composite (weight × sub-score).
- Cash flow +25.9/30.0
- DSCR +8.7/10.0
- 1% rule +7.6/10.0
- ARV discount +7.5/15.0
- Rent growth +2.9/5.0
- Livability +2.5/5.0
- Condition / age +2.5/5.0
- Schools +1.6/10.0
- Appreciation +0.0/10.0
$150,000
🖨 Deal sheet (PDF) 📄 Offer letter ✓ Due diligence
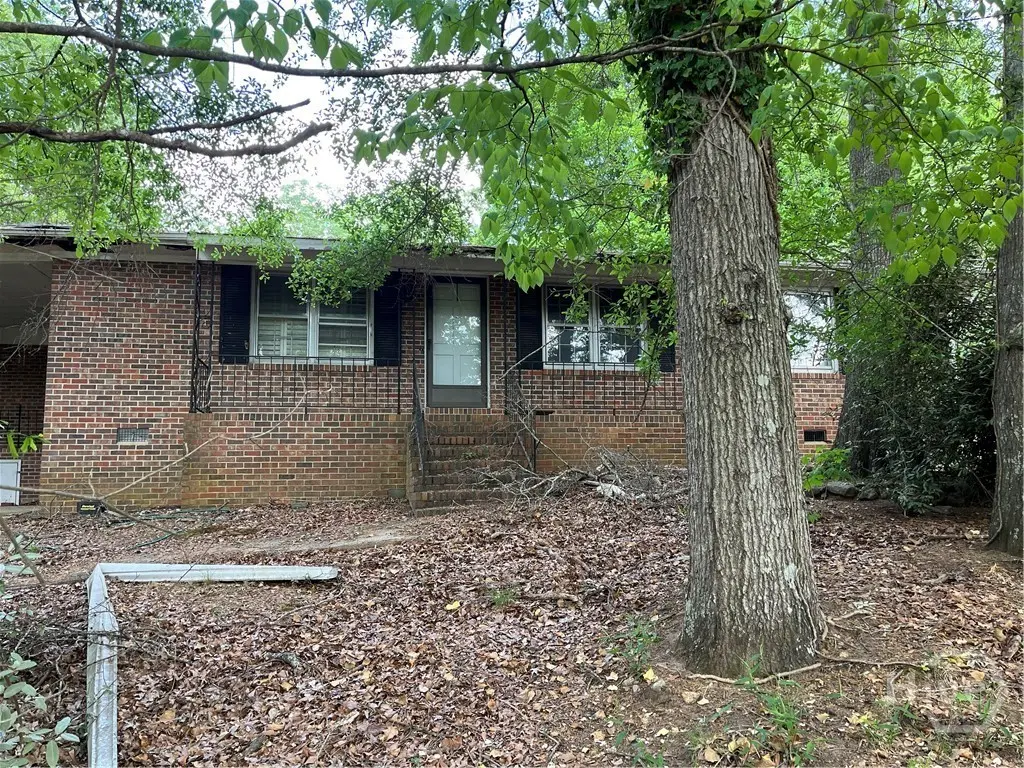
Listing remarks
U/C prior to publishing.
Key facts
- 0.51 acre lot
- Built 1972
Property features AI
Exterior
- Utilities: Public water; Public sewer
- Home design: Single-family residential home; One-story
- Construction: Brick construction
- Exterior features: Lot approximately 0.51 acres; Located in the Forest Heights subdivision; Driving directions available from Ogelthorpe Ave to Valleybrook
Interior
- Bathrooms: 2 full bathrooms
- Heating & cooling: Central electric heating; Central electric cooling
- Interior features: Electric water heater
- Laundry & utility: Dedicated laundry room
Neighborhood map
What this means for you Summary
Snapshot
- This is a 3-bed/2.0-bath single-family listed at $150k.
Deal economics
- At list price, monthly cash flow is $370 ($4k/yr) — positive.
- The deal already cash-flows at list — no discount required.
- Meets the 1% rule at list price ($2k rent vs $150k).
- Cap rate 9.3% vs local median 3.3% in Athens-Clarke County unified government (balance) — top-decile yield for the area; either an underpriced asset or a hidden risk that comps aren't pricing in. Stress-test before assuming the spread holds.
Location & tenants
- Location reads: area grade C — affects rentability + tenant quality, not the cash-flow math above.
- Clarke County (urban): math 17% / reading 21% proficiency, ranked #146 of 174 in GA (top 84%) — low school quality limits family demand, transient renter base, plan for 1-2y turnover; 74% free/reduced lunch — lower-income household profile, screen leases tightly.
- Market conditions: Rents rising (+1.6%/yr); 317 active listings in the ZIP; 25 comparable units currently listed for rent nearby; rentals at typical pace (median 22d on market — plan ~3-4 weeks tenant-placement turnaround); 1,172 units permitted in Clarke County in 2024 (876 in 5+ unit buildings).
- This rent runs 36% of the median local income ($63k/yr) — at the standard rent-burdened threshold; future hikes will face affordability resistance.
Forward outlook
- Local home prices are declining (-3.0%/yr); year-one equity from $1k of loan paydown is wiped out by about $4k of value loss. Plan a longer hold.
- Clarke County population projected at +31% by 2050 — long-run rental-demand tailwind backs the buy-and-hold thesis.
Negotiation context
- Only 1 days on market — expect competitive offers; lowballing is unlikely to land.
Risks & watch-outs
- Climate carrying-cost: major wind risk, 27% chance of damaging wind over 30y; extreme-heat days projected 7→17/yr by 2055 (HVAC capex compounding) — expect insurance premiums to compound above CPI over the hold.
Questions for the listing agent
- Built in 1972 — when were the roof, HVAC, electrical panel, plumbing, and water heater last replaced?
- Is there a deadline driving the sale (1031 exchange, divorce, estate, relocation)? That informs how much negotiation room exists.
- What's the average days-on-market for RENTAL listings here right now (not sales)? A rising rental-DOM trend means longer vacancies and softer asking-rent achievability than the comps imply.
- What's the recent tenant-quality profile in this submarket — average credit score on applications, eviction rate, late-payment / NSF rate, and stable-employment percentage? A property-management company in the area should have these aggregated.
- How much new for-sale + rental construction is in the pipeline within 1–3 miles? Heavy new supply typically softens prices + rents 12–24 months out; constrained supply supports both.
Investment metrics
- 1% rule
- 1.26% ✓
- Cap rate
- 9.25%
- Cash-on-cash
- 10.58%
- DSCR
- 1.47
- GRM
- 6.6
CMA / ARV
- ARV (on-the-fly)
- $355,923
- Comps found
- 11
Show comp detail 11 sales within ~0.75 mi
| Address | Dist | Beds/Ba | Sqft | Sold | Price | $/sf | Match |
|---|---|---|---|---|---|---|---|
| 250 Valleybrook Dr | 0.00mi | 3/2.0 | 1,671 (0%) | 1mo | $150,000 | $90 | 100 |
| 210 Valleybrook Dr | 0.09mi | 3/2.5 | 1,780 (+6%) | 8mo | $490,000 | $275 | 77 |
| 255 Hampton Park Dr | 0.55mi | 3/2.0 | 1,686 (+1%) | 8mo | $359,000 | $213 | 66 |
| 125 Hampton Park Dr | 0.63mi | 3/2.0 | 1,655 (-1%) | 5mo | $310,000 | $187 | 65 |
| 150 Breckenridge Ln | 0.28mi | 3/2.0 | 1,508 (-10%) | 7mo | $372,000 | $247 | 65 |
| 108 Elder Rd | 0.47mi | 3/2.5 | 1,618 (-3%) | 16mo | $374,000 | $231 | 57 |
| 655 Rivermont Rd | 0.61mi | 4/2.0 (+1) | 1,580 (-5%) | 2mo | $380,000 | $241 | 56 |
| 115 Westchester Circle Cir | 0.45mi | 4/3.0 (+1) | 1,524 (-9%) | 0mo | $250,000 | $164 | 55 |
| 115 Davis Pl | 0.63mi | 2/1.5 (-1) | 1,720 (+3%) | 6mo | $238,000 | $138 | 54 |
| 101 Berkeshire Ct | 0.51mi | 4/2.0 (+1) | 1,746 (+4%) | 16mo | $358,000 | $205 | 50 |
| 240 Pine Forest Dr | 0.34mi | 3/2.0 | 1,428 (-14%) | 14mo | $350,350 | $245 | 48 |
Match score weights: distance 35% · size 25% · config 20% · recency 20%. Top-matched comps best support the ARV.
Projected returns pro-forma
-3.0% appreciation · 1.58% rent growth · sell at horizon
- IRR
- -2.1%
- Equity multiple
- 0.92×
- Total profit
- $-3,306
- Equity at exit
- $22,365
- IRR
- 5.9%
- Equity multiple
- 1.41×
- Total profit
- $17,206
- Equity at exit
- $12,969
Cash invested: $42,000 (down + closing). Projections, not guarantees.
Landlord ↔ Tenant lean methodology
- Overall (STATE)
- 90 Strongly Landlord-Friendly
- State Georgia
- 90 Strongly Landlord-Friendly · R+3
- County
- — inherits STATE
- City
- — inherits STATE
ZIP-level market 30606
- Rents YoY
- 1.6%
- Active inventory
- 317
- Price-to-rent
- 6.6×
Monthly cashflow live
- Estimated rent
- $1,887 high interval (Pro) →
- Mortgage (P&I)
- −$787
- Tax from tax record
- −$271 /mo · $3,255/yr
- Insurance
- −$62
- HOA
- −$0
- Vacancy / Maint / Mgmt
- −$396
- Net cashflow
- $370
Break-even live
Sensitivity live
| Price | -10% $455 | -5% $413 | +0% $370 | +5% $328 | +10% $285 |
|---|---|---|---|---|---|
| Rent | -10% $221 | -5% $296 | +0% $370 | +5% $445 | +10% $519 |
| Rate | -1.0pp $446 | -0.5pp $408 | base $370 | +0.5pp $331 | +1.0pp $292 |
UW: 25.0% down · 7.5% · 30yr · 1.5% tax · 5.0% vac · 8.0% maint · 8.0% mgmt
Financing live
Cash to close
- Down payment
- $37,500
- Closing costs
- $4,500
- Reserves months
- —
- Total cash needed
- —
Loan-product check · same deal, 3 products live
Conventional
25% down · 7.5% · 30yr
- Down + closing
- —
- Monthly P&I
- —
- Monthly cashflow
- —
- DSCR
- —
- Eligible?
- —
Personal DTI + credit; lowest rate.
DSCR
20% down · 8.5% · 30yr
- Down + closing
- —
- Monthly P&I
- —
- Monthly cashflow
- —
- DSCR
- —
- Eligible?
- —
No personal income docs; deal must DSCR.
Hard money
10% down · 12.0% · 12mo
- Down + closing
- —
- Monthly P&I
- —
- Monthly cashflow
- —
- DSCR
- —
- Eligible?
- —
Short-term bridge; refi at stabilization.
Rent comps 25 comps
| Address | Beds | Baths | Sqft | Rent | $/sqft | DOM | Units | Dist |
|---|---|---|---|---|---|---|---|---|
| 105 Westchester Dr Athens, GA | 2.0 | 2.5 | 1206 | $1,825 | $1.51 | 44d | 2 | 0.29mi |
| 105 Westchester Dr Athens, GA | 2.0 | 2.5 | 1206 | $1,675 | $1.39 | 14d | 3 | 0.29mi |
| 205 Westchester Dr Athens, GA | 1.0–3.0 | 1.0–2.0 | 1100 | $1,505 | $1.37 | 44d | 1 | 0.35mi |
| 600 Mitchell Bridge Rd #1 Athens, GA | 2.0 | 2.5 | 1275 | $1,900 | $1.49 | 44d | 1 | 0.44mi |
| 255 Ferncliff Dr Athens, GA | 3.0 | 2.0 | 1215 | $1,995 | $1.64 | 22d | 1 | 0.48mi |
| 260 Sherwood Dr Athens, GA | 3.0 | 1.5 | 1186 | $1,700 | $1.43 | 44d | 1 | 0.55mi |
| 888 Horizon Blvd Athens, GA | 1.0–2.0 | 1.0–2.0 | 1066 | $1,795 | $1.68 | 44d | 1 | 0.58mi |
| 700 Mitchell Bridge Rd Athens, GA | 1.0–2.0 | 1.0–2.0 | 1121 | $1,537 | $1.37 | 14d | 7 | 0.78mi |
| 2505 W Broad St Athens, GA | 2.0–3.0 | 2.0 | 1370 | $2,300 | $1.68 | 14d | 5 | 1.01mi |
| 150 Chateau Ter Athens, GA | 1.0–3.0 | 1.0–2.0 | 970 | $1,527 | $1.57 | 14d | 12 | 1.08mi |
| 355 The Preserve Dr Athens, GA | 1.0–3.0 | 1.0–2.0 | 1166 | $2,010 | $1.72 | 22d | 3 | 1.10mi |
| 173 Russell Way Athens, GA | 4.0 | 2.5 | 2218 | $2,224 | $1.00 | 44d | 1 | 1.11mi |
| 195 Sycamore Dr Athens, GA | 1.0–3.0 | 1.0–2.0 | 909 | $1,425 | $1.57 | 14d | 8 | 1.18mi |
| 290 Sunset Dr Athens, GA | 3.0 | 1.0 | 1152 | $1,800 | $1.56 | 44d | 1 | 1.28mi |
| 255 The Preserve Dr Athens, GA | 1.0–4.0 | 1.0–4.0 | 1036 | $1,126 | $1.09 | 14d | 7 | 1.28mi |
| 132 Wood Lake Dr Athens, GA | 1.0–2.0 | 1.0–2.0 | 900 | $1,625 | $1.81 | 14d | 6 | 1.32mi |
| 210 Brittany Pointe Ln Athens, GA | 4.0 | 2.0 | 2000 | $3,200 | $1.60 | 22d | 1 | 1.44mi |
| 125 Wood Lake Dr #208 Athens, GA | 3.0 | 2.0 | 1680 | $1,700 | $1.01 | 22d | 1 | 1.45mi |
| 150 The Preserve Dr #1 Athens, GA | 2.0 | 3.0 | 1856 | $2,077 | $1.12 | 22d | 1 | 1.46mi |
| 150 The Preserve Dr Unit 13A Athens, GA | 2.0 | 2.5 | 1690 | $1,795 | $1.06 | 14d | 1 | 1.46mi |
| 150 The Preserve Dr Unit 9C Athens, GA | 2.0 | 2.5 | 1501 | $2,049 | $1.37 | 22d | 1 | 1.46mi |
| 150 The Preserve Dr Athens, GA | 2.0 | 2.5 | 1720 | $2,076 | $1.21 | 22d | 2 | 1.46mi |
| 150 The Preserve Dr Athens, GA | 2.0 | 2.5 | 1720 | $2,037 | $1.18 | 14d | 2 | 1.46mi |
| 317 Epps Bridge Rd Athens, GA | 2.0 | 1.0 | 1760 | $1,250 | $0.71 | 22d | 1 | 1.47mi |
| 315 Epps Bridge Rd Athens, GA | 2.0 | 1.0 | 1760 | $1,150 | $0.65 | 22d | 1 | 1.49mi |
Listing history 2 events
-
2026-04-29status Pending
-
2026-04-24$150,000 Active
ⓘ Source: listings_history table (triggers on properties + properties_extension) + one-shot
backfill from property_details.listing_events for pre-trigger history.
Tax reassessment forecast GA · Resets to sale price
- Current annual tax
- $3,255 · $271/mo
- Projected year-2 tax
- $3,255 · $271/mo
- Expected delta
- $0/yr ($0/mo · 0.0%)
ⓘ Screening estimate from a state-policy table — verify with the county assessor before closing.
Climate risk First Street
- Flood 1/10 Low FEMA zone X (unshaded) · 0% chance over 30 yrs
- Wildfire 1/10 Low
- Heat 6/10 Major 7 d/yr ≥106°F today · 17 d/yr by 30 yrs out
- Wind 6/10 Major 27% chance of damaging wind over 30 yrs
- Air quality 3/10 Moderate 4 unhealthy d/yr today · 4 by 30 yrs out
Nearby sold comps map
Loading sold comps map…
Walkable amenities ~0.75 mi
Loading nearby amenities…
Taxation est. · year 1
- Rental income
- $22,642
- − Mortgage interest
- −$8,402
- − Property taxes
- −$3,255
- − Insurance
- −$750
- − Repairs & maintenance
- −$1,811
- − Management
- −$1,811
- − Depreciation
- −$4,364
- Taxable income
- $2,248
- Est. tax owed @ 24.0%
- −$540
- After-tax cash flow
- $3,903/yr
For passive investors: Depreciation is non-cash, so a rental often shows a tax loss while cash-flowing — sheltering income. Rental losses are passive: they offset passive income freely, and up to $25,000/yr can offset ordinary (W-2) income if you actively participate and your MAGI is under $100k (phasing out to $0 by $150k); unused losses carry forward. On sale, claimed depreciation is recaptured at up to 25%, and gains may owe capital-gains tax (a 1031 exchange can defer both). Figures are a year-1 estimate at your 24.0% rate — not tax advice; consult a CPA.
Schools (NCES district)
- District
- Clarke County
- NCES district ID
- 1301170
- Math proficiency
- 17% ▼ -15.00%
- Reading proficiency
- 21% ▼ -12.00%
- Median HH income
- $33,649
- Composite
- 15.51/100
- National rank
- #9302
- State rank
- #146 of 174 in GA
Livability — Athens-Clarke County unified government (balance)
No livability data for this city. (Only ~50 U.S. cities are tracked.)
Census & demographics
- Census place
- Athens-Clarke County unified government (balance), GA
- County
- Clarke County · 126,008 people
- City population
- 119,110
- Metro
- Athens-Clarke County, GA
- Population (ZIP)
- 47,865
- Household income
- $63,328
- Rent vs Own
- Severe rent burden
- 3510.0
Population outlook (Clarke County) Hauer SSP2
- Today (2025)
- 141,365 people
- By 2030
- 151,724 · +7.3%
- By 2040
- 168,541 · +19.2%
- By 2050
- 184,855 · +30.8%
- By 2075
- 221,736 · +56.9%
- By 2100
- 253,853 · +79.6%
Race, ethnicity, and origin ACS 2023
- Neighborhood character
- Diverse neighborhood (Simpson 0.58)
- Race & ethnicity
- White 61% Black 20% Hispanic / Latino 11% Two or more races 7% Asian 5%
- Hispanic origin (detail)
- Mexican 7%
- Common ancestry
- Italian 3% Slovak 3% Lithuanian 2%
- Foreign-born
- 11% · Canada, China, Philippines
- Languages at home
- 87% English-only · Spanish 7% Other Asian/Pacific 2% Chinese 1%
Political lean MEDSL · Clarke
- 2024 margin
- Solid D (+38.3) · D 68.6% · R 30.4% · Other 1.0%
- 2008→2024 swing
- +7.0pp toward D · 2008: 31.3pp · 2024: 38.3pp
- All cycles
- 2024: D+38.3 2020: D+42.1 2016: D+38.0 2012: D+28.9 2008: D+31.3
Not yet ingested
- Civics
- —
Market trends
- HPI YoY
- ▼ -454.63%
- Current HPI
- 258.4817
- Rent YoY
- ▲ 1.58%
- Metro
- Athens-Clarke County, GA
- State GDP YoY
- ▲ 2.66%
- F500 in state
- 28
Industry mix (Fortune 500 HQ in GA)
| Industry | F500 HQs | Revenue |
|---|---|---|
| Paper / Packaging | 2 | $29B |
|
||
| Retail | 1 | $160B |
|
||
| Transportation / Logistics | 1 | $91B |
|
||
| Airlines | 1 | $62B |
|
||
| Consumer Goods | 1 | $47B |
|
||
| Utilities | 1 | $25B |
|
||
Price history
2 events — show timeline
- 2026-04-29 Pending — Hive MLS
- 2026-04-24 Listed $150,000 Hive MLS
Property tax history
+12.8%/yrLatest (2025): $3,255 · +5.3% YoY. Source: county tax records.
Cash-flow waterfall
monthlySold comps — $/sqft
last 12 mo · ≤1 miLoading sold comps…