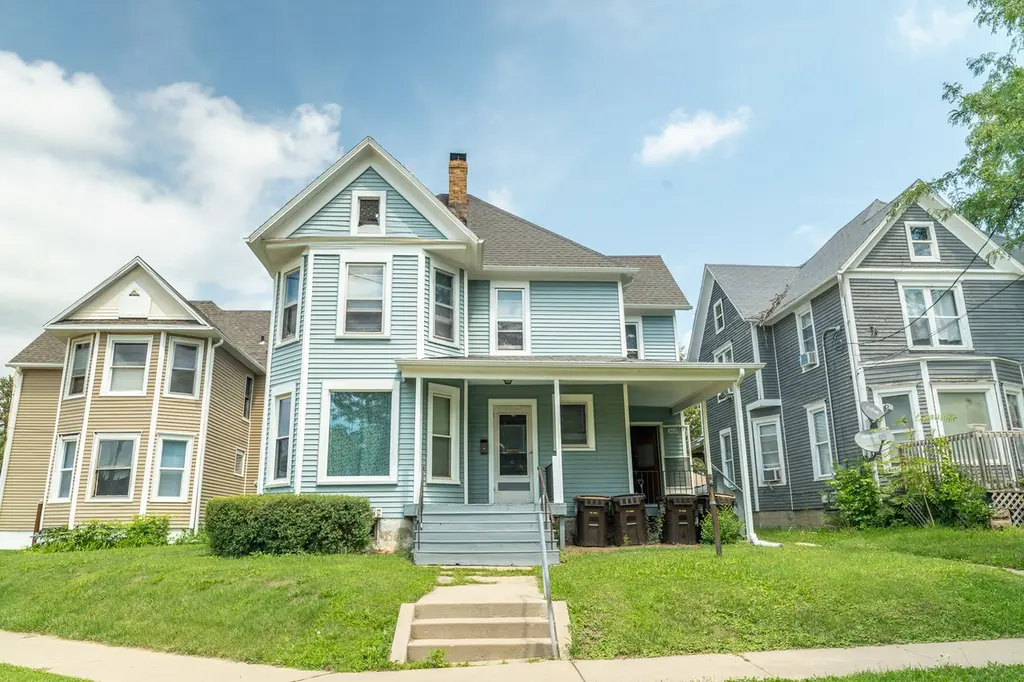
302 E Prospect Ter · Freeport, IL
Flood risk 1/10 · Minimal
- FEMA flood zone
- X (unshaded)
- Chance of flooding over 30 yrs
- 0.0%
- Est. flood insurance / yr
- $507 – $1,088
Fire risk 1/10 · Minimal
- Est. fire insurance / yr
- $804 – $1,492
Heat risk 3/10 · Minor
- Hot days now (above 101°F)
- 7 days/yr
- Hot days in 30 yrs
- 15 days/yr
Wind risk 2/10 · Minimal
- Chance of severe wind over 30 yrs
- —
Air-quality risk 2/10 · Minimal
- Unhealthy air days now
- 1 days/yr
- Unhealthy air days in 30 yrs
- 2 days/yr
Risk factors via First Street. Map © Google.
Why this score? — see what drove the B- grade
The composite is a weighted blend of 9 inputs, each scored 0–100. Each bar is that input's sub-score; the figure is the points it added to the 100-point composite (weight × sub-score).
- Cash flow +30.0/30.0
- DSCR +10.0/10.0
- 1% rule +9.9/10.0
- ARV discount +7.5/15.0
- Livability +3.6/5.0
- Rent growth +2.5/5.0
- Condition / age +2.5/5.0
- Schools +1.0/10.0
- Appreciation +0.0/10.0
$109,900
🖨 Deal sheet 📄 Offer letter ✓ Due diligence
Listing remarks MLS
Great investment opportunity! This well-maintained duplex features a 2 bed/1 bath unit on the first floor and a 1 bed/1 bath unit on the second floor. Perfect for investors or owner-occupants looking to live in one unit and rent the other. Recent updates include new siding and updated gutters (2022). Roof is in good condition. Don’t miss your chance to make this property yours today!
Key facts
- New siding
- Updated gutters
- Built 1892
Tags
Neighborhood map
What this means for you Summary
Snapshot
- This is a 6-bed/4.0-bath other listed at $110k.
Deal economics
- At list price, monthly cash flow is $573 ($7k/yr) — positive.
- The deal already cash-flows at list — no discount required.
- Meets the 1% rule at list price ($2k rent vs $110k).
- Recommended offer: $100k (9.0% below list) — sets the bar for market timing.
- Cap rate 12.6% vs local median 5.8% in Freeport — top-decile yield for the area; either an underpriced asset or a hidden risk that comps aren't pricing in. Stress-test before assuming the spread holds.
Location & tenants
- Location reads 72/100 on livability (#302 in IL) — a middle-class / working-renter tenant base. Strengths: cost of living A+, health & safety A+, housing A-; Watch: schools F, commute F, employment F.
- Freeport SD 145 (town): math 11% / reading 12% proficiency, ranked #565 of 620 in IL (top 91%) — low school quality limits family demand, transient renter base, plan for 1-2y turnover; 65% free/reduced lunch — lower-income household profile, screen leases tightly.
- Market conditions: 197 active listings in the ZIP; 2 comparable units currently listed for rent nearby; 7 units permitted in Stephenson County in 2024 (0 in 5+ unit buildings).
Forward outlook
- Local home prices are declining (-3.0%/yr); year-one equity from $760 of loan paydown is wiped out by about $3k of value loss. Plan a longer hold.
- Stephenson County population projected at -29% by 2050 — secular population decline; favor cash flow + early exit over multi-decade hold.
- At projected returns (-3.0% appreciation + 3.0% rent growth), your $31k cash investment doubles in ~6 years — after that, you're playing with house money.
Negotiation context
- It's been on market 104 days — a 9% lower offer ($100k) is reasonable based on typical stale-listing flexibility.
- 7 sale attempts since 5y ago with the ask held roughly flat each time — persistent listings suggest the price (not the market) is what's stuck; bring a comps-based counter.
- Current owner paid $25k; list at $110k implies a 340% gain — meaningful room to come down on a strong offer.
Risks & watch-outs
- Watch-outs: built in 1892 — expect roof / HVAC / electrical / plumbing capex.
Questions for the listing agent
- It's been on market 104 days. Have you received any prior offers? Is the seller open to a 9% concession, seller financing, or rate buy-down credit?
- Built in 1892 — when were the roof, HVAC, electrical panel, plumbing, and water heater last replaced?
- Why hasn't it sold? Are there any deal-killer items the seller is aware of (foundation, flood, title, zoning, code violations)?
- Is there a deadline driving the sale (1031 exchange, divorce, estate, relocation)? That informs how much negotiation room exists.
- Schools are F-rated, which usually means shorter tenancies and higher turnover. Who's the typical renter profile here, and what's been the actual vacancy rate?
- What's the average days-on-market for RENTAL listings here right now (not sales)? A rising rental-DOM trend means longer vacancies and softer asking-rent achievability than the comps imply.
- What's the recent tenant-quality profile in this submarket — average credit score on applications, eviction rate, late-payment / NSF rate, and stable-employment percentage? A property-management company in the area should have these aggregated.
- How much new for-sale + rental construction is in the pipeline within 1–3 miles? Heavy new supply typically softens prices + rents 12–24 months out; constrained supply supports both.
Investment metrics
- 1% rule
- 1.49% ✓
- Cap rate
- 12.55%
- Cash-on-cash
- 22.35%
- DSCR
- 1.99
- GRM
- 5.6
CMA / ARV
- ARV (median comp)
- $62,531
- List price
- $109,900
- Delta
- 75.75%
- Verdict
- OVERPRICED
- Comps
- 20 within 1.0 mi
Projected returns pro-forma
-3.0% appreciation · 3.0% rent growth · sell at horizon
- IRR
- 15.1%
- Equity multiple
- 1.61×
- Total profit
- $18,687
- Equity at exit
- $16,386
- IRR
- 23.8%
- Equity multiple
- 3.06×
- Total profit
- $63,262
- Equity at exit
- $9,502
Cash invested: $30,772 (down + closing). Projections, not guarantees.
Landlord ↔ Tenant lean methodology
- Overall (STATE)
- 43 Moderately Tenant-Leaning
- State Illinois
- 43 Moderately Tenant-Leaning · D+7
- County
- — inherits STATE
- City
- — inherits STATE
ZIP-level market 61032
- Home prices YoY
- -19.5%
- Active inventory
- 197
- Price-to-rent
- 5.6×
Monthly cashflow live
- Estimated rent
- $1,632 medium interval (Pro) →
- Mortgage (P&I)
- −$576
- Tax from tax record
- −$94 /mo · $1,130/yr
- Insurance
- −$46
- HOA
- −$0
- Vacancy / Maint / Mgmt
- −$343
- Net cashflow
- $573
Break-even live
UW: 25.0% down · 7.5% · 30yr · 1.5% tax · 5.0% vac · 8.0% maint · 8.0% mgmt
Financing live
Cash to close
- Down payment
- $27,475
- Closing costs
- $3,297
- Reserves months
- —
- Total cash needed
- —
Loan-product check · same deal, 3 products live
Conventional
25% down · 7.5% · 30yr
- Down + closing
- —
- Monthly P&I
- —
- Monthly cashflow
- —
- DSCR
- —
- Eligible?
- —
Personal DTI + credit; lowest rate.
DSCR
20% down · 8.5% · 30yr
- Down + closing
- —
- Monthly P&I
- —
- Monthly cashflow
- —
- DSCR
- —
- Eligible?
- —
No personal income docs; deal must DSCR.
Hard money
10% down · 12.0% · 12mo
- Down + closing
- —
- Monthly P&I
- —
- Monthly cashflow
- —
- DSCR
- —
- Eligible?
- —
Short-term bridge; refi at stabilization.
Rent comps 2 comps
| Address | Beds | Baths | Sqft | Rent | $/sqft | DOM | Units | Dist |
|---|---|---|---|---|---|---|---|---|
| 1219 1/2 S Chicago Ave Freeport, IL | 5.0 | 2.0 | 2672 | $1,625 | $0.61 | 43d | 1 | 0.16mi |
| 1776 S Hance Dr Unit 1776 Freeport, IL | 5.0 | 2.0 | — | $1,695 | — | 43d | 1 | 1.44mi |
Listing history 35 events
-
2026-06-18days on market $109,900 Active 104 DOM
-
2026-06-17days on market $109,900 Active 103 DOM
-
2026-06-16days on market $109,900 Active 102 DOM
-
2026-06-15days on market $109,900 Active 101 DOM
-
2026-06-13days on market $109,900 Active 99 DOM
-
2026-06-12days on market $109,900 Active 98 DOM
-
2026-06-09days on market $109,900 Active 95 DOM
-
2026-06-08days on market $109,900 Active 94 DOM
-
2026-06-07days on market $109,900 Active 93 DOM
-
2026-06-07days on market $109,900 Active 92 DOM
-
2026-06-04days on market $109,900 Active 89 DOM
-
2026-06-02days on market $109,900 Active 88 DOM
-
2026-06-01days on market $109,900 Active 87 DOM
-
2026-05-31days on market $109,900 Active 86 DOM
-
2026-05-31days on market $109,900 Active 85 DOM
-
2026-03-11$109,900 Active 392-char remark
Show marketing remark (392 chars)
Great investment opportunity! This well-maintained duplex features a 2 bed/1 bath unit on the first floor and a 1 bed/1 bath unit on the second floor. Perfect for investors or owner-occupants looking to live in one unit and rent the other. Recent updates include new siding and updated gutters (2022). Roof is in good condition. Don’t miss your chance to make this property yours today!
-
2026-03-06$109,900 Active 386-char remark
Show marketing remark (386 chars)
Great investment opportunity! This well-maintained duplex features a 2 bed/1 bath unit on the first floor and a 1 bed/1 bath unit on the second floor. Perfect for investors or owner-occupants looking to live in one unit and rent the other. Recent updates include new siding and updated gutters (2022). Roof is in good condition. Don't miss your chance to make this property yours today!
-
2025-11-21historical
-
2025-11-11Active
-
2025-10-28historical
-
2025-10-07price $115,000
-
2025-10-07price
-
2025-08-31price
-
2025-08-31price $120,000
-
2025-07-28Active
-
2022-03-24soldstatus $25,000
-
2022-03-08soldstatus $25,000 Closed
-
2022-02-15historical Contingent - Continue to Show
-
2022-02-14status Active Under Contract
-
2021-12-15status Active
-
2021-12-08status Active Under Contract (Do Not Show)
-
2021-11-29$35,000 Active
-
2021-08-21status Active Under Contract (Do Not Show)
-
2021-08-20historical
-
2021-08-19Active
ⓘ Source: listings_history table (triggers on properties + properties_extension) + one-shot
backfill from property_details.listing_events for pre-trigger history.
Tax reassessment forecast IL · Partial reset (capped growth)
- Current annual tax
- $1,130 · $94/mo
- Projected year-2 tax
- $1,813 · $151/mo
- Expected delta
- +$682/yr (+$57/mo · 60.4%)
ⓘ Screening estimate from a state-policy table — verify with the county assessor before closing.
Climate risk First Street
- Flood 1/10 Low FEMA zone X (unshaded) · 0% chance over 30 yrs
- Wildfire 1/10 Low
- Heat 3/10 Moderate 7 d/yr ≥101°F today · 15 d/yr by 30 yrs out
- Wind 2/10 Low
- Air quality 2/10 Low 1 unhealthy d/yr today · 2 by 30 yrs out
Nearby sold comps map
Loading sold comps map…
Walkable amenities ~0.75 mi
Loading nearby amenities…
Taxation est. · year 1
- Rental income
- $19,585
- − Mortgage interest
- −$6,156
- − Property taxes
- −$1,130
- − Insurance
- −$550
- − Repairs & maintenance
- −$1,567
- − Management
- −$1,567
- − Depreciation
- −$3,197
- Taxable income
- $5,419
- Est. tax owed @ 24.0%
- −$1,300
- After-tax cash flow
- $5,576/yr
For passive investors: Depreciation is non-cash, so a rental often shows a tax loss while cash-flowing — sheltering income. Rental losses are passive: they offset passive income freely, and up to $25,000/yr can offset ordinary (W-2) income if you actively participate and your MAGI is under $100k (phasing out to $0 by $150k); unused losses carry forward. On sale, claimed depreciation is recaptured at up to 25%, and gains may owe capital-gains tax (a 1031 exchange can defer both). Figures are a year-1 estimate at your 24.0% rate — not tax advice; consult a CPA.
Schools (NCES district)
- District
- Freeport SD 145
- NCES district ID
- 1715900
- Math proficiency
- 11% ▼ -3.00%
- Reading proficiency
- 12% ▼ -5.00%
- Median HH income
- $39,803
- Composite
- 9.89/100
- National rank
- #9821
- State rank
- #565 of 620 in IL
Livability — Freeport
- Score
- 72/100
- State rank
- #302
- US rank
- #5927
Category grades
Schools grade is shown separately in the Schools card above.
Census & demographics
- Census place
- Freeport, IL
- Population (ZIP)
- 29,072
Population outlook (Stephenson County) Hauer SSP2
- Today (2025)
- 41,802 people
- By 2030
- 39,487 · -5.5%
- By 2040
- 34,534 · -17.4%
- By 2050
- 29,693 · -29.0%
- By 2075
- 21,196 · -49.3%
- By 2100
- 14,596 · -65.1%
Race, ethnicity, and origin ACS 2023
- Neighborhood character
- Predominantly White (73%)
- Race & ethnicity
- White 73% Black 12% Two or more races 10% Hispanic / Latino 6% Asian 1%
- Hispanic origin (detail)
- Mexican 4% Puerto Rican 1%
- Common ancestry
- Iranian 3% Romanian 2% Lithuanian 2%
- Foreign-born
- 3% · Canada
- Languages at home
- 96% English-only · Spanish 3% Other Indo-European 1%
Political lean MEDSL · Stephenson
- 2024 margin
- R (+19.4) · D 39.5% · R 58.9% · Other 1.6%
- 2008→2024 swing
- -26.1pp toward R · 2008: 6.7pp · 2024: -19.4pp
- All cycles
- 2024: R+19.4 2020: R+15.7 2016: R+17.0 2012: R+4.6 2008: D+6.7
Not yet ingested
- Civics
- —
Market trends
- HPI YoY
- ▼ -39.75%
- Current HPI
- 163.677
- Rent YoY
- —
- Metro
- —
- State GDP YoY
- ▲ 1.59%
- F500 in state
- 60
Industry mix (Fortune 500 HQ in IL)
| Industry | F500 HQs | Revenue |
|---|---|---|
| Insurance | 4 | $201B |
|
||
| Consumer Goods | 4 | $87B |
|
||
| Industrial Machinery | 3 | $64B |
|
||
| Healthcare | 2 | $55B |
|
||
| Retail / Pharmacy | 1 | $148B |
|
||
| Agriculture / Food | 1 | $86B |
|
||
Price history
+214.0% since first listed20 events — show timeline
- 2026-03-11 Listed $109,900 NWIAR
- 2026-03-06 Listed $109,900 MRED as Distributed by MLS Grid
- 2025-11-21 Listing Removed — MRED as Distributed by MLS Grid
- 2025-11-11 Listed — MRED as Distributed by MLS Grid
- 2025-10-28 Listing Removed — MRED as Distributed by MLS Grid
- 2025-10-07 Price Changed $115,000 NWIAR
- 2025-10-07 Price Changed — MRED as Distributed by MLS Grid
- 2025-08-31 Price Changed — MRED as Distributed by MLS Grid
- 2025-08-31 Price Changed $120,000 NWIAR
- 2025-07-28 Listed — MRED as Distributed by MLS Grid
- 2022-03-24 Sold (Public Records) $25,000 Public Records
- 2022-03-08 Sold (MLS) $25,000 MRED as Distributed by MLS Grid
- 2022-02-15 Contingent — MRED as Distributed by MLS Grid
- 2022-02-14 Pending — MRED as Distributed by MLS Grid
- 2021-12-15 Relisted — MRED as Distributed by MLS Grid
- 2021-12-08 Pending — MRED as Distributed by MLS Grid
- 2021-11-29 Listed $35,000 MRED as Distributed by MLS Grid
- 2021-08-21 Pending — MRED as Distributed by MLS Grid
- 2021-08-20 Listing Removed — MRED as Distributed by MLS Grid
- 2021-08-19 Listed — MRED as Distributed by MLS Grid
Property tax history
+16.9%/yrLatest (2024): $1,130 · -0.4% YoY. Source: county tax records.
Cash-flow waterfall
monthlySold comps — $/sqft
last 12 mo · ≤1 miLoading sold comps…