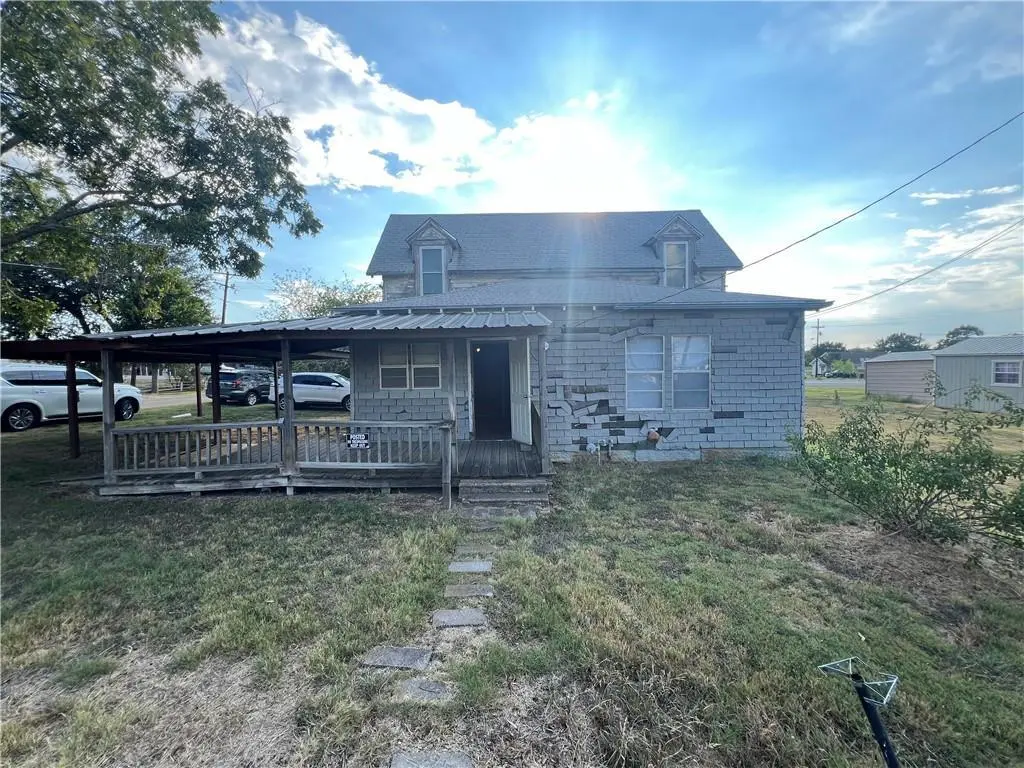
201 N Wiebusch St · Riesel, TX
Flood risk 1/10 · Minimal
- FEMA flood zone
- X (unshaded)
- Chance of flooding over 30 yrs
- 0.0%
- Est. flood insurance / yr
- $507 – $1,088
Fire risk 4/10 · Minor
- Est. fire insurance / yr
- $1,222 – $2,270
Heat risk 7/10 · Major
- Hot days now (above 108°F)
- 7 days/yr
- Hot days in 30 yrs
- 25 days/yr
Wind risk 6/10 · Moderate
- Chance of severe wind over 30 yrs
- 68.0%
Air-quality risk 1/10 · Minimal
- Unhealthy air days now
- 0 days/yr
- Unhealthy air days in 30 yrs
- 0 days/yr
Risk factors via First Street. Map © Google.
Why this score? — see what drove the B+ grade
The composite is a weighted blend of 9 inputs, each scored 0–100. Each bar is that input's sub-score; the figure is the points it added to the 100-point composite (weight × sub-score).
- Cash flow +30.0/30.0
- 1% rule +10.0/10.0
- DSCR +10.0/10.0
- ARV discount +7.5/15.0
- Appreciation +6.9/10.0
- Livability +3.6/5.0
- Schools +3.2/10.0
- Rent growth +2.5/5.0
- Condition / age +2.5/5.0
$89,900
🖨 Deal sheet 📄 Offer letter ✓ Due diligence
Listing remarks MLS
Combo on front door. Home to be sold as is. This home is waiting for you to make it your own. Only 20 minutes to downtown Waco and HEB. This would also make a great investment for future Baylor students. Only 15 minutes from Baylor Campus. Square footage from MCAD. Buyer and buyers agent to verify sq ft and zoning.
Key facts
- 0.23 acre lot
- 2 parking spots
- Built 1940
Neighborhood map
What this means for you Summary
Snapshot
- This is a 3-bed/2.0-bath single-family listed at $90k.
Deal economics
- At list price, monthly cash flow is $451 ($5k/yr) — positive.
- The deal already cash-flows at list — no discount required.
- Meets the 1% rule at list price ($1k rent vs $90k).
- Recommended offer: $79k (12.0% below list) — sets the bar for market timing.
Location & tenants
- Location reads 71/100 on livability (#324 in TX) — a middle-class / working-renter tenant base. Strengths: employment A+, cost of living A+, housing A+; Watch: schools D+, amenities F, commute F.
- Riesel ISD (rural): math 31% / reading 45% proficiency, ranked #457 of 826 in TX (top 55%) — families likely to look elsewhere, expect single-tenant / working-renter base with shorter leases.
- Market conditions: 52 active listings in the ZIP; 1,014 units permitted in McLennan County in 2024 (200 in 5+ unit buildings).
Forward outlook
- In year one you build about $4k of equity ($622 loan paydown + $3k appreciation (3.8% local appreciation)).
- McLennan County population projected at +17% by 2050 — long-run rental-demand tailwind backs the buy-and-hold thesis.
- At projected returns (3.8% appreciation + 3.0% rent growth), your $25k cash investment doubles in ~3 years — after that, you're playing with house money.
- By year 8, paydown + projected appreciation supports a ~$30k cash-out refi (75% LTV) — recoverable capital for the next deal without selling this one.
Negotiation context
- It's been on market 433 days — a 12% lower offer ($79k) is reasonable based on typical stale-listing flexibility.
Risks & watch-outs
- Watch-outs: built in 1940 — expect roof / HVAC / electrical / plumbing capex.
- Climate carrying-cost: major wind risk, 68% chance of damaging wind over 30y; extreme-heat days projected 7→25/yr by 2055 (HVAC capex compounding) — expect insurance premiums to compound above CPI over the hold.
Questions for the listing agent
- It's been on market 433 days. Have you received any prior offers? Is the seller open to a 12% concession, seller financing, or rate buy-down credit?
- Built in 1940 — when were the roof, HVAC, electrical panel, plumbing, and water heater last replaced?
- Why hasn't it sold? Are there any deal-killer items the seller is aware of (foundation, flood, title, zoning, code violations)?
- Is there a deadline driving the sale (1031 exchange, divorce, estate, relocation)? That informs how much negotiation room exists.
- Schools are D-rated, which usually means shorter tenancies and higher turnover. Who's the typical renter profile here, and what's been the actual vacancy rate?
- What's the average days-on-market for RENTAL listings here right now (not sales)? A rising rental-DOM trend means longer vacancies and softer asking-rent achievability than the comps imply.
- What's the recent tenant-quality profile in this submarket — average credit score on applications, eviction rate, late-payment / NSF rate, and stable-employment percentage? A property-management company in the area should have these aggregated.
- How much new for-sale + rental construction is in the pipeline within 1–3 miles? Heavy new supply typically softens prices + rents 12–24 months out; constrained supply supports both.
Investment metrics
- 1% rule
- 1.58% ✓
- Cap rate
- 12.32%
- Cash-on-cash
- 21.52%
- DSCR
- 1.96
- GRM
- 5.3
CMA / ARV
- ARV (median comp)
- $216,010
- List price
- $89,900
- Delta
- -58.38%
- Verdict
- UNDERPRICED
- Comps
- 20 within 1.0 mi
Show comp detail 3 sales within ~0.75 mi
| Address | Dist | Beds/Ba | Sqft | Sold | Price | $/sf | Match |
|---|---|---|---|---|---|---|---|
| 210 S Jena St | 0.25mi | 3/2.0 | 1,978 (-2%) | 5mo | $299,500 | $151 | 80 |
| 215 Fair Park St | 0.65mi | 4/2.0 (+1) | 1,994 (-2%) | 10mo | $90,000 | $45 | 54 |
| 104 Canton Ln | 0.64mi | 4/2.0 (+1) | 1,855 (-8%) | 12mo | $330,000 | $178 | 41 |
Match score weights: distance 35% · size 25% · config 20% · recency 20%. Top-matched comps best support the ARV.
Projected returns pro-forma
3.84% appreciation · 3.0% rent growth · sell at horizon
- IRR
- 29.4%
- Equity multiple
- 2.74×
- Total profit
- $43,692
- Equity at exit
- $44,741
- IRR
- 29.1%
- Equity multiple
- 5.39×
- Total profit
- $110,487
- Equity at exit
- $72,517
Cash invested: $25,172 (down + closing). Projections, not guarantees.
Landlord ↔ Tenant lean methodology
- Overall (STATE)
- 87 Strongly Landlord-Friendly
- State Texas
- 87 Strongly Landlord-Friendly · R+5
- County
- — inherits STATE
- City
- — inherits STATE
ZIP-level market 76682
- Home prices YoY
- 1.9%
- Active inventory
- 52
- Price-to-rent
- 5.3×
Monthly cashflow live
- Estimated rent
- $1,420 medium interval (Pro) →
- Mortgage (P&I)
- −$471
- Tax from tax record
- −$161 /mo · $1,934/yr
- Insurance
- −$37
- HOA
- −$0
- Vacancy / Maint / Mgmt
- −$298
- Net cashflow
- $451
Break-even live
UW: 25.0% down · 7.5% · 30yr · 1.5% tax · 5.0% vac · 8.0% maint · 8.0% mgmt
Financing live
Cash to close
- Down payment
- $22,475
- Closing costs
- $2,697
- Reserves months
- —
- Total cash needed
- —
Loan-product check · same deal, 3 products live
Conventional
25% down · 7.5% · 30yr
- Down + closing
- —
- Monthly P&I
- —
- Monthly cashflow
- —
- DSCR
- —
- Eligible?
- —
Personal DTI + credit; lowest rate.
DSCR
20% down · 8.5% · 30yr
- Down + closing
- —
- Monthly P&I
- —
- Monthly cashflow
- —
- DSCR
- —
- Eligible?
- —
No personal income docs; deal must DSCR.
Hard money
10% down · 12.0% · 12mo
- Down + closing
- —
- Monthly P&I
- —
- Monthly cashflow
- —
- DSCR
- —
- Eligible?
- —
Short-term bridge; refi at stabilization.
Listing history 19 events
-
2026-06-18days on market $89,900 Active 433 DOM
-
2026-06-17days on market $89,900 Active 432 DOM
-
2026-06-16days on market $89,900 Active 431 DOM
-
2026-06-15days on market $89,900 Active 430 DOM
-
2026-06-14days on market $89,900 Active 428 DOM
-
2026-06-13days on market $89,900 Active 427 DOM
-
2026-06-10days on market $89,900 Active 425 DOM
-
2026-06-09days on market $89,900 Active 424 DOM
-
2026-06-08days on market $89,900 Active 423 DOM
-
2026-06-07days on market $89,900 Active 422 DOM
-
2026-06-05days on market $89,900 Active 419 DOM
-
2026-06-03days on market $89,900 Active 418 DOM
-
2026-06-02days on market $89,900 Active 417 DOM
-
2026-06-01days on market $89,900 Active 416 DOM
-
2026-05-31days on market $89,900 Active 415 DOM
-
2026-05-30days on market $89,900 Active 414 DOM
-
2026-04-18price $89,900 316-char remark
Show marketing remark (316 chars)
Combo on front door. Home to be sold as is. This home is waiting for you to make it your own. Only 20 minutes to downtown Waco and HEB. This would also make a great investment for future Baylor students. Only 15 minutes from Baylor Campus. Square footage from MCAD. Buyer and buyers agent to verify sq ft and zoning.
-
2025-08-12price $109,900 316-char remark
Show marketing remark (316 chars)
Combo on front door. Home to be sold as is. This home is waiting for you to make it your own. Only 20 minutes to downtown Waco and HEB. This would also make a great investment for future Baylor students. Only 15 minutes from Baylor Campus. Square footage from MCAD. Buyer and buyers agent to verify sq ft and zoning.
-
2024-10-04$119,900 Active 316-char remark
Show marketing remark (316 chars)
Combo on front door. Home to be sold as is. This home is waiting for you to make it your own. Only 20 minutes to downtown Waco and HEB. This would also make a great investment for future Baylor students. Only 15 minutes from Baylor Campus. Square footage from MCAD. Buyer and buyers agent to verify sq ft and zoning.
ⓘ Source: listings_history table (triggers on properties + properties_extension) + one-shot
backfill from property_details.listing_events for pre-trigger history.
Tax reassessment forecast TX · Resets to sale price
- Current annual tax
- $1,934 · $161/mo
- Projected year-2 tax
- $1,934 · $161/mo
- Expected delta
- $0/yr ($0/mo · 0.0%)
ⓘ Screening estimate from a state-policy table — verify with the county assessor before closing.
Climate risk First Street
- Flood 1/10 Low FEMA zone X (unshaded) · 0% chance over 30 yrs
- Wildfire 4/10 Moderate
- Heat 7/10 Severe 7 d/yr ≥108°F today · 25 d/yr by 30 yrs out
- Wind 6/10 Major 68% chance of damaging wind over 30 yrs
- Air quality 1/10 Low 0 unhealthy d/yr today · 0 by 30 yrs out
Nearby sold comps map
Loading sold comps map…
Walkable amenities ~0.75 mi
Loading nearby amenities…
Taxation est. · year 1
- Rental income
- $17,036
- − Mortgage interest
- −$5,036
- − Property taxes
- −$1,934
- − Insurance
- −$450
- − Repairs & maintenance
- −$1,363
- − Management
- −$1,363
- − Depreciation
- −$2,615
- Taxable income
- $4,275
- Est. tax owed @ 24.0%
- −$1,026
- After-tax cash flow
- $4,391/yr
For passive investors: Depreciation is non-cash, so a rental often shows a tax loss while cash-flowing — sheltering income. Rental losses are passive: they offset passive income freely, and up to $25,000/yr can offset ordinary (W-2) income if you actively participate and your MAGI is under $100k (phasing out to $0 by $150k); unused losses carry forward. On sale, claimed depreciation is recaptured at up to 25%, and gains may owe capital-gains tax (a 1031 exchange can defer both). Figures are a year-1 estimate at your 24.0% rate — not tax advice; consult a CPA.
Schools (NCES district)
- District
- Riesel ISD
- NCES district ID
- 4837110
- Math proficiency
- 31% ▼ -10.00%
- Reading proficiency
- 45% ▲ 1.00%
- Median HH income
- $45,466
- Composite
- 32.35/100
- National rank
- #5743
- State rank
- #457 of 826 in TX
Livability — Riesel
- Score
- 71/100
- State rank
- #324
- US rank
- #7151
Category grades
Schools grade is shown separately in the Schools card above.
Census & demographics
- Census place
- Riesel, TX
- Population (ZIP)
- 3,559
Population outlook (McLennan County) Hauer SSP2
- Today (2025)
- 264,191 people
- By 2030
- 273,578 · +3.6%
- By 2040
- 291,506 · +10.3%
- By 2050
- 308,044 · +16.6%
- By 2075
- 349,648 · +32.3%
- By 2100
- 364,779 · +38.1%
Race, ethnicity, and origin ACS 2023
- Neighborhood character
- Predominantly White (77%)
- Race & ethnicity
- White 77% Hispanic / Latino 17% Two or more races 10% Black 1% Native American 1%
- Hispanic origin (detail)
- Mexican 16%
- Common ancestry
- Lithuanian 3% Slovak 2% Iranian 1%
- Foreign-born
- 3% · Canada
- Languages at home
- 85% English-only · Spanish 14%
Political lean MEDSL · McLennan
- 2024 margin
- Solid R (+30.9) · D 34.0% · R 64.9% · Other 1.0%
- 2008→2024 swing
- -7.0pp toward R · 2008: -23.9pp · 2024: -30.9pp
- All cycles
- 2024: R+30.9 2020: R+23.4 2016: R+27.1 2012: R+29.8 2008: R+23.9
Not yet ingested
- Civics
- —
Market trends
- HPI YoY
- ▲ 3.84%
- Current HPI
- 206.1258
- Rent YoY
- —
- Metro
- —
- State GDP YoY
- ▲ 3.95%
- F500 in state
- 110
Industry mix (Fortune 500 HQ in TX)
| Industry | F500 HQs | Revenue |
|---|---|---|
| Energy | 16 | $1,198B |
|
||
| Technology | 5 | $198B |
|
||
| Engineering / Construction | 4 | $72B |
|
||
| Energy Services | 3 | $60B |
|
||
| Utilities | 3 | $41B |
|
||
| Healthcare | 2 | $330B |
|
||
Price history
-25.0% since first listed3 events — show timeline
- 2026-04-18 Price Changed $89,900 NTREIS
- 2025-08-12 Price Changed $109,900 NTREIS
- 2024-10-04 Listed $119,900 NTREIS
Property tax history
+5.7%/yrLatest (2025): $1,934 · -2.3% YoY. Source: county tax records.
Cash-flow waterfall
monthlySold comps — $/sqft
last 12 mo · ≤1 miLoading sold comps…