 Triplex
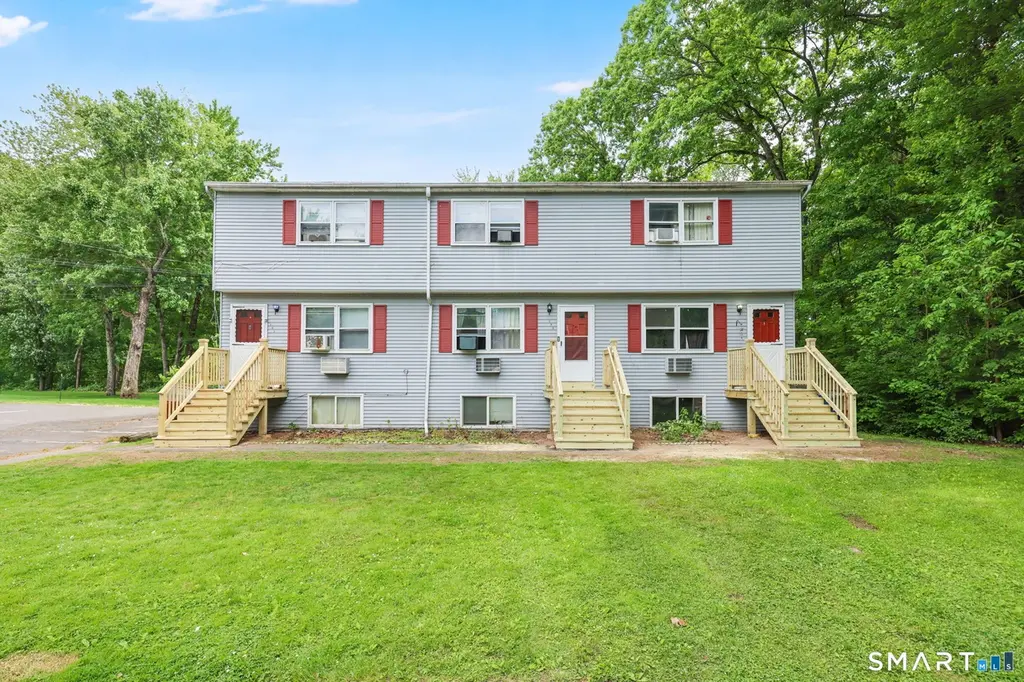
103 Caesar Dr · Bristol, CT
Flood risk No data
- FEMA flood zone
- —
- Chance of flooding over 30 yrs
- —
- Est. flood insurance / yr
- —
Fire risk No data
- Est. fire insurance / yr
- —
Heat risk No data
- Hot days now (above threshold)
- —
- Hot days in 30 yrs
- —
Wind risk No data
- Chance of severe wind over 30 yrs
- —
Air-quality risk No data
- Unhealthy air days now
- —
- Unhealthy air days in 30 yrs
- —
Risk factors via First Street. Map © Google.
Why this score? — see what drove the C grade
The composite is a weighted blend of 9 inputs, each scored 0–100. Each bar is that input's sub-score; the figure is the points it added to the 100-point composite (weight × sub-score).
- Cash flow +19.4/30.0
- ARV discount +12.6/15.0
- DSCR +6.1/10.0
- 1% rule +5.2/10.0
- Livability +4.0/5.0
- Rent growth +3.9/5.0
- Schools +3.2/10.0
- Condition / age +2.5/5.0
- Appreciation +0.0/10.0
$535,000
🖨 Deal sheet 📄 Offer letter ✓ Due diligence
Multi-family units
County records classify this as Multi-Family (2-4 Unit). Listing-text estimate: 3 units. confirmed
Listing remarks
* * Highest and Best Offers Requested by 6/11 at 5 pm * * Extremely well maintained 3 Family property has 6 Bedrooms, 6 Bathrooms, and great current tenants. With a Big backyard built for barbecues, games of tag, or community gardening club, this multifamily home is everything a new owner could want.
Key facts
- Big backyard
- 0.35 acre lot
- Built 1976
Tags
Property features AI
Finance
- Financial info: Assessed value listed
Exterior
- Utilities: Public water connected; Public sewer connected
- Home design: Multi-family property (3-family)
- Construction: Frame construction; Concrete foundation; Asphalt shingle roof
- Exterior features: Level lot; Vinyl siding
Interior
- Bedrooms: 6 bedrooms
- Bathrooms: 6 full bathrooms
- Heating & cooling: Hot water heat; Wall unit cooling; Natural gas hot water (tankless) in street
- Interior features: Full basement; Has attic with hatch access; 16 total rooms
Neighborhood map
What this means for you Summary
Snapshot
- This is a 3 × 2-bed/2.0-bath units multifamily listed at $535k.
Deal economics
- At list price, monthly cash flow is $593 ($7k/yr) — positive. Per door: $198/mo.
- The deal already cash-flows at list — no discount required.
- Meets the 1% rule at list price ($5k rent vs $535k).
- Cap rate 7.6% vs local median 3.3% in Bristol — top-decile yield for the area; either an underpriced asset or a hidden risk that comps aren't pricing in. Stress-test before assuming the spread holds.
Location & tenants
- Location reads 81/100 on livability (#21 in CT, #1,585 nationally) — a professional / high-income tenant draw. Strengths: crime A+, housing A+, health & safety A+; Watch: schools C-, commute F.
- Bristol School District (suburban): math 28% / reading 44% proficiency, ranked #109 of 153 in CT (top 71%) — families likely to look elsewhere, expect single-tenant / working-renter base with shorter leases.
- Market conditions: Rents rising fast (+5.4%/yr); 220 active listings in the ZIP; solid renter incomes; 502 units permitted in Naugatuck Valley Planning Region in 2024 (171 in 5+ unit buildings).
- At $5,467/mo this rent would consume 83% of the median local household income ($79k/yr) (locally 2172% of renters already pay >50% of income on rent) — very limited rent-growth headroom before tenants either downsize or default.
Forward outlook
- Local home prices are declining (-3.0%/yr); year-one equity from $4k of loan paydown is wiped out by about $16k of value loss. Plan a longer hold.
Negotiation context
- Only 9 days on market — expect competitive offers; lowballing is unlikely to land.
- 2 sale attempts since 25y ago with the ask held roughly flat each time — persistent listings suggest the price (not the market) is what's stuck; bring a comps-based counter.
- Current owner paid $283k; list at $535k implies a 89% gain — meaningful room to come down on a strong offer.
Questions for the listing agent
- Can we see the unit-by-unit rent roll, current vacancy, and any below-market leases? What's the average tenancy length?
- What capital expenditures (roof, boiler, parking lot, exteriors) have been made in the last 5 years, and what's planned in the next 2?
- Built in 1976 — when were the roof, HVAC, electrical panel, plumbing, and water heater last replaced?
- Is there a deadline driving the sale (1031 exchange, divorce, estate, relocation)? That informs how much negotiation room exists.
- What's the average days-on-market for RENTAL listings here right now (not sales)? A rising rental-DOM trend means longer vacancies and softer asking-rent achievability than the comps imply.
- What's the recent tenant-quality profile in this submarket — average credit score on applications, eviction rate, late-payment / NSF rate, and stable-employment percentage? A property-management company in the area should have these aggregated.
- How much new apartment / multifamily construction is in the pipeline within 1–3 miles? Heavy new supply (>2% of stock underway) typically softens rents 12–24 months out; light construction supports rent growth.
Investment metrics
- 1% rule
- 1.02% ✓
- Cap rate
- 7.62%
- Cash-on-cash
- 4.75%
- DSCR
- 1.21
- GRM
- 8.2
CMA / ARV
- ARV (on-the-fly)
- $604,032
- Comps found
- 3
Show comp detail 3 sales within ~0.75 mi
| Address | Dist | Beds/Ba | Sqft | Sold | Price | $/sf | Match |
|---|---|---|---|---|---|---|---|
| 72 Glen Eagle Dr | 0.22mi | 6/4.5 | 3,432 (0%) | 2mo | $615,000 | $179 | 88 |
| 84 Glen Eagle Dr | 0.22mi | 6/4.5 | 3,432 (0%) | 3mo | $515,000 | $150 | 87 |
| 33 Glen Eagle Dr | 0.19mi | 6/4.5 | 3,328 (-3%) | 10mo | $585,000 | $176 | 78 |
Match score weights: distance 35% · size 25% · config 20% · recency 20%. Top-matched comps best support the ARV.
Projected returns pro-forma
-3.0% appreciation · 5.41% rent growth · sell at horizon
- IRR
- -6.2%
- Equity multiple
- 0.76×
- Total profit
- $-35,244
- Equity at exit
- $79,770
- IRR
- 6.2%
- Equity multiple
- 1.51×
- Total profit
- $76,883
- Equity at exit
- $46,257
Cash invested: $149,800 (down + closing). Projections, not guarantees.
Landlord ↔ Tenant lean methodology
- Overall (STATE)
- 27 Tenant-Leaning
- State Connecticut
- 27 Tenant-Leaning · D+7
- County
- — inherits STATE
- City
- — inherits STATE
ZIP-level market 06010
- Rents YoY
- 5.4%
- Active inventory
- 220
- Price-to-rent
- 24.5×
Monthly cashflow live
- Estimated rent
- $5,467 medium interval (Pro) →
- Mortgage (P&I)
- −$2,806
- Tax from tax record
- −$697 /mo · $8,368/yr
- Insurance
- −$223
- HOA
- −$0
- Vacancy / Maint / Mgmt
- −$1,148
- Net cashflow
- $593
Break-even live
3-unit breakdown (identical units grouped — click to expand)
| Units | Beds | Baths | Est. rent |
|---|---|---|---|
| 3× units | 2 | 2 | $5,466 |
| #1 | 2 | 2 | $1,822 |
| #2 | 2 | 2 | $1,822 |
| #3 | 2 | 2 | $1,822 |
| Total (3 units) | $5,467 | ||
UW: 25.0% down · 7.5% · 30yr · 1.5% tax · 5.0% vac · 8.0% maint · 8.0% mgmt
Financing live
Cash to close
- Down payment
- $133,750
- Closing costs
- $16,050
- Reserves months
- —
- Total cash needed
- —
Loan-product check · same deal, 3 products live
Conventional
25% down · 7.5% · 30yr
- Down + closing
- —
- Monthly P&I
- —
- Monthly cashflow
- —
- DSCR
- —
- Eligible?
- —
Personal DTI + credit; lowest rate.
DSCR
20% down · 8.5% · 30yr
- Down + closing
- —
- Monthly P&I
- —
- Monthly cashflow
- —
- DSCR
- —
- Eligible?
- —
No personal income docs; deal must DSCR.
Hard money
10% down · 12.0% · 12mo
- Down + closing
- —
- Monthly P&I
- —
- Monthly cashflow
- —
- DSCR
- —
- Eligible?
- —
Short-term bridge; refi at stabilization.
Listing history 9 events
-
2026-06-15statusdays on market $535,000 Under Contract 9 DOM
-
2026-06-13days on market $535,000 Active 8 DOM
-
2026-06-13remarks 305-char remark
-
2026-06-13days on market $535,000 Active 7 DOM
-
2026-06-10days on market $535,000 Active 5 DOM
-
2026-06-09days on market $535,000 Active 4 DOM
-
2026-06-08days on market $535,000 Active 3 DOM
-
2026-06-07remarks 282-char remark
-
2026-06-07$535,000 Active 2 DOM
ⓘ Source: listings_history table (triggers on properties + properties_extension) + one-shot
backfill from property_details.listing_events for pre-trigger history.
Tax reassessment forecast CT · Partial reset (capped growth)
- Current annual tax
- $8,368 · $697/mo
- Projected year-2 tax
- $9,908 · $826/mo
- Expected delta
- +$1,540/yr (+$128/mo · 18.4%)
ⓘ Screening estimate from a state-policy table — verify with the county assessor before closing.
Nearby sold comps map
Loading sold comps map…
Walkable amenities ~0.75 mi
Loading nearby amenities…
Taxation est. · year 1
- Rental income
- $65,604
- − Mortgage interest
- −$29,968
- − Property taxes
- −$8,368
- − Insurance
- −$2,675
- − Repairs & maintenance
- −$5,248
- − Management
- −$5,248
- − Depreciation
- −$15,564
- Taxable loss
- −$1,468
- Est. tax savings @ 24.0%
- +$352
- After-tax cash flow
- $7,469/yr
For passive investors: Depreciation is non-cash, so a rental often shows a tax loss while cash-flowing — sheltering income. Rental losses are passive: they offset passive income freely, and up to $25,000/yr can offset ordinary (W-2) income if you actively participate and your MAGI is under $100k (phasing out to $0 by $150k); unused losses carry forward. On sale, claimed depreciation is recaptured at up to 25%, and gains may owe capital-gains tax (a 1031 exchange can defer both). Figures are a year-1 estimate at your 24.0% rate — not tax advice; consult a CPA.
Schools (NCES district)
- District
- Bristol School District
- NCES district ID
- 0900510
- Math proficiency
- 28% ▼ -10.00%
- Reading proficiency
- 44% ▼ -5.00%
- Median HH income
- $59,953
- Composite
- 32.07/100
- National rank
- #5814
- State rank
- #109 of 153 in CT
Livability — Bristol
- Score
- 81/100
- State rank
- #21
- US rank
- #1585
Category grades
Schools grade is shown separately in the Schools card above.
Census & demographics
- Census place
- Bristol, CT
- County
- Hartford County · 754,208 people
- City population
- 61,684
- Metro
- Hartford-East Hartford-Middletown, CT
- Population (ZIP)
- 61,684
- Household income
- $79,314
- Rent vs Own
- Severe rent burden
- 2172.0
Population outlook (Naugatuck Valley County) Hauer SSP2
- By 2040
- 496,846
Race, ethnicity, and origin ACS 2023
- Neighborhood character
- Majority White (65%)
- Race & ethnicity
- White 65% Hispanic / Latino 19% Two or more races 13% Black 7% Asian 5%
- Hispanic origin (detail)
- Mexican 2% Puerto Rican 13%
- Common ancestry
- Lithuanian 11% Romanian 10% Slovak 1%
- Foreign-born
- 10% · Canada
- Languages at home
- 79% English-only · Spanish 11% Other Indo-European 3% Russian/Polish/Slavic 2%
Political lean MEDSL · Naugatuck Valley
- 2024 margin
- Lean R (+7.4) · D 45.6% · R 53.0% · Other 1.4%
- All cycles
- 2024: R+7.4
Not yet ingested
- Civics
- —
Market trends
- HPI YoY
- ▼ -293.55%
- Current HPI
- 255.5419
- Rent YoY
- ▲ 5.41%
- Metro
- Hartford-East Hartford-Middletown, CT
- State GDP YoY
- ▲ 1.06%
- F500 in state
- 38
Industry mix (Fortune 500 HQ in CT)
| Industry | F500 HQs | Revenue |
|---|---|---|
| Industrial Machinery | 4 | $38B |
|
||
| Insurance | 3 | $71B |
|
||
| Financial Services | 2 | $25B |
|
||
| Transportation / Logistics | 2 | $18B |
|
||
| Healthcare | 1 | $247B |
|
||
| Telecommunications | 1 | $55B |
|
||
Price history
+189.3% since first listed4 events — show timeline
- 2026-06-05 Listed $535,000 Smart MLS
- 2005-02-03 Sold (Public Records) $283,000 Public Records
- 2002-01-09 Sold (MLS) $175,000 Smart MLS
- 2001-09-18 Listed $184,900 Smart MLS
Property tax history
+2.3%/yrLatest (2025): $8,368 · +6.0% YoY. Source: county tax records.
Cash-flow waterfall
monthlySold comps — $/sqft
last 12 mo · ≤1 miLoading sold comps…