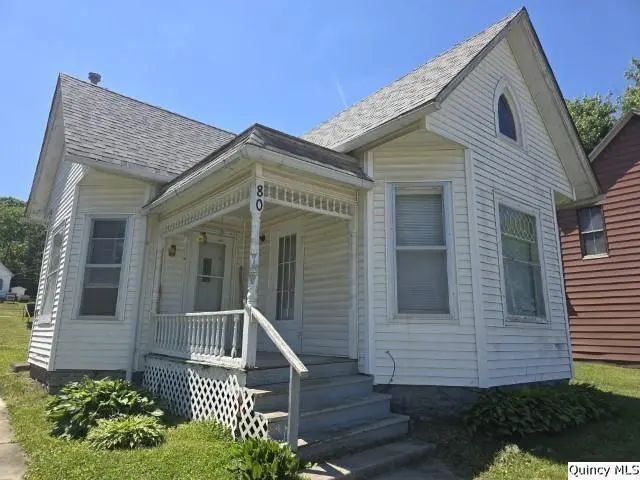
80 W 4th St · Dallas City, IL
Flood risk 1/10 · Minimal
- FEMA flood zone
- X (unshaded)
- Chance of flooding over 30 yrs
- 0.0%
- Est. flood insurance / yr
- $473 – $860
Fire risk 1/10 · Minimal
- Est. fire insurance / yr
- $804 – $1,492
Heat risk 3/10 · Minor
- Hot days now (above 106°F)
- 7 days/yr
- Hot days in 30 yrs
- 16 days/yr
Wind risk 2/10 · Minimal
- Chance of severe wind over 30 yrs
- —
Air-quality risk 2/10 · Minimal
- Unhealthy air days now
- 0 days/yr
- Unhealthy air days in 30 yrs
- 1 days/yr
Risk factors via First Street. Map © Google.
Why this score? — see what drove the A- grade
The composite is a weighted blend of 9 inputs, each scored 0–100. Each bar is that input's sub-score; the figure is the points it added to the 100-point composite (weight × sub-score).
- Cash flow +30.0/30.0
- ARV discount +15.0/15.0
- 1% rule +10.0/10.0
- DSCR +10.0/10.0
- Appreciation +5.2/10.0
- Livability +3.3/5.0
- Rent growth +2.5/5.0
- Schools +2.5/10.0
- Condition / age +2.2/5.0
$49,900
🖨 Deal sheet (PDF) 📄 Offer letter ✓ Due diligence
Listing remarks
Take a look at this adorable 2 bedroom home with 1 full bath! This would make a great rental investment or a starter home! It offers a nice sized living room, dining room, 2 bedrooms, kitchen with wood cabinetry, and 1 full bath. There is a partial/unfinished basement. Enjoy the outside air on the open front porch or the back covered patio. There is a one car detached garage just east of the house and a larger garage on the back of the lot (needs some renovations). Interior offers some original woodwork and pocket doors. The back yard is fenced in and great for having a pet!
Key facts
- Pocket doors
- Open front porch
- Fenced in back yard
Tags
Property features AI
Finance
- Other: Possession: Tenant's rights
Exterior
- Parking: Detached garage (1 garage space, 1 total parking space)
- Utilities: Public water
- Home design: Detached single-family home; One-story
- Construction: Vinyl siding; Asphalt roof; Partial unfinished basement
- Exterior features: Front porch; Fenced yard; Lot roughly 50 x 120
Interior
- Kitchen: Kitchen on main level (11 x 12)
- Bedrooms: Two bedrooms on the main level (12 x 10 and 9 x 10)
- Flooring: Carpet in living room and bedrooms; Vinyl in kitchen and dining room
- Bathrooms: One full bathroom
- Heating & cooling: Natural gas heating
- Interior features: Ceiling fan(s); Unfinished partial basement
- Laundry & utility: Electric water heater
Neighborhood map
What this means for you Summary
Snapshot
- This is a 2-bed/1.0-bath single-family listed at $50k. Condition is rated fair.
Deal economics
- At list price, monthly cash flow is $331 ($4k/yr) — positive.
- The deal already cash-flows at list — no discount required.
- Meets the 1% rule at list price ($855 rent vs $50k).
- Recommended offer: $49k (1.5% below list) — sets the bar for market timing.
Location & tenants
- Location reads 66/100 on livability (#549 in IL) — a middle-class / working-renter tenant base. Strengths: crime A+, cost of living A+, housing A+; Watch: health & safety C-, employment D+, amenities F.
- Illini West H S District 307 (town): math 25% / reading 25% proficiency, ranked #611 of 919 in IL (top 66%) — low school quality limits family demand, transient renter base, plan for 1-2y turnover.
- Zoned schools: Dallas City Elem School (math 12% / reading 17%, grade F, #1,278 of 2,056 statewide, top 65%, 169 students, 0% FRL); Illini West High School (math 17% / reading 27%, grade F, #319 of 693 statewide, top 50%, 342 students, 0% FRL).
- Market conditions: 19 active listings in the ZIP.
Forward outlook
- In year one you build about $534 of equity ($345 loan paydown + $189 appreciation (0.4% local appreciation)).
- Hancock County population projected at -30% by 2050 — secular population decline; favor cash flow + early exit over multi-decade hold.
- At projected returns (0.4% appreciation + 3.0% rent growth), your $14k cash investment doubles in ~3 years — after that, you're playing with house money.
Negotiation context
- It's been on market 17 days — a 2% lower offer ($49k) is reasonable based on typical stale-listing flexibility.
Risks & watch-outs
- Watch-outs: built in 1917 — expect roof / HVAC / electrical / plumbing capex.
Questions for the listing agent
- Have any recent inspections been done? Can we get a copy of the seller's disclosures and any deferred-maintenance estimates?
- Built in 1917 — when were the roof, HVAC, electrical panel, plumbing, and water heater last replaced?
- Is there a deadline driving the sale (1031 exchange, divorce, estate, relocation)? That informs how much negotiation room exists.
- Schools are F-rated, which usually means shorter tenancies and higher turnover. Who's the typical renter profile here, and what's been the actual vacancy rate?
- What's the average days-on-market for RENTAL listings here right now (not sales)? A rising rental-DOM trend means longer vacancies and softer asking-rent achievability than the comps imply.
- What's the recent tenant-quality profile in this submarket — average credit score on applications, eviction rate, late-payment / NSF rate, and stable-employment percentage? A property-management company in the area should have these aggregated.
- How much new for-sale + rental construction is in the pipeline within 1–3 miles? Heavy new supply typically softens prices + rents 12–24 months out; constrained supply supports both.
Investment metrics
- 1% rule
- 1.71% ✓
- Cap rate
- 14.25%
- Cash-on-cash
- 28.42%
- DSCR
- 2.26
- GRM
- 4.9
CMA / ARV
- ARV (on-the-fly)
- $74,700
- Comps found
- 1
Show comp detail 1 sale within ~0.75 mi
| Address | Dist | Beds/Ba | Sqft | Sold | Price | $/sf | Match |
|---|---|---|---|---|---|---|---|
| 489 E 3rd St | 0.51mi | 2/1.0 | 1,013 (+13%) | 19mo | $84,500 | $83 | 40 |
Match score weights: distance 35% · size 25% · config 20% · recency 20%. Top-matched comps best support the ARV.
Projected returns pro-forma
0.38% appreciation · 3.0% rent growth · sell at horizon
- IRR
- 29.6%
- Equity multiple
- 2.47×
- Total profit
- $20,527
- Equity at exit
- $15,442
- IRR
- 32.8%
- Equity multiple
- 4.77×
- Total profit
- $52,644
- Equity at exit
- $19,341
Cash invested: $13,972 (down + closing). Projections, not guarantees.
Landlord ↔ Tenant lean methodology
- Overall (STATE)
- 43 Moderately Tenant-Leaning
- State Illinois
- 43 Moderately Tenant-Leaning · D+7
- County
- — inherits STATE
- City
- — inherits STATE
ZIP-level market 62330
- Home prices YoY
- 0.3%
- Active inventory
- 19
- Price-to-rent
- 4.9×
Monthly cashflow live
- Estimated rent
- $855 medium interval (Pro) →
- Mortgage (P&I)
- −$262
- Tax est. 1.5%
- −$62 /mo · $748/yr
- Insurance
- −$21
- HOA
- −$0
- Lot rent
- −$0
- Vacancy / Maint / Mgmt
- −$180
- Net cashflow
- $331
Break-even live
Sensitivity live
| Price | -10% $365 | -5% $348 | +0% $331 | +5% $314 | +10% $296 |
|---|---|---|---|---|---|
| Rent | -10% $263 | -5% $297 | +0% $331 | +5% $365 | +10% $399 |
| Rate | -1.0pp $356 | -0.5pp $344 | base $331 | +0.5pp $318 | +1.0pp $305 |
UW: 25.0% down · 7.5% · 30yr · 1.5% tax · 5.0% vac · 8.0% maint · 8.0% mgmt
Financing live
Cash to close
- Down payment
- $12,475
- Closing costs
- $1,497
- Reserves months
- —
- Total cash needed
- —
Loan-product check · same deal, 3 products live
Conventional
25% down · 7.5% · 30yr
- Down + closing
- —
- Monthly P&I
- —
- Monthly cashflow
- —
- DSCR
- —
- Eligible?
- —
Personal DTI + credit; lowest rate.
DSCR
20% down · 8.5% · 30yr
- Down + closing
- —
- Monthly P&I
- —
- Monthly cashflow
- —
- DSCR
- —
- Eligible?
- —
No personal income docs; deal must DSCR.
Hard money
10% down · 12.0% · 12mo
- Down + closing
- —
- Monthly P&I
- —
- Monthly cashflow
- —
- DSCR
- —
- Eligible?
- —
Short-term bridge; refi at stabilization.
Listing history 15 events
-
2026-06-22days on market $49,900 Active 17 DOM
-
2026-06-21days on market $49,900 Active 16 DOM
-
2026-06-21days on market $49,900 Active 15 DOM
-
2026-06-19days on market $49,900 Active 14 DOM
-
2026-06-18days on market $49,900 Active 13 DOM
-
2026-06-17days on market $49,900 Active 12 DOM
-
2026-06-16days on market $49,900 Active 11 DOM
-
2026-06-15days on market $49,900 Active 10 DOM
-
2026-06-13days on market $49,900 Active 8 DOM
-
2026-06-12days on market $49,900 Active 7 DOM
-
2026-06-09days on market $49,900 Active 4 DOM
-
2026-06-08days on market $49,900 Active 3 DOM
-
2026-06-07days on market $49,900 Active 2 DOM
-
2026-06-07remarks 583-char remark
-
2026-06-07$49,900 Active 1 DOM
ⓘ Source: listings_history table (triggers on properties + properties_extension) + one-shot
backfill from property_details.listing_events for pre-trigger history.
Climate risk First Street
- Flood 1/10 Low FEMA zone X (unshaded) · 0% chance over 30 yrs
- Wildfire 1/10 Low
- Heat 3/10 Moderate 7 d/yr ≥106°F today · 16 d/yr by 30 yrs out
- Wind 2/10 Low
- Air quality 2/10 Low 0 unhealthy d/yr today · 1 by 30 yrs out
Nearby sold comps map
Loading sold comps map…
Walkable amenities ~0.75 mi
Loading nearby amenities…
Taxation est. · year 1
- Rental income
- $10,265
- − Mortgage interest
- −$2,795
- − Property taxes
- −$748
- − Insurance
- −$250
- − Repairs & maintenance
- −$821
- − Management
- −$821
- − Depreciation
- −$1,452
- Taxable income
- $3,378
- Est. tax owed @ 24.0%
- −$811
- After-tax cash flow
- $3,161/yr
For passive investors: Depreciation is non-cash, so a rental often shows a tax loss while cash-flowing — sheltering income. Rental losses are passive: they offset passive income freely, and up to $25,000/yr can offset ordinary (W-2) income if you actively participate and your MAGI is under $100k (phasing out to $0 by $150k); unused losses carry forward. On sale, claimed depreciation is recaptured at up to 25%, and gains may owe capital-gains tax (a 1031 exchange can defer both). Figures are a year-1 estimate at your 24.0% rate — not tax advice; consult a CPA.
Condition & rehab AI · 13 photos
This 2-bedroom home requires moderate renovations to improve its condition and appeal. Painting, updating the kitchen, and landscaping can significantly enhance its resale and rental value.
Repairs flagged
- Moderate Kitchen cabinets — Worn and outdated appearance
- Moderate Bathroom fixtures — Dated and small size
- Minor Front porch — Some discoloration on siding
Value-add opportunities
- Resale Painting and updating kitchen cabinets — Fresh paint and updated cabinets can significantly improve curb appeal and interior aesthetics
- Both Landscaping and curb appeal improvements — Enhances the home's exterior and can attract more potential buyers or renters
- Resale Upgrading bathroom fixtures — Modernizing the bathroom can increase the home's value and appeal to a broader range of buyers
Renovation cost estimate screening
| Repair item | Severity | Est. cost |
|---|---|---|
| Kitchen cabinets · Worn and outdated appearance | Moderate | $3,000–15,000 |
| Bathroom fixtures · Dated and small size | Moderate | $3,000–15,000 |
| Front porch · Some discoloration on siding | Minor | $500–3,000 |
| Total estimated repair cost · 3 items | $6,500–33,000 |
Value-add ROI direction
- Resale Painting and updating kitchen cabinets — Fresh paint and updated cabinets can significantly improve curb appeal and interior aesthetics ↑
- Both Landscaping and curb appeal improvements — Enhances the home's exterior and can attract more potential buyers or renters ↑
- Resale Upgrading bathroom fixtures — Modernizing the bathroom can increase the home's value and appeal to a broader range of buyers ↑
ⓘ Cost ranges are severity-bucket heuristics (US national rule-of-thumb). Get contractor quotes + a written scope before underwriting a rehab budget.
Schools (NCES district)
- District
- Illini West H S District 307
- NCES district ID
- 1701384
- Math proficiency
- 25% ▲ 5.00%
- Reading proficiency
- 25% ▲ 5.00%
- Median HH income
- $47,745
- Composite
- 24.88/100
- National rank
- #12997
- State rank
- #611 of 919 in IL
Livability — Dallas City
- Score
- 66/100
- State rank
- #549
- US rank
- #11621
Category grades
Schools grade is shown separately in the Schools card above.
Census & demographics
- Census place
- Dallas City, IL
- Population (ZIP)
- 1,548
Population outlook (Hancock County) Hauer SSP2
- Today (2025)
- 17,042 people
- By 2030
- 16,056 · -5.8%
- By 2040
- 13,912 · -18.4%
- By 2050
- 11,879 · -30.3%
- By 2075
- 8,302 · -51.3%
- By 2100
- 5,846 · -65.7%
Race, ethnicity, and origin ACS 2023
- Neighborhood character
- Predominantly White (93%)
- Race & ethnicity
- White 93% Hispanic / Latino 6% Two or more races 3%
- Hispanic origin (detail)
- Mexican 5%
- Common ancestry
- Lithuanian 4% Italian 2% Iranian 1%
- Foreign-born
- 2% · Canada
- Languages at home
- 95% English-only · Spanish 4%
Political lean MEDSL · Hancock
- 2024 margin
- Solid R (+50.0) · D 24.1% · R 74.1% · Other 1.8%
- 2008→2024 swing
- -39.2pp toward R · 2008: -10.8pp · 2024: -50.0pp
- All cycles
- 2024: R+50.0 2020: R+48.9 2016: R+50.8 2012: R+19.0 2008: R+10.8
Not yet ingested
- Civics
- —
Market trends
- HPI YoY
- ▲ 0.38%
- Current HPI
- 133.3962
- Rent YoY
- —
- Metro
- —
- State GDP YoY
- ▲ 1.59%
- F500 in state
- 60
Industry mix (Fortune 500 HQ in IL)
| Industry | F500 HQs | Revenue |
|---|---|---|
| Insurance | 4 | $201B |
|
||
| Consumer Goods | 4 | $87B |
|
||
| Industrial Machinery | 3 | $64B |
|
||
| Healthcare | 2 | $55B |
|
||
| Retail / Pharmacy | 1 | $148B |
|
||
| Agriculture / Food | 1 | $86B |
|
||
Price history
1 event — show timeline
- 2026-06-05 Listed $49,900 MRED as Distributed by MLS Grid
Cash-flow waterfall
monthlySold comps — $/sqft
last 12 mo · ≤1 miLoading sold comps…