135 Ash Dr · Emerald Lakes, PA
Flood risk 1/10 · Minimal
- FEMA flood zone
- X (unshaded)
- Chance of flooding over 30 yrs
- 0.0%
- Est. flood insurance / yr
- $507 – $1,088
Fire risk 3/10 · Minor
- Est. fire insurance / yr
- $511 – $949
Heat risk 2/10 · Minimal
- Hot days now (above 90°F)
- 7 days/yr
- Hot days in 30 yrs
- 15 days/yr
Wind risk 4/10 · Minor
- Chance of severe wind over 30 yrs
- 7.0%
Air-quality risk 2/10 · Minimal
- Unhealthy air days now
- 1 days/yr
- Unhealthy air days in 30 yrs
- 2 days/yr
Risk factors via First Street. Map © Google.
Why this score? — see what drove the B+ grade
The composite is a weighted blend of 9 inputs, each scored 0–100. Each bar is that input's sub-score; the figure is the points it added to the 100-point composite (weight × sub-score).
- Cash flow +27.7/30.0
- ARV discount +15.0/15.0
- DSCR +9.7/10.0
- 1% rule +8.3/10.0
- Appreciation +4.5/10.0
- Schools +4.0/10.0
- Livability +3.4/5.0
- Rent growth +2.5/5.0
- Condition / age +2.5/5.0
$199,000
🖨 Deal sheet 📄 Offer letter ✓ Due diligence
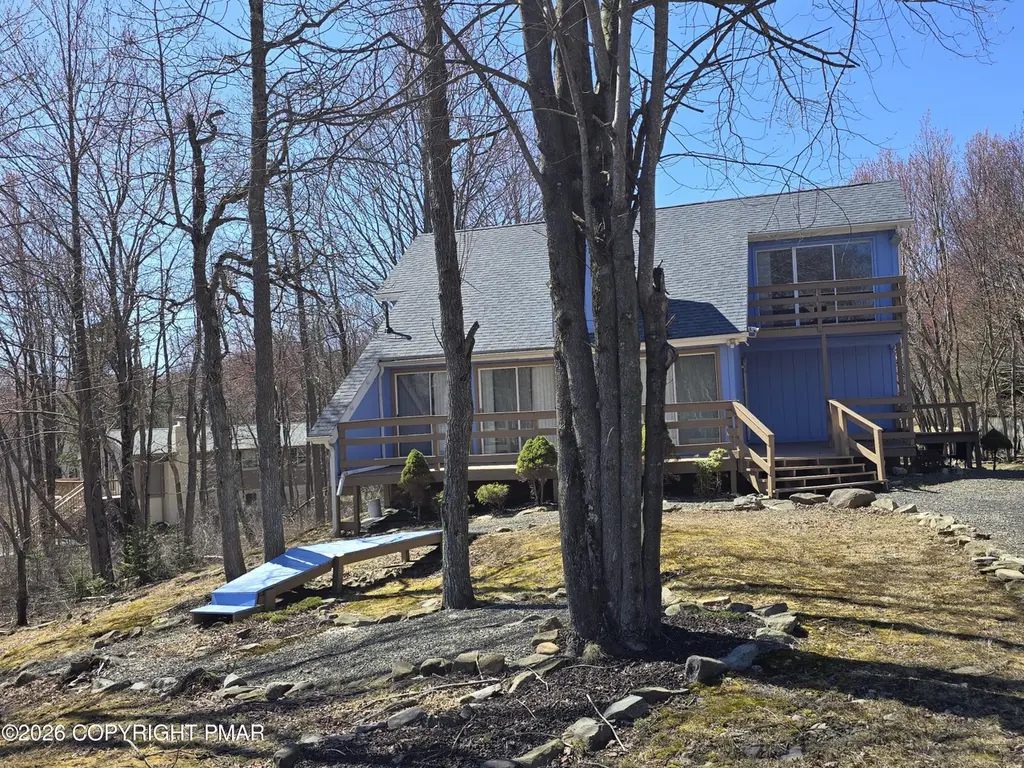
Listing remarks
Built in 1973, this 4-bedroom, 2-bath home sits on a spacious half-acre lot and offers incredible potential. Located just minutes from Kalahari Resort, Pocono Raceway, and many of the region's top attractions, it's an ideal opportunity for year-round living, a vacation getaway, or an Airbnb investment. The home does need work and is being sold AS-IS, giving the next owner the chance to bring their vision to life. Roof is approximately 4 years old.
Key facts
- 0.55 acre lot
- 4 parking spots
- Community pool
Neighborhood map
What this means for you Summary
Snapshot
- This is a 4-bed/2.0-bath single-family listed at $199k.
Deal economics
- At list price, monthly cash flow is $598 ($7k/yr) — positive.
- The deal already cash-flows at list — no discount required.
- Meets the 1% rule at list price ($3k rent vs $199k).
- Cap rate 9.9% vs local median 4.0% in Emerald Lakes — top-decile yield for the area; either an underpriced asset or a hidden risk that comps aren't pricing in. Stress-test before assuming the spread holds.
Location & tenants
- Location reads 67/100 on livability (#974 in PA) — a middle-class / working-renter tenant base. Strengths: crime A+, cost of living A+, housing A+; Watch: health & safety D, schools D-, amenities F.
- Pocono Mountain SD (rural): math 37% / reading 55% proficiency, ranked #245 of 539 in PA (top 46%) — families likely to look elsewhere, expect single-tenant / working-renter base with shorter leases.
- Market conditions: 107 active listings in the ZIP; 278 units permitted in Monroe County in 2024 (52 in 5+ unit buildings).
Forward outlook
- Local home prices are declining (-0.9%/yr); year-one equity from $1k of loan paydown is wiped out by about $2k of value loss. Plan a longer hold.
- Monroe County population projected at -11% by 2050 — secular population decline; favor cash flow + early exit over multi-decade hold.
- At projected returns (-0.9% appreciation + 3.0% rent growth), your $56k cash investment doubles in ~7 years — after that, you're playing with house money.
Negotiation context
- Only 6 days on market — expect competitive offers; lowballing is unlikely to land.
- Current owner paid $116k; list at $199k implies a 72% gain — meaningful room to come down on a strong offer.
Questions for the listing agent
- Built in 1973 — when were the roof, HVAC, electrical panel, plumbing, and water heater last replaced?
- What does the HOA fee cover, when was the last increase, and are there any pending special assessments or reserve-fund shortfalls?
- Is there a deadline driving the sale (1031 exchange, divorce, estate, relocation)? That informs how much negotiation room exists.
- Schools are D-rated, which usually means shorter tenancies and higher turnover. Who's the typical renter profile here, and what's been the actual vacancy rate?
- What's the average days-on-market for RENTAL listings here right now (not sales)? A rising rental-DOM trend means longer vacancies and softer asking-rent achievability than the comps imply.
- What's the recent tenant-quality profile in this submarket — average credit score on applications, eviction rate, late-payment / NSF rate, and stable-employment percentage? A property-management company in the area should have these aggregated.
- How much new for-sale + rental construction is in the pipeline within 1–3 miles? Heavy new supply typically softens prices + rents 12–24 months out; constrained supply supports both.
Investment metrics
- 1% rule
- 1.33% ✓
- Cap rate
- 9.90%
- Cash-on-cash
- 12.89%
- DSCR
- 1.57
- GRM
- 6.3
CMA / ARV
- ARV (on-the-fly)
- $377,952
- Comps found
- 12
Show comp detail 12 sales within ~0.75 mi
| Address | Dist | Beds/Ba | Sqft | Sold | Price | $/sf | Match |
|---|---|---|---|---|---|---|---|
| 135 Ash Dr | 0.00mi | 4/2.0 | 1,488 (0%) | 1mo | $205,000 | $138 | 99 |
| 1138 Horizon Dr | 0.28mi | 4/2.0 | 1,591 (+7%) | 1mo | $435,000 | $273 | 75 |
| 1109 Bob Cat Ct | 0.27mi | 3/2.0 (-1) | 1,421 (-4%) | 9mo | $301,500 | $212 | 68 |
| 703 Clearview Dr | 0.16mi | 3/2.0 (-1) | 1,380 (-7%) | 17mo | $275,000 | $199 | 61 |
| 112 N Glade Ct | 0.69mi | 3/2.0 (-1) | 1,501 (+1%) | 7mo | $593,000 | $395 | 56 |
| 1110 Horizon Dr | 0.26mi | 4/2.0 | 1,632 (+10%) | 20mo | $415,000 | $254 | 56 |
| 237 Ash Drive Dr | 0.48mi | 3/2.0 (-1) | 1,356 (-9%) | 7mo | $385,000 | $284 | 52 |
| 394 Cedar Dr | 0.48mi | 3/2.0 (-1) | 1,632 (+10%) | 16mo | $275,000 | $169 | 43 |
| 1311 Hilltop Dr | 0.73mi | 3/2.0 (-1) | 1,536 (+3%) | 17mo | $398,000 | $259 | 41 |
| 181 Cedar Dr | 0.70mi | 3/1.5 (-1) | 1,320 (-11%) | 3mo | $173,000 | $131 | 39 |
| 111 Beaver Dam Rd | 0.54mi | 3/2.5 (-1) | 1,696 (+14%) | 9mo | $760,000 | $448 | 37 |
| 249 Clearview Dr | 0.74mi | 3/2.0 (-1) | 1,344 (-10%) | 11mo | $325,000 | $242 | 35 |
Match score weights: distance 35% · size 25% · config 20% · recency 20%. Top-matched comps best support the ARV.
Projected returns pro-forma
-0.95% appreciation · 3.0% rent growth · sell at horizon
- IRR
- 9.4%
- Equity multiple
- 1.43×
- Total profit
- $23,706
- Equity at exit
- $48,535
- IRR
- 15.6%
- Equity multiple
- 2.56×
- Total profit
- $86,867
- Equity at exit
- $51,391
Cash invested: $55,720 (down + closing). Projections, not guarantees.
Landlord ↔ Tenant lean methodology
- Overall (STATE)
- 62 Landlord-Friendly
- State Pennsylvania
- 62 Landlord-Friendly · EVEN
- County
- — inherits STATE
- City
- — inherits STATE
ZIP-level market 18334
- Home prices YoY
- -0.5%
- Active inventory
- 107
- Price-to-rent
- 6.3×
Monthly cashflow live
- Estimated rent
- $2,649 medium interval (Pro) →
- Mortgage (P&I)
- −$1,044
- Tax from tax record
- −$268 /mo · $3,218/yr
- Insurance
- −$83
- HOA
- −$100
- Vacancy / Maint / Mgmt
- −$556
- Net cashflow
- $598
Break-even live
UW: 25.0% down · 7.5% · 30yr · 1.5% tax · 5.0% vac · 8.0% maint · 8.0% mgmt
Financing live
Cash to close
- Down payment
- $49,750
- Closing costs
- $5,970
- Reserves months
- —
- Total cash needed
- —
Loan-product check · same deal, 3 products live
Conventional
25% down · 7.5% · 30yr
- Down + closing
- —
- Monthly P&I
- —
- Monthly cashflow
- —
- DSCR
- —
- Eligible?
- —
Personal DTI + credit; lowest rate.
DSCR
20% down · 8.5% · 30yr
- Down + closing
- —
- Monthly P&I
- —
- Monthly cashflow
- —
- DSCR
- —
- Eligible?
- —
No personal income docs; deal must DSCR.
Hard money
10% down · 12.0% · 12mo
- Down + closing
- —
- Monthly P&I
- —
- Monthly cashflow
- —
- DSCR
- —
- Eligible?
- —
Short-term bridge; refi at stabilization.
HOA detail
- Monthly dues
- $100 · $1,200/yr
Listing history 4 events
-
2026-04-22status Pending
-
2026-04-16$199,000 Active
-
2002-11-04soldstatus $116,000
-
1998-08-17soldstatus $72,000
ⓘ Source: listings_history table (triggers on properties + properties_extension) + one-shot
backfill from property_details.listing_events for pre-trigger history.
Tax reassessment forecast PA · Partial reset (capped growth)
- Current annual tax
- $3,218 · $268/mo
- Projected year-2 tax
- $3,218 · $268/mo
- Expected delta
- $0/yr ($0/mo · 0.0%)
ⓘ Screening estimate from a state-policy table — verify with the county assessor before closing.
Climate risk First Street
- Flood 1/10 Low FEMA zone X (unshaded) · 0% chance over 30 yrs
- Wildfire 3/10 Moderate
- Heat 2/10 Low 7 d/yr ≥90°F today · 15 d/yr by 30 yrs out
- Wind 4/10 Moderate 7% chance of damaging wind over 30 yrs
- Air quality 2/10 Low 1 unhealthy d/yr today · 2 by 30 yrs out
Nearby sold comps map
Loading sold comps map…
Walkable amenities ~0.75 mi
Loading nearby amenities…
Taxation est. · year 1
- Rental income
- $31,792
- − Mortgage interest
- −$11,147
- − Property taxes
- −$3,218
- − Insurance
- −$995
- − Repairs & maintenance
- −$2,543
- − Management
- −$2,543
- − HOA
- −$1,200
- − Depreciation
- −$5,789
- Taxable income
- $4,356
- Est. tax owed @ 24.0%
- −$1,046
- After-tax cash flow
- $6,134/yr
For passive investors: Depreciation is non-cash, so a rental often shows a tax loss while cash-flowing — sheltering income. Rental losses are passive: they offset passive income freely, and up to $25,000/yr can offset ordinary (W-2) income if you actively participate and your MAGI is under $100k (phasing out to $0 by $150k); unused losses carry forward. On sale, claimed depreciation is recaptured at up to 25%, and gains may owe capital-gains tax (a 1031 exchange can defer both). Figures are a year-1 estimate at your 24.0% rate — not tax advice; consult a CPA.
Schools (NCES district)
- District
- Pocono Mountain SD
- NCES district ID
- 4219500
- Math proficiency
- 37% ▼ -5.00%
- Reading proficiency
- 55% ▲ 1.00%
- Median HH income
- $55,317
- Composite
- 39.91/100
- National rank
- #3856
- State rank
- #245 of 539 in PA
Livability — Emerald Lakes
- Score
- 67/100
- State rank
- #974
- US rank
- #10662
Category grades
Schools grade is shown separately in the Schools card above.
Census & demographics
- Census place
- Emerald Lakes, PA
- Population (ZIP)
- 4,907
Population outlook (Monroe County) Hauer SSP2
- Today (2025)
- 164,099 people
- By 2030
- 161,412 · -1.6%
- By 2040
- 154,616 · -5.8%
- By 2050
- 146,710 · -10.6%
- By 2075
- 140,830 · -14.2%
- By 2100
- 138,472 · -15.6%
Race, ethnicity, and origin ACS 2023
- Neighborhood character
- Majority White (64%)
- Race & ethnicity
- White 64% Hispanic / Latino 20% Two or more races 12% Black 9%
- Hispanic origin (detail)
- Puerto Rican 17%
- Common ancestry
- Romanian 6% Lithuanian 4% Iranian 4%
- Foreign-born
- 8% · Canada
- Languages at home
- 87% English-only · Spanish 10% Russian/Polish/Slavic 3%
Political lean MEDSL · Monroe
- 2024 margin
- Toss-up / Even · D 49.1% · R 49.9%
- 2008→2024 swing
- -17.1pp toward R · 2008: 16.3pp · 2024: -0.8pp
- All cycles
- 2024: R+0.8 2020: D+6.4 2016: D+0.3 2012: D+14.0 2008: D+16.3
Not yet ingested
- Civics
- —
Market trends
- HPI YoY
- ▼ -0.95%
- Current HPI
- 178.5307
- Rent YoY
- —
- Metro
- —
- State GDP YoY
- ▲ 1.68%
- F500 in state
- 34
Industry mix (Fortune 500 HQ in PA)
| Industry | F500 HQs | Revenue |
|---|---|---|
| Healthcare | 2 | $309B |
|
||
| Insurance | 2 | $27B |
|
||
| Telecommunications / Media | 1 | $124B |
|
||
| Industrial Distribution | 1 | $22B |
|
||
| Financial Services | 1 | $20B |
|
||
| Chemicals / Materials | 1 | $18B |
|
||
Price history
+176.4% since first listed4 events — show timeline
- 2026-04-22 Pending — PMAR
- 2026-04-16 Listed $199,000 PMAR
- 2002-11-04 Sold (Public Records) $116,000 Public Records
- 1998-08-17 Sold (Public Records) $72,000 Public Records
Property tax history
-1.4%/yrLatest (2026): $3,218 · +3.3% YoY. Source: county tax records.
Cash-flow waterfall
monthlySold comps — $/sqft
last 12 mo · ≤1 miLoading sold comps…