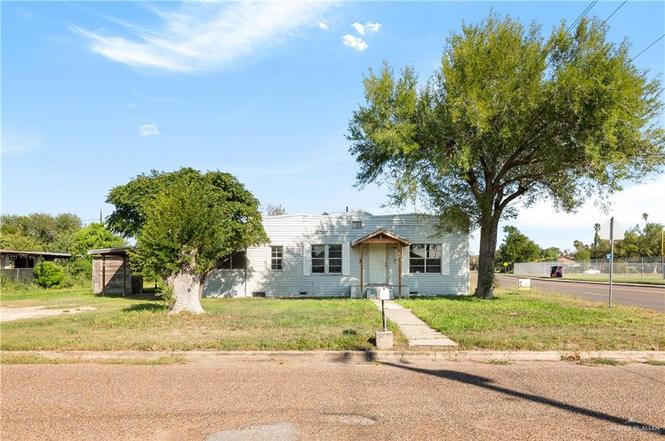
1600 Oblate Ave · Mission, TX
Flood risk 4/10 · Minor
- FEMA flood zone
- X (shaded)
- Chance of flooding over 30 yrs
- 0.22%
- Est. flood insurance / yr
- $507 – $1,088
Fire risk 1/10 · Minimal
- Est. fire insurance / yr
- $1,222 – $2,270
Heat risk 9/10 · Severe
- Hot days now (above 111°F)
- 7 days/yr
- Hot days in 30 yrs
- 21 days/yr
Wind risk 8/10 · Major
- Chance of severe wind over 30 yrs
- 96.0%
Air-quality risk 2/10 · Minimal
- Unhealthy air days now
- 1 days/yr
- Unhealthy air days in 30 yrs
- 2 days/yr
Risk factors via First Street. Map © Google.
Why this score? — see what drove the C- grade
The composite is a weighted blend of 9 inputs, each scored 0–100. Each bar is that input's sub-score; the figure is the points it added to the 100-point composite (weight × sub-score).
- Cash flow +17.1/30.0
- ARV discount +15.0/15.0
- 1% rule +5.6/10.0
- DSCR +5.3/10.0
- Livability +3.8/5.0
- Rent growth +2.7/5.0
- Condition / age +2.5/5.0
- Schools +1.7/10.0
- Appreciation +0.0/10.0
$145,000
🖨 Deal sheet (PDF) 📄 Offer letter ✓ Due diligence
Listing remarks
Investors Welcomed to 1600 Oblate Ave, Mission, TX on . 34 acre and corner lot. This is a two-unit home. Unit A features 3 bedrooms, walk-in shower, kitchen, spacious living room area, bonus room and plenty of cabinets for storage. Unit B features 1 bedroom with closet, kitchen and walk-in shower. Both units come with stove and refrigerator. Property comes with an exterior storage unit.
Key facts
- Two-unit home
- Walk-in shower
- Corner lot
Tags
Neighborhood map
What this means for you Summary
Snapshot
- This is a 3-bed/2.0-bath single-family listed at $145k.
Deal economics
- At list price, monthly cash flow is $101 ($1k/yr) — positive.
- The deal already cash-flows at list — no discount required.
- Meets the 1% rule at list price ($2k rent vs $145k).
- Recommended offer: $141k (3.0% below list) — sets the bar for market timing.
- Cap rate 7.1% vs local median 3.5% in Mission — top-decile yield for the area; either an underpriced asset or a hidden risk that comps aren't pricing in. Stress-test before assuming the spread holds.
Location & tenants
- Location reads 75/100 on livability (#148 in TX, #4,155 nationally) — a middle-class / working-renter tenant base. Strengths: cost of living A+, housing A+, health & safety A+; Watch: amenities F, commute F, employment D-.
- Mission CISD (urban): math 15% / reading 28% proficiency, ranked #775 of 826 in TX (top 94%) — low school quality limits family demand, transient renter base, plan for 1-2y turnover; 78% free/reduced lunch — lower-income household profile, screen leases tightly.
- Zoned schools: Bryan El (math 17% / reading 32%, grade F, #3,052 of 4,322 statewide, top 74%, 651 students, 71% FRL); Mission J H (math 13% / reading 26%, grade F, #1,445 of 1,662 statewide, top 88%, 680 students, 78% FRL); Veterans Memorial H S (math 19% / reading 44%, grade F, #1,073 of 1,632 statewide, top 66%, 1,932 students, 81% FRL) — zoned schools at 77% FRL track the district average.
- Market conditions: Rents flat; 852 active listings in the ZIP; 11 comparable units currently listed for rent nearby; rentals at typical pace (median 22d on market — plan ~3-4 weeks tenant-placement turnaround); 45% of comp listings sitting > 30 days — soft ceiling on asking rent; 7,378 units permitted in Hidalgo County in 2024 (641 in 5+ unit buildings).
- This rent runs 34% of the median local income ($54k/yr) — at the standard rent-burdened threshold; future hikes will face affordability resistance.
Forward outlook
- Local home prices are declining (-3.0%/yr); year-one equity from $1k of loan paydown is wiped out by about $4k of value loss. Plan a longer hold.
- Hidalgo County population projected at +28% by 2050 — long-run rental-demand tailwind backs the buy-and-hold thesis.
Negotiation context
- It's been on market 47 days — a 3% lower offer ($141k) is reasonable based on typical stale-listing flexibility.
- 3 sale attempts since 2y ago with the ask held roughly flat each time — persistent listings suggest the price (not the market) is what's stuck; bring a comps-based counter.
Risks & watch-outs
- Climate carrying-cost: severe wind risk, 96% chance of damaging wind over 30y; extreme-heat days projected 7→21/yr by 2055 (HVAC capex compounding) — expect insurance premiums to compound above CPI over the hold.
Questions for the listing agent
- It's been on market 47 days. Have you received any prior offers? Is the seller open to a 3% concession, seller financing, or rate buy-down credit?
- Built in 1962 — when were the roof, HVAC, electrical panel, plumbing, and water heater last replaced?
- Is there a deadline driving the sale (1031 exchange, divorce, estate, relocation)? That informs how much negotiation room exists.
- What's the average days-on-market for RENTAL listings here right now (not sales)? A rising rental-DOM trend means longer vacancies and softer asking-rent achievability than the comps imply.
- What's the recent tenant-quality profile in this submarket — average credit score on applications, eviction rate, late-payment / NSF rate, and stable-employment percentage? A property-management company in the area should have these aggregated.
- How much new for-sale + rental construction is in the pipeline within 1–3 miles? Heavy new supply typically softens prices + rents 12–24 months out; constrained supply supports both.
Investment metrics
- 1% rule
- 1.06% ✓
- Cap rate
- 7.13%
- Cash-on-cash
- 2.99%
- DSCR
- 1.13
- GRM
- 7.9
CMA / ARV
- ARV (on-the-fly)
- $217,710
- Comps found
- 12
Show comp detail 12 sales within ~0.75 mi
| Address | Dist | Beds/Ba | Sqft | Sold | Price | $/sf | Match |
|---|---|---|---|---|---|---|---|
| 916 Country Club Dr | 0.49mi | 3/2.0 | 1,816 (+3%) | 2mo | $175,000 | $96 | 71 |
| 1812 Peace Ave | 0.52mi | 3/2.0 | 1,810 (+2%) | 6mo | $199,000 | $110 | 67 |
| 816 E 12th St | 0.44mi | 3/2.0 | 1,611 (-9%) | 10mo | $185,000 | $115 | 56 |
| 1018 N Keralum Ave | 0.43mi | 4/2.0 (+1) | 1,624 (-8%) | 11mo | $225,000 | $139 | 52 |
| 506 W 11th St | 0.66mi | 3/2.0 | 1,853 (+5%) | 14mo | $250,000 | $135 | 49 |
| 1102 Fairway Dr | 0.68mi | 3/2.5 | 1,886 (+7%) | 9mo | $259,900 | $138 | 48 |
| 2311 W Palm Cir | 0.66mi | 3/2.0 | 1,906 (+8%) | 16mo | $252,000 | $132 | 43 |
| 315 Stacie Ln | 0.74mi | 3/2.0 | 1,869 (+6%) | 17mo | $199,000 | $106 | 42 |
| 1205 Elm St | 0.74mi | 3/2.0 | 1,522 (-14%) | 1mo | $184,900 | $121 | 42 |
| 2401 N Mayberry Rd | 0.72mi | 3/2.0 | 1,663 (-6%) | 18mo | $205,000 | $123 | 41 |
| 403 Stacie Ln | 0.73mi | 3/2.0 | 1,708 (-4%) | 23mo | $269,500 | $158 | 40 |
| 1013 Pamela Dr | 0.62mi | 3/1.0 | 1,600 (-10%) | 14mo | $175,000 | $109 | 40 |
Match score weights: distance 35% · size 25% · config 20% · recency 20%. Top-matched comps best support the ARV.
Projected returns pro-forma
-3.0% appreciation · 0.93% rent growth · sell at horizon
- IRR
- -14.1%
- Equity multiple
- 0.51×
- Total profit
- $-20,092
- Equity at exit
- $21,620
- IRR
- -9.4%
- Equity multiple
- 0.48×
- Total profit
- $-21,157
- Equity at exit
- $12,537
Cash invested: $40,600 (down + closing). Projections, not guarantees.
Landlord ↔ Tenant lean methodology
- Overall (STATE)
- 87 Strongly Landlord-Friendly
- State Texas
- 87 Strongly Landlord-Friendly · R+5
- County
- — inherits STATE
- City
- — inherits STATE
ZIP-level market 78572
- Home prices YoY
- -22.9%
- Rents YoY
- 0.9%
- Active inventory
- 852
- Price-to-rent
- 7.9×
Monthly cashflow live
- Estimated rent
- $1,535 high interval (Pro) →
- Mortgage (P&I)
- −$760
- Tax from tax record
- −$290 /mo · $3,484/yr
- Insurance
- −$60
- HOA
- −$0
- Vacancy / Maint / Mgmt
- −$322
- Net cashflow
- $101
Break-even live
Sensitivity live
| Price | -10% $183 | -5% $142 | +0% $101 | +5% $60 | +10% $19 |
|---|---|---|---|---|---|
| Rent | -10% $-20 | -5% $41 | +0% $101 | +5% $162 | +10% $222 |
| Rate | -1.0pp $174 | -0.5pp $138 | base $101 | +0.5pp $64 | +1.0pp $25 |
UW: 25.0% down · 7.5% · 30yr · 1.5% tax · 5.0% vac · 8.0% maint · 8.0% mgmt
Financing live
Cash to close
- Down payment
- $36,250
- Closing costs
- $4,350
- Reserves months
- —
- Total cash needed
- —
Loan-product check · same deal, 3 products live
Conventional
25% down · 7.5% · 30yr
- Down + closing
- —
- Monthly P&I
- —
- Monthly cashflow
- —
- DSCR
- —
- Eligible?
- —
Personal DTI + credit; lowest rate.
DSCR
20% down · 8.5% · 30yr
- Down + closing
- —
- Monthly P&I
- —
- Monthly cashflow
- —
- DSCR
- —
- Eligible?
- —
No personal income docs; deal must DSCR.
Hard money
10% down · 12.0% · 12mo
- Down + closing
- —
- Monthly P&I
- —
- Monthly cashflow
- —
- DSCR
- —
- Eligible?
- —
Short-term bridge; refi at stabilization.
Rent comps 11 comps
| Address | Beds | Baths | Sqft | Rent | $/sqft | DOM | Units | Dist |
|---|---|---|---|---|---|---|---|---|
| 221 W 14th St Mission, TX | 3.0 | 2.0 | 1290 | $1,100 | $0.85 | 44d | 1 | 0.37mi |
| 1707 Highland Park Ave Unit 4-B Mission, TX | 2.0 | 2.0 | 1336 | $1,200 | $0.90 | 14d | 1 | 0.47mi |
| 1827 Highland Park Ave Unit 1 Mission, TX | 2.0 | 2.0 | 1300 | $1,200 | $0.92 | 44d | 1 | 0.54mi |
| 2002 Thornton St Mission, TX | 3.0 | 2.0 | 1374 | $1,300 | $0.95 | 44d | 1 | 0.64mi |
| 502 Thornwood St Mission, TX | 4.0 | 2.0 | 1260 | $1,600 | $1.27 | 14d | 1 | 0.84mi |
| 2216 Robyn Ln Mission, TX | 3.0 | 3.0 | 2033 | $2,000 | $0.98 | 21d | 1 | 0.95mi |
| 702 W 25th St Mission, TX | 3.0 | 2.0 | 1375 | $1,650 | $1.20 | 19d | 1 | 1.04mi |
| 1511 Evergreen Ave Mission, TX | 3.0 | 2.0 | 1286 | $1,300 | $1.01 | 44d | 1 | 1.14mi |
| 607 Alameda Dr Mission, TX | 3.0 | 2.5 | 1731 | $2,200 | $1.27 | 44d | 1 | 1.18mi |
| 1606 Terrace Dr Mission, TX | 4.0 | 3.0 | 2127 | $2,600 | $1.22 | 14d | 1 | 1.35mi |
| 3108 Highland Park Ave Mission, TX | 4.0 | 2.0 | 1400 | $1,800 | $1.29 | 19d | 1 | 1.43mi |
Listing history 8 events
-
2025-11-20status Pending
-
2025-10-03$145,000 Active
-
2025-05-25price $145,000
-
2025-03-11$165,000 Active
-
2024-09-27price $165,000
-
2024-08-13$175,000 Active
-
2016-05-18soldstatus
-
2007-05-10soldstatus
ⓘ Source: listings_history table (triggers on properties + properties_extension) + one-shot
backfill from property_details.listing_events for pre-trigger history.
Tax reassessment forecast TX · Resets to sale price
- Current annual tax
- $3,484 · $290/mo
- Projected year-2 tax
- $3,484 · $290/mo
- Expected delta
- $0/yr ($0/mo · 0.0%)
ⓘ Screening estimate from a state-policy table — verify with the county assessor before closing.
Climate risk First Street
- Flood 4/10 Moderate FEMA zone X (shaded) · 22% chance over 30 yrs
- Wildfire 1/10 Low
- Heat 9/10 Extreme 7 d/yr ≥111°F today · 21 d/yr by 30 yrs out
- Wind 8/10 Severe 96% chance of damaging wind over 30 yrs
- Air quality 2/10 Low 1 unhealthy d/yr today · 2 by 30 yrs out
Nearby sold comps map
Loading sold comps map…
Walkable amenities ~0.75 mi
Loading nearby amenities…
Taxation est. · year 1
- Rental income
- $18,416
- − Mortgage interest
- −$8,122
- − Property taxes
- −$3,484
- − Insurance
- −$725
- − Repairs & maintenance
- −$1,473
- − Management
- −$1,473
- − Depreciation
- −$4,218
- Taxable loss
- −$1,080
- Est. tax savings @ 24.0%
- +$259
- After-tax cash flow
- $1,474/yr
For passive investors: Depreciation is non-cash, so a rental often shows a tax loss while cash-flowing — sheltering income. Rental losses are passive: they offset passive income freely, and up to $25,000/yr can offset ordinary (W-2) income if you actively participate and your MAGI is under $100k (phasing out to $0 by $150k); unused losses carry forward. On sale, claimed depreciation is recaptured at up to 25%, and gains may owe capital-gains tax (a 1031 exchange can defer both). Figures are a year-1 estimate at your 24.0% rate — not tax advice; consult a CPA.
Schools (NCES district)
- District
- Mission CISD
- NCES district ID
- 4831040
- Math proficiency
- 15% ▼ -35.00%
- Reading proficiency
- 28% ▼ -15.00%
- Median HH income
- $32,855
- Composite
- 17.47/100
- National rank
- #9061
- State rank
- #775 of 826 in TX
Livability — Mission
- Score
- 75/100
- State rank
- #148
- US rank
- #4155
Category grades
Schools grade is shown separately in the Schools card above.
Census & demographics
- Census place
- Mission, TX
- County
- Hidalgo County · 623,128 people
- City population
- 78,024
- Metro
- McAllen-Edinburg-Mission, TX
- Population (ZIP)
- 78,024
- Household income
- $54,298
- Rent vs Own
- Severe rent burden
- 1714.0
Population outlook (Hidalgo County) Hauer SSP2
- Today (2025)
- 955,232 people
- By 2030
- 1,009,774 · +5.7%
- By 2040
- 1,120,332 · +17.3%
- By 2050
- 1,225,036 · +28.2%
- By 2075
- 1,439,189 · +50.7%
- By 2100
- 1,533,429 · +60.5%
Race, ethnicity, and origin ACS 2023
- Neighborhood character
- Predominantly Hispanic (85%)
- Race & ethnicity
- Hispanic / Latino 85% Two or more races 47% White 12% Asian 2%
- Hispanic origin (detail)
- Mexican 80%
- Common ancestry
- Slovak 1% Portuguese 0%
- Foreign-born
- 28% · Canada, South Korea
- Languages at home
- 22% English-only · Spanish 76%
Political lean MEDSL · Hidalgo
- 2024 margin
- Toss-up / Even · D 48.1% · R 51.0%
- 2008→2024 swing
- -41.6pp toward R · 2008: 38.7pp · 2024: -2.9pp
- All cycles
- 2024: R+2.9 2020: D+17.1 2016: D+40.5 2012: D+41.8 2008: D+38.7
Not yet ingested
- Civics
- —
Market trends
- HPI YoY
- ▼ -62.35%
- Current HPI
- 209.3573
- Rent YoY
- ▲ 0.93%
- Metro
- McAllen-Edinburg-Mission, TX
- State GDP YoY
- ▲ 3.95%
- F500 in state
- 110
Industry mix (Fortune 500 HQ in TX)
| Industry | F500 HQs | Revenue |
|---|---|---|
| Energy | 16 | $1,198B |
|
||
| Technology | 5 | $198B |
|
||
| Engineering / Construction | 4 | $72B |
|
||
| Energy Services | 3 | $60B |
|
||
| Utilities | 3 | $41B |
|
||
| Healthcare | 2 | $330B |
|
||
Price history
-17.1% since first listed8 events — show timeline
- 2025-11-20 Pending — MCALLENMLS
- 2025-10-03 Listed $145,000 MCALLENMLS
- 2025-05-25 Price Changed $145,000 MCALLENMLS
- 2025-03-11 Listed $165,000 MCALLENMLS
- 2024-09-27 Price Changed $165,000 MCALLENMLS
- 2024-08-13 Listed $175,000 MCALLENMLS
- 2016-05-18 Sold (Public Records) — Public Records
- 2007-05-10 Sold (Public Records) — Public Records
Property tax history
+7.0%/yrLatest (2025): $3,484 · +20.0% YoY. Source: county tax records.
Cash-flow waterfall
monthlySold comps — $/sqft
last 12 mo · ≤1 miLoading sold comps…