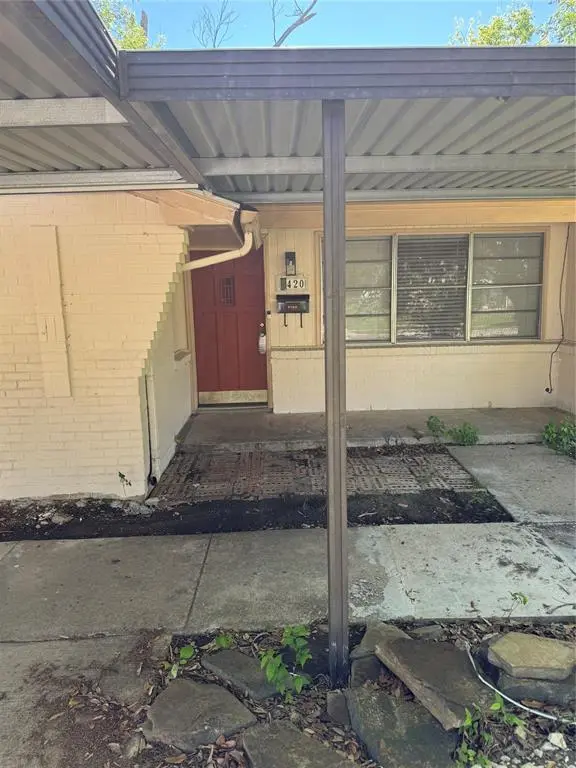
3420 Bahamas Dr · Mesquite, TX
Flood risk 1/10 · Minimal
- FEMA flood zone
- X (unshaded)
- Chance of flooding over 30 yrs
- 0.0%
- Est. flood insurance / yr
- $507 – $1,088
Fire risk 1/10 · Minimal
- Est. fire insurance / yr
- $1,222 – $2,270
Heat risk 7/10 · Major
- Hot days now (above 109°F)
- 7 days/yr
- Hot days in 30 yrs
- 24 days/yr
Wind risk 6/10 · Moderate
- Chance of severe wind over 30 yrs
- 27.0%
Air-quality risk 2/10 · Minimal
- Unhealthy air days now
- 2 days/yr
- Unhealthy air days in 30 yrs
- 2 days/yr
Risk factors via First Street. Map © Google.
Why this score? — see what drove the C grade
The composite is a weighted blend of 9 inputs, each scored 0–100. Each bar is that input's sub-score; the figure is the points it added to the 100-point composite (weight × sub-score).
- Cash flow +18.9/30.0
- ARV discount +15.0/15.0
- 1% rule +6.8/10.0
- DSCR +6.0/10.0
- Livability +3.5/5.0
- Schools +2.9/10.0
- Rent growth +2.6/5.0
- Condition / age +2.5/5.0
- Appreciation +0.0/10.0
$160,000
🖨 Deal sheet 📄 Offer letter ✓ Due diligence
Listing remarks MLS
Hud home to be sold as-is . Bid deadline: 01-28-07. Case#491-838454, general list date: 12-29-06.
Key facts
- 7,797 sq ft lot
- 2 parking spots
- Built 1961
Neighborhood map
What this means for you Summary
Snapshot
- This is a 3-bed/1.0-bath single-family listed at $160k.
Deal economics
- At list price, monthly cash flow is $164 ($2k/yr) — positive.
- The deal already cash-flows at list — no discount required.
- Meets the 1% rule at list price ($2k rent vs $160k).
- Cap rate 7.5% vs local median 4.4% in Mesquite — top-decile yield for the area; either an underpriced asset or a hidden risk that comps aren't pricing in. Stress-test before assuming the spread holds.
Location & tenants
- Location reads 70/100 on livability (#358 in TX) — a middle-class / working-renter tenant base. Strengths: cost of living A+, housing A+, health & safety A-; Watch: crime F, commute F.
- Mesquite ISD (suburban): math 35% / reading 32% proficiency, ranked #536 of 826 in TX (top 65%) — families likely to look elsewhere, expect single-tenant / working-renter base with shorter leases; 63% free/reduced lunch — lower-income household profile, screen leases tightly.
- Zoned schools: Range El (math 24% / reading 25%, grade F, #3,052 of 4,322 statewide, top 74%, 597 students, 88% FRL) — zoned schools average 88% FRL vs 63% district-wide (26 pts higher); higher-poverty schools than district average — tighter screening recommended.
- Market conditions: Rents flat; 186 active listings in the ZIP; 40 comparable units currently listed for rent nearby; rentals at typical pace (median 21d on market — plan ~3-4 weeks tenant-placement turnaround); 12,577 units permitted in Dallas County in 2024 (6,829 in 5+ unit buildings).
- This rent runs 35% of the median local income ($65k/yr) — at the standard rent-burdened threshold; future hikes will face affordability resistance.
Forward outlook
- Local home prices are declining (-3.0%/yr); year-one equity from $1k of loan paydown is wiped out by about $5k of value loss. Plan a longer hold.
- Dallas County population projected at +35% by 2050 — long-run rental-demand tailwind backs the buy-and-hold thesis.
Negotiation context
- Only 7 days on market — expect competitive offers; lowballing is unlikely to land.
- 4 sale attempts since 23y ago; this cycle's ask has dropped $10k (6%) from the opening price — seller is motivated, your offer sets the floor, not the list.
Risks & watch-outs
- Watch-outs: property tax is 3.2% of price.
- Climate carrying-cost: major wind risk, 27% chance of damaging wind over 30y; extreme-heat days projected 7→24/yr by 2055 (HVAC capex compounding) — expect insurance premiums to compound above CPI over the hold.
Questions for the listing agent
- Built in 1961 — when were the roof, HVAC, electrical panel, plumbing, and water heater last replaced?
- Property tax is high relative to price — has the assessment been appealed recently, and will the sale trigger a re-assessment?
- Is there a deadline driving the sale (1031 exchange, divorce, estate, relocation)? That informs how much negotiation room exists.
- Crime grade is F in this area — have there been break-ins, vandalism, or insurance claims at this property in the last 3 years? What carrier currently insures it and at what premium?
- What's the average days-on-market for RENTAL listings here right now (not sales)? A rising rental-DOM trend means longer vacancies and softer asking-rent achievability than the comps imply.
- What's the recent tenant-quality profile in this submarket — average credit score on applications, eviction rate, late-payment / NSF rate, and stable-employment percentage? A property-management company in the area should have these aggregated.
- How much new for-sale + rental construction is in the pipeline within 1–3 miles? Heavy new supply typically softens prices + rents 12–24 months out; constrained supply supports both.
Investment metrics
- 1% rule
- 1.18% ✓
- Cap rate
- 7.52%
- Cash-on-cash
- 4.39%
- DSCR
- 1.20
- GRM
- 7.0
CMA / ARV
- ARV (on-the-fly)
- $240,096
- Comps found
- 12
Show comp detail 12 sales within ~0.75 mi
| Address | Dist | Beds/Ba | Sqft | Sold | Price | $/sf | Match |
|---|---|---|---|---|---|---|---|
| 3420 Bahamas Dr | 0.00mi | 3/1.0 | 1,312 (0%) | 1mo | $160,000 | $122 | 99 |
| 2506 Aloha Dr | 0.26mi | 4/2.5 (+1) | 1,308 (-0%) | 4mo | $245,000 | $187 | 73 |
| 2229 Aloha Dr | 0.39mi | 3/2.0 | 1,356 (+3%) | 2mo | $234,900 | $173 | 70 |
| 3646 Palm Dr | 0.33mi | 4/2.5 (+1) | 1,365 (+4%) | 2mo | $249,999 | $183 | 65 |
| 2501 Bamboo St | 0.34mi | 3/1.0 | 1,176 (-10%) | 3mo | $219,000 | $186 | 65 |
| 3419 Palm Dr | 0.11mi | 4/3.0 (+1) | 1,428 (+9%) | 3mo | $254,999 | $179 | 64 |
| 3429 Eastbrook Dr | 0.51mi | 3/2.0 | 1,385 (+6%) | 2mo | $249,000 | $180 | 62 |
| 2004 Eastbrook Cir | 0.66mi | 3/2.0 | 1,263 (-4%) | 0mo | $237,500 | $188 | 58 |
| 3329 Eastbrook Dr | 0.60mi | 3/2.0 | 1,257 (-4%) | 5mo | $259,900 | $207 | 57 |
| 2722 Cumberland Dr | 0.66mi | 3/2.0 | 1,246 (-5%) | 4mo | $254,500 | $204 | 54 |
| 2602 Eastridge St | 0.63mi | 3/2.0 | 1,504 (+15%) | 3mo | $245,000 | $163 | 40 |
| 2525 Belhaven Dr | 0.73mi | 3/2.0 | 1,485 (+13%) | 0mo | $249,900 | $168 | 40 |
Match score weights: distance 35% · size 25% · config 20% · recency 20%. Top-matched comps best support the ARV.
Projected returns pro-forma
-3.0% appreciation · 0.4% rent growth · sell at horizon
- IRR
- -12.8%
- Equity multiple
- 0.55×
- Total profit
- $-20,139
- Equity at exit
- $23,857
- IRR
- -9.3%
- Equity multiple
- 0.50×
- Total profit
- $-22,203
- Equity at exit
- $13,834
Cash invested: $44,800 (down + closing). Projections, not guarantees.
Landlord ↔ Tenant lean methodology
- Overall (STATE)
- 87 Strongly Landlord-Friendly
- State Texas
- 87 Strongly Landlord-Friendly · R+5
- County
- — inherits STATE
- City
- — inherits STATE
ZIP-level market 75150
- Home prices YoY
- -33.8%
- Rents YoY
- 0.4%
- Active inventory
- 186
- Price-to-rent
- 7.0×
Monthly cashflow live
- Estimated rent
- $1,892 high interval (Pro) →
- Mortgage (P&I)
- −$839
- Tax from tax record
- −$425 /mo · $5,104/yr
- Insurance
- −$67
- HOA
- −$0
- Vacancy / Maint / Mgmt
- −$397
- Net cashflow
- $164
Break-even live
UW: 25.0% down · 7.5% · 30yr · 1.5% tax · 5.0% vac · 8.0% maint · 8.0% mgmt
Financing live
Cash to close
- Down payment
- $40,000
- Closing costs
- $4,800
- Reserves months
- —
- Total cash needed
- —
Loan-product check · same deal, 3 products live
Conventional
25% down · 7.5% · 30yr
- Down + closing
- —
- Monthly P&I
- —
- Monthly cashflow
- —
- DSCR
- —
- Eligible?
- —
Personal DTI + credit; lowest rate.
DSCR
20% down · 8.5% · 30yr
- Down + closing
- —
- Monthly P&I
- —
- Monthly cashflow
- —
- DSCR
- —
- Eligible?
- —
No personal income docs; deal must DSCR.
Hard money
10% down · 12.0% · 12mo
- Down + closing
- —
- Monthly P&I
- —
- Monthly cashflow
- —
- DSCR
- —
- Eligible?
- —
Short-term bridge; refi at stabilization.
Rent comps 40 comps
| Address | Beds | Baths | Sqft | Rent | $/sqft | DOM | Units | Dist |
|---|---|---|---|---|---|---|---|---|
| 3512 Bahamas Dr Mesquite, TX | 3.0 | 2.0 | 1455 | $1,795 | $1.23 | 20d | 1 | 0.09mi |
| 3512 Bahamas Dr Mesquite, TX | 3.0 | 2.0 | 1455 | $1,795 | $1.23 | 11d | 1 | 0.09mi |
| 3512 Bahamas Dr Mesquite, TX | 3.0 | 2.0 | 1455 | $1,795 | $1.23 | 24d | 1 | 0.09mi |
| 3531 Bonita Vista Cir Mesquite, TX | 4.0 | 2.0 | 1358 | $1,950 | $1.44 | 24d | 1 | 0.20mi |
| 3531 Bonita Vista Cir Mesquite, TX | 4.0 | 2.0 | 1358 | $1,950 | $1.44 | 12d | 1 | 0.20mi |
| 3206 Heather Glen Dr Mesquite, TX | 4.0 | 2.0 | 1708 | $4,800 | $2.81 | 1d | 1 | 0.24mi |
| 3703 Byrd Dr Mesquite, TX | 3.0 | 1.5 | 1702 | $2,150 | $1.26 | 2d | 1 | 0.26mi |
| 3315 Kensington Dr Mesquite, TX | 3.0 | 2.0 | 1641 | $1,900 | $1.16 | 43d | 1 | 0.44mi |
| 3110 Berkshire Dr Mesquite, TX | 3.0 | 2.0 | 1755 | $2,183 | $1.24 | 7d | 1 | 0.53mi |
| 2808 Belhaven Dr Mesquite, TX | 3.0 | 1.5 | 1199 | $1,695 | $1.41 | 1d | 1 | 0.56mi |
| 2021 Aloha Dr Mesquite, TX | 3.0 | 2.0 | 1556 | $2,200 | $1.41 | 43d | 1 | 0.57mi |
| 4244 Flamingo Way Mesquite, TX | 3.0 | 2.0 | 1500 | $2,150 | $1.43 | 43d | 1 | 0.60mi |
| 4313 Flamingo Way Mesquite, TX | 3.0 | 2.0 | 1482 | $2,200 | $1.48 | 7d | 1 | 0.61mi |
| 4228 Flamingo Way Mesquite, TX | 3.0 | 2.0 | 1240 | $1,898 | $1.53 | 43d | 1 | 0.61mi |
| 2721 Northview Pl Mesquite, TX | 4.0 | 2.5 | 1512 | $2,135 | $1.41 | 43d | 1 | 0.83mi |
| 2721 Northview Pl Mesquite, TX | 4.0 | 2.0 | 1512 | $2,245 | $1.48 | 19d | 1 | 0.83mi |
| 3532 Hilton Dr Mesquite, TX | 3.0 | 1.5 | 1216 | $1,690 | $1.39 | 2d | 1 | 0.86mi |
| 4200 U.S. 80 Mesquite, TX | 1.0–2.0 | 1.0–2.0 | 787 | $1,525 | $1.94 | 2d | 132 | 0.90mi |
| 3404 Gray Dr Mesquite, TX | 4.0 | 2.0 | 1516 | $2,150 | $1.42 | 12d | 1 | 0.91mi |
| 3622 Gray Dr Mesquite, TX | 3.0 | 2.0 | 1786 | $2,200 | $1.23 | 7d | 1 | 0.93mi |
| 1809 Baker Dr Mesquite, TX | 1.0–2.0 | 1.0–2.0 | 874 | $1,431 | $1.64 | 43d | 3 | 0.95mi |
| 3500 Statler Dr Mesquite, TX | 3.0 | 2.0 | 1557 | $1,895 | $1.22 | 24d | 1 | 0.97mi |
| 8411 La Prada Dr Dallas, TX | 1.0–3.0 | 1.0–2.0 | 825 | $1,305 | $1.58 | 1d | 23 | 1.04mi |
| 3511 Casa Ridge Dr Mesquite, TX | 4.0 | 1.5 | 1276 | $1,759 | $1.38 | 7d | 1 | 1.05mi |
| 2820 Percheron Dr Mesquite, TX | 3.0 | 2.5 | 1769 | $2,400 | $1.36 | 24d | 1 | 1.05mi |
| 2948 Percheron Dr Unit NA Mesquite, TX | 3.0 | 2.5 | 1691 | $1,995 | $1.18 | 24d | 1 | 1.06mi |
| 8383 La Prada Dr Dallas, TX | 1.0–2.0 | 1.0–2.0 | 910 | $1,545 | $1.70 | 7d | 10 | 1.06mi |
| 2909 Bluets Dr Mesquite, TX | 3.0 | 2.5 | 1728 | $2,000 | $1.16 | 15d | 1 | 1.08mi |
| 2908 Mare Dr Mesquite, TX | 3.0 | 2.5 | 1722 | $2,100 | $1.22 | 43d | 1 | 1.08mi |
| 3017 Percheron Dr Mesquite, TX | 3.0 | 3.0 | 1473 | $1,995 | $1.35 | 21d | 1 | 1.08mi |
| 3021 Percheron Dr Unit NA Mesquite, TX | 3.0 | 3.0 | 1754 | $2,299 | $1.31 | 7d | 1 | 1.08mi |
| 3021 Percheron Dr Mesquite, TX | 3.0 | 3.0 | 1754 | $2,299 | $1.31 | 17d | 1 | 1.08mi |
| 3412 Beth Dr Mesquite, TX | 3.0 | 1.0 | 1148 | $1,795 | $1.56 | 43d | 1 | 1.09mi |
| 2837 Appaloosa Ln Mesquite, TX | 3.0 | 2.5 | 1837 | $2,500 | $1.36 | 43d | 1 | 1.09mi |
| 2920 Bluets Dr Mesquite, TX | 3.0 | 3.0 | 1477 | $2,250 | $1.52 | 21d | 1 | 1.09mi |
| 2969 Baneberry Ln Mesquite, TX | 3.0 | 2.5 | 1716 | $2,400 | $1.40 | 7d | 1 | 1.10mi |
| 2941 Baneberry Ln Mesquite, TX | 3.0 | 2.5 | 1810 | $2,500 | $1.38 | 43d | 1 | 1.10mi |
| 3036 Shire Dr Mesquite, TX | 3.0 | 2.5 | 1691 | $2,350 | $1.39 | 12d | 1 | 1.11mi |
| 3004 Baneberry Ln Mesquite, TX | 3.0 | 3.0 | 1786 | $2,445 | $1.37 | 43d | 1 | 1.13mi |
| 2944 Baneberry Ln Mesquite, TX | 3.0 | 2.5 | 1772 | $2,400 | $1.35 | 43d | 1 | 1.13mi |
Listing history 16 events
-
2026-04-22status Pending
-
2026-04-15price $160,000
-
2026-04-15status Active
-
2026-04-09historical
-
2026-04-06$170,000
-
2025-07-24soldstatus
-
2007-02-15soldstatus 98-char remark
Show marketing remark (98 chars)
Hud home to be sold as-is . Bid deadline: 01-28-07. Case#491-838454, general list date: 12-29-06.
-
2007-01-29historical 98-char remark
Show marketing remark (98 chars)
Hud home to be sold as-is . Bid deadline: 01-28-07. Case#491-838454, general list date: 12-29-06.
-
2006-12-29$66,000 98-char remark
Show marketing remark (98 chars)
Hud home to be sold as-is . Bid deadline: 01-28-07. Case#491-838454, general list date: 12-29-06.
-
2004-06-07soldstatus
-
2004-03-01soldstatus
-
2004-02-27soldstatus 301-char remark
Show marketing remark (301 chars)
NICE HOUSE W/ SHADDED LOT, UPDATED KIT. HUD HOME TO BE SOLD 'AS-IS', SELLING BROKER COMM UP TO 5%, BLB COMM . 49%, BID DEADLINE 12/22/03, CASE#491-680084 , HUD CONTRACTS/ADDMS, AVAILABILITY & SPECIFIC INSTRUCTIONS AT WWW. FITSTPRE STON. COM OR HUD. GOV OR CALL 800-260-3760.. .. ESCROW:$3,740.00
-
2004-01-06historical 301-char remark
Show marketing remark (301 chars)
NICE HOUSE W/ SHADDED LOT, UPDATED KIT. HUD HOME TO BE SOLD 'AS-IS', SELLING BROKER COMM UP TO 5%, BLB COMM . 49%, BID DEADLINE 12/22/03, CASE#491-680084 , HUD CONTRACTS/ADDMS, AVAILABILITY & SPECIFIC INSTRUCTIONS AT WWW. FITSTPRE STON. COM OR HUD. GOV OR CALL 800-260-3760.. .. ESCROW:$3,740.00
-
2003-12-18$70,000 301-char remark
Show marketing remark (301 chars)
NICE HOUSE W/ SHADDED LOT, UPDATED KIT. HUD HOME TO BE SOLD 'AS-IS', SELLING BROKER COMM UP TO 5%, BLB COMM . 49%, BID DEADLINE 12/22/03, CASE#491-680084 , HUD CONTRACTS/ADDMS, AVAILABILITY & SPECIFIC INSTRUCTIONS AT WWW. FITSTPRE STON. COM OR HUD. GOV OR CALL 800-260-3760.. .. ESCROW:$3,740.00
-
1999-09-28soldstatus
-
1979-06-01soldstatus
ⓘ Source: listings_history table (triggers on properties + properties_extension) + one-shot
backfill from property_details.listing_events for pre-trigger history.
Tax reassessment forecast TX · Resets to sale price
- Current annual tax
- $5,104 · $425/mo
- Projected year-2 tax
- $5,104 · $425/mo
- Expected delta
- $0/yr ($0/mo · 0.0%)
ⓘ Screening estimate from a state-policy table — verify with the county assessor before closing.
Climate risk First Street
- Flood 1/10 Low FEMA zone X (unshaded) · 0% chance over 30 yrs
- Wildfire 1/10 Low
- Heat 7/10 Severe 7 d/yr ≥109°F today · 24 d/yr by 30 yrs out
- Wind 6/10 Major 27% chance of damaging wind over 30 yrs
- Air quality 2/10 Low 2 unhealthy d/yr today · 2 by 30 yrs out
Nearby sold comps map
Loading sold comps map…
Walkable amenities ~0.75 mi
Loading nearby amenities…
Taxation est. · year 1
- Rental income
- $22,710
- − Mortgage interest
- −$8,962
- − Property taxes
- −$5,104
- − Insurance
- −$800
- − Repairs & maintenance
- −$1,817
- − Management
- −$1,817
- − Depreciation
- −$4,655
- Taxable loss
- −$445
- Est. tax savings @ 24.0%
- +$107
- After-tax cash flow
- $2,075/yr
For passive investors: Depreciation is non-cash, so a rental often shows a tax loss while cash-flowing — sheltering income. Rental losses are passive: they offset passive income freely, and up to $25,000/yr can offset ordinary (W-2) income if you actively participate and your MAGI is under $100k (phasing out to $0 by $150k); unused losses carry forward. On sale, claimed depreciation is recaptured at up to 25%, and gains may owe capital-gains tax (a 1031 exchange can defer both). Figures are a year-1 estimate at your 24.0% rate — not tax advice; consult a CPA.
Schools (NCES district)
- District
- Mesquite ISD
- NCES district ID
- 4830390
- Math proficiency
- 35% ▼ -11.00%
- Reading proficiency
- 32% ▼ -7.00%
- Median HH income
- $49,372
- Composite
- 29.06/100
- National rank
- #6606
- State rank
- #536 of 826 in TX
Livability — Mesquite
- Score
- 70/100
- State rank
- #358
- US rank
- #7743
Category grades
Schools grade is shown separately in the Schools card above.
Census & demographics
- Census place
- Mesquite, TX
- County
- Dallas County · 2,612,404 people
- City population
- 150,788
- Metro
- Dallas-Fort Worth-Arlington, TX
- Population (ZIP)
- 62,738
- Household income
- $65,440
- Rent vs Own
- Severe rent burden
- 3609.0
Population outlook (Dallas County) Hauer SSP2
- Today (2025)
- 2,979,839 people
- By 2030
- 3,191,823 · +7.1%
- By 2040
- 3,619,611 · +21.5%
- By 2050
- 4,026,915 · +35.1%
- By 2075
- 4,957,073 · +66.4%
- By 2100
- 5,508,725 · +84.9%
Race, ethnicity, and origin ACS 2023
- Neighborhood character
- Diverse neighborhood (Simpson 0.66)
- Race & ethnicity
- Hispanic / Latino 47% White 27% Two or more races 21% Black 21% Asian 3%
- Hispanic origin (detail)
- Mexican 42%
- Common ancestry
- Slovak 1% Lithuanian 1% Serbian 1%
- Foreign-born
- 20% · Canada, Vietnam, China
- Languages at home
- 56% English-only · Spanish 40% Other Asian/Pacific 1% Arabic 1%
Political lean MEDSL · Dallas
- 2024 margin
- Strong D (+22.2) · D 60.2% · R 38.0% · Other 1.8%
- 2008→2024 swing
- +6.9pp toward D · 2008: 15.3pp · 2024: 22.2pp
- All cycles
- 2024: D+22.2 2020: D+31.6 2016: D+26.2 2012: D+15.4 2008: D+15.3
Not yet ingested
- Civics
- —
Market trends
- HPI YoY
- ▼ -172.95%
- Current HPI
- 338.3934
- Rent YoY
- ▲ 0.40%
- Metro
- Dallas-Fort Worth-Arlington, TX
- State GDP YoY
- ▲ 3.95%
- F500 in state
- 110
Industry mix (Fortune 500 HQ in TX)
| Industry | F500 HQs | Revenue |
|---|---|---|
| Energy | 16 | $1,198B |
|
||
| Technology | 5 | $198B |
|
||
| Engineering / Construction | 4 | $72B |
|
||
| Energy Services | 3 | $60B |
|
||
| Utilities | 3 | $41B |
|
||
| Healthcare | 2 | $330B |
|
||
Price history
+128.6% since first listed16 events — show timeline
- 2026-04-22 Pending — NTREIS
- 2026-04-15 Price Changed $160,000 NTREIS
- 2026-04-15 Relisted — NTREIS
- 2026-04-09 Listing Removed — NTREIS
- 2026-04-06 Listed $170,000 NTREIS
- 2025-07-24 Sold (Public Records) — Public Records
- 2007-02-15 Sold (MLS) — NTREIS
- 2007-01-29 Listing Removed — NTREIS
- 2006-12-29 Listed $66,000 NTREIS
- 2004-06-07 Sold (Public Records) — Public Records
- 2004-03-01 Sold (Public Records) — Public Records
- 2004-02-27 Sold (MLS) — NTREIS
- 2004-01-06 Listing Removed — NTREIS
- 2003-12-18 Listed $70,000 NTREIS
- 1999-09-28 Sold (Public Records) — Public Records
- 1979-06-01 Sold (Public Records) — Public Records
Property tax history
+6.7%/yrLatest (2025): $5,104 · -4.0% YoY. Source: county tax records.
Cash-flow waterfall
monthlySold comps — $/sqft
last 12 mo · ≤1 miLoading sold comps…