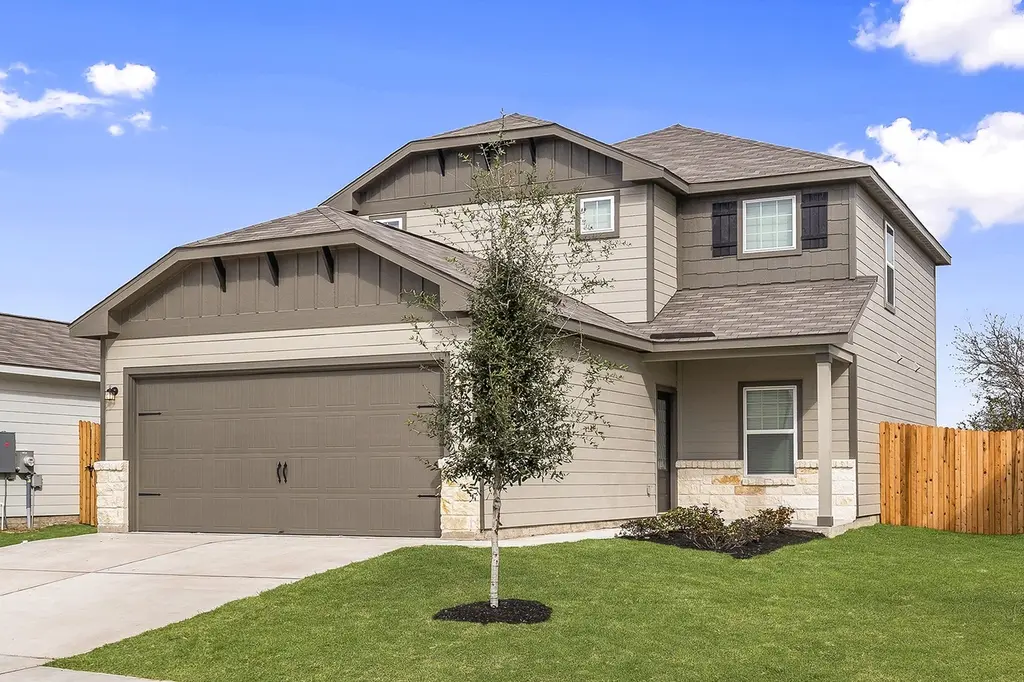
14709 Eagles Claw Way · Elgin, TX
Flood risk No data
- FEMA flood zone
- —
- Chance of flooding over 30 yrs
- —
- Est. flood insurance / yr
- —
Fire risk No data
- Est. fire insurance / yr
- —
Heat risk No data
- Hot days now (above threshold)
- —
- Hot days in 30 yrs
- —
Wind risk No data
- Chance of severe wind over 30 yrs
- —
Air-quality risk No data
- Unhealthy air days now
- —
- Unhealthy air days in 30 yrs
- —
Risk factors via First Street. Map © Google.
Why this score? — see what drove the D- grade
The composite is a weighted blend of 9 inputs, each scored 0–100. Each bar is that input's sub-score; the figure is the points it added to the 100-point composite (weight × sub-score).
- ARV discount +10.1/15.0
- Appreciation +10.0/10.0
- Cash flow +4.9/30.0
- Livability +3.7/5.0
- Rent growth +3.3/5.0
- Condition / age +2.5/5.0
- Schools +2.0/10.0
- 1% rule +1.8/10.0
- DSCR +0.0/10.0
$312,900
🖨 Deal sheet 📄 Offer letter ✓ Due diligence
Listing remarks
The Marek is a generously designed two-story home, ideal for your growing family. The first floor showcases an expansive open-concept layout, complemented by a luxurious master retreat. Upstairs, you’ll find a fun game room along with three roomy bedrooms. This home also offers an abundance of storage options, featuring multiple walk-in and linen closets to meet all your needs. The Marek is packed with stylish upgrades at no additional cost, starting with its stunning curb appeal, which includes professionally landscaped front yard and an elegant ¾ lite front door. Inside, enjoy a chef-inspired kitchen equipped with granite countertops and high-end stainless steel appliances. P
Key facts
- Master retreat
- Linen closets
- Storage options
Tags
Neighborhood map
What this means for you Summary
Snapshot
- This is a 4-bed/2.0-bath single-family listed at $313k.
Deal economics
- At list price, monthly cash flow is $-749 ($-9k/yr) — negative.
- To cash-flow at today's rent, offer at most $181k (42.3% below list).
- To meet the 1% rule (rent ≥ 1% of price), the offer needs to be $211k (32.4% below list).
- Recommended offer: $181k (42.3% below list) — sets the bar for cash-flow.
- Cap rate 3.4% vs local median 4.4% in Elgin — below-typical yield; the buyer is paying a premium for something (appreciation thesis, condition, location) that the cap rate doesn't capture.
Location & tenants
- Location reads 74/100 on livability (#167 in TX, #4,404 nationally) — a middle-class / working-renter tenant base. Strengths: cost of living A+, housing A+, health & safety A+; Watch: schools F, amenities F, commute F.
- Elgin ISD (rural): math 17% / reading 26% proficiency, ranked #741 of 826 in TX (top 90%) — low school quality limits family demand, transient renter base, plan for 1-2y turnover; 67% free/reduced lunch — lower-income household profile, screen leases tightly.
- Market conditions: Rents rising (+3.1%/yr); 807 active listings in the ZIP; 32 comparable units currently listed for rent nearby; rentals at typical pace (median 18d on market — plan ~3-4 weeks tenant-placement turnaround); solid renter incomes; 17,121 units permitted in Travis County in 2024 (11,963 in 5+ unit buildings).
Forward outlook
- In year one you build about $33k of equity ($2k loan paydown + $31k appreciation (10.0% local appreciation)).
- Travis County population projected at +60% by 2050 — long-run rental-demand tailwind backs the buy-and-hold thesis.
- By year 2, paydown + projected appreciation supports a ~$54k cash-out refi (75% LTV) — recoverable capital for the next deal without selling this one.
Negotiation context
- It's been on market 28 days — a 2% lower offer ($308k) is reasonable based on typical stale-listing flexibility.
- 8 sale attempts; this cycle's ask is 12594% above the opening price — seller raised mid-cycle; expect resistance to lowballs.
Questions for the listing agent
- What do current leases actually rent for vs. the listed asking? Can we see a recent rent roll and the last 12 months of T-12 income?
- What does the HOA fee cover, when was the last increase, and are there any pending special assessments or reserve-fund shortfalls?
- Is there a deadline driving the sale (1031 exchange, divorce, estate, relocation)? That informs how much negotiation room exists.
- Schools are F-rated, which usually means shorter tenancies and higher turnover. Who's the typical renter profile here, and what's been the actual vacancy rate?
- The area grade is low — what's the realistic commute time and amenity access for the typical tenant pool here? Any planned neighborhood developments (good or bad) we should know about?
- What's the average days-on-market for RENTAL listings here right now (not sales)? A rising rental-DOM trend means longer vacancies and softer asking-rent achievability than the comps imply.
- What's the recent tenant-quality profile in this submarket — average credit score on applications, eviction rate, late-payment / NSF rate, and stable-employment percentage? A property-management company in the area should have these aggregated.
- How much new for-sale + rental construction is in the pipeline within 1–3 miles? Heavy new supply typically softens prices + rents 12–24 months out; constrained supply supports both.
Investment metrics
- 1% rule
- 0.68% ✗
- Cap rate
- 3.42%
- Cash-on-cash
- -10.27%
- DSCR
- 0.54
- GRM
- 12.3
CMA / ARV
- ARV (median comp)
- $331,769
- List price
- $312,900
- Delta
- -4.78%
- Verdict
- FAIR
- Comps
- 20 within 1.0 mi
Show comp detail 12 sales within ~0.75 mi
| Address | Dist | Beds/Ba | Sqft | Sold | Price | $/sf | Match |
|---|---|---|---|---|---|---|---|
| 18300 Stellers Sea St | 0.12mi | 4/2.5 | 1,924 (+0%) | 2mo | $289,900 | $151 | 91 |
| 18236 Stellers Sea St | 0.13mi | 4/2.5 | 1,924 (+0%) | 7mo | $313,900 | $163 | 86 |
| 18204 Papuan Cv | 0.20mi | 4/3.0 | 1,912 (-0%) | 3mo | $278,541 | $146 | 84 |
| 18205 Harpy Ct | 0.18mi | 4/3.0 | 1,912 (-0%) | 8mo | $327,990 | $172 | 80 |
| 14525 Bonellis Pass | 0.14mi | 3/2.5 (-1) | 1,826 (-5%) | 6mo | $276,451 | $151 | 73 |
| 18216 Papuan Cv | 0.17mi | 3/2.5 (-1) | 1,826 (-5%) | 5mo | $281,985 | $154 | 73 |
| 16416 Farmhouse Ln | 0.34mi | 4/2.0 | 1,986 (+3%) | 8mo | $248,400 | $125 | 72 |
| 18209 Harpy Ct | 0.18mi | 4/2.5 | 2,121 (+10%) | 7mo | $339,490 | $160 | 67 |
| 19012 Speculator Ln | 0.44mi | 4/2.0 | 1,794 (-7%) | 3mo | $255,000 | $142 | 66 |
| 14401 Tawny Eagles Ct | 0.23mi | 3/2.0 (-1) | 1,669 (-13%) | 5mo | $260,000 | $156 | 58 |
| 216 Lavender Ln | 0.52mi | 3/2.5 (-1) | 1,997 (+4%) | 7mo | $301,640 | $151 | 57 |
| 205 Lavender Ln | 0.54mi | 3/2.5 (-1) | 1,782 (-7%) | 1mo | $291,670 | $164 | 55 |
Match score weights: distance 35% · size 25% · config 20% · recency 20%. Top-matched comps best support the ARV.
Projected returns pro-forma
10.0% appreciation · 3.12% rent growth · sell at horizon
- IRR
- 17.1%
- Equity multiple
- 2.41×
- Total profit
- $123,126
- Equity at exit
- $281,885
- IRR
- 16.3%
- Equity multiple
- 5.58×
- Total profit
- $401,022
- Equity at exit
- $607,896
Cash invested: $87,612 (down + closing). Projections, not guarantees.
Landlord ↔ Tenant lean methodology
- Overall (STATE)
- 87 Strongly Landlord-Friendly
- State Texas
- 87 Strongly Landlord-Friendly · R+5
- County
- — inherits STATE
- City
- — inherits STATE
ZIP-level market 78621
- Home prices YoY
- 7.6%
- Rents YoY
- 3.1%
- Active inventory
- 807
- Price-to-rent
- 12.3×
Monthly cashflow live
- Estimated rent
- $2,115 high interval (Pro) →
- Mortgage (P&I)
- −$1,641
- Tax from tax record
- −$614 /mo · $7,365/yr
- Insurance
- −$130
- HOA
- −$35
- Vacancy / Maint / Mgmt
- −$444
- Net cashflow
- $-749
Break-even live
UW: 25.0% down · 7.5% · 30yr · 1.5% tax · 5.0% vac · 8.0% maint · 8.0% mgmt
Financing live
Cash to close
- Down payment
- $78,225
- Closing costs
- $9,387
- Reserves months
- —
- Total cash needed
- —
Loan-product check · same deal, 3 products live
Conventional
25% down · 7.5% · 30yr
- Down + closing
- —
- Monthly P&I
- —
- Monthly cashflow
- —
- DSCR
- —
- Eligible?
- —
Personal DTI + credit; lowest rate.
DSCR
20% down · 8.5% · 30yr
- Down + closing
- —
- Monthly P&I
- —
- Monthly cashflow
- —
- DSCR
- —
- Eligible?
- —
No personal income docs; deal must DSCR.
Hard money
10% down · 12.0% · 12mo
- Down + closing
- —
- Monthly P&I
- —
- Monthly cashflow
- —
- DSCR
- —
- Eligible?
- —
Short-term bridge; refi at stabilization.
Rent comps 32 comps
| Address | Beds | Baths | Sqft | Rent | $/sqft | DOM | Units | Dist |
|---|---|---|---|---|---|---|---|---|
| 18200 Papuan Cv Elgin, TX | 3.0 | 2.0 | 1402 | $1,900 | $1.36 | 3d | 1 | 0.22mi |
| 18300 Speculator Ln Elgin, TX | 4.0 | 2.0 | 1794 | $1,995 | $1.11 | 24d | 1 | 0.25mi |
| 18224 Speculator Ln Elgin, TX | 3.0 | 2.5 | 1599 | $1,700 | $1.06 | 43d | 1 | 0.26mi |
| 14141 Prospector Way Elgin, TX | 3.0 | 2.0 | 1520 | $1,650 | $1.09 | 43d | 1 | 0.28mi |
| 14521 Gurneys Eagle Dr Elgin, TX | 3.0 | 2.0 | 1878 | $1,895 | $1.01 | 1d | 1 | 0.29mi |
| 14300 Boomtown Way Elgin, TX | 4.0 | 2.0 | 1794 | $2,050 | $1.14 | 24d | 1 | 0.29mi |
| 18741 Speculator Ln Elgin, TX | 5.0 | 2.5 | 2542 | $1,980 | $0.78 | 24d | 1 | 0.30mi |
| 18500 Allen Welch Dr Elgin, TX | 3.0 | 2.0 | 1525 | $1,825 | $1.20 | 4d | 1 | 0.34mi |
| 17001 Dusty Boots Ln Elgin, TX | 5.0 | 2.5 | 2542 | $1,945 | $0.77 | 20d | 1 | 0.34mi |
| 14101 Prospector Way Elgin, TX | 4.0 | 2.5 | 2198 | $2,099 | $0.95 | 43d | 1 | 0.34mi |
| 14101 Prospector Way Unit 14101 Elgin, TX | 4.0 | 2.5 | 2198 | $2,099 | $0.95 | 24d | 1 | 0.34mi |
| 14421 Prairie Sod Ln Elgin, TX | 3.0 | 2.0 | 1525 | $1,650 | $1.08 | 2d | 1 | 0.35mi |
| 19024 Quiet Range Dr Elgin, TX | 5.0 | 2.5 | 2542 | $1,995 | $0.78 | 43d | 1 | 0.36mi |
| 18612 Allen Welch Dr Elgin, TX | 4.0 | 2.0 | 1794 | $1,885 | $1.05 | 4d | 1 | 0.37mi |
| 16429 Farmhouse Ln Elgin, TX | 5.0 | 2.5 | 2542 | $2,000 | $0.79 | 2d | 1 | 0.38mi |
| 17041 Dusty Boots Ln Elgin, TX | 5.0 | 2.5 | 2542 | $2,370 | $0.93 | 3d | 1 | 0.42mi |
| 18525 Quiet Range Dr Elgin, TX | 4.0 | 2.0 | 1794 | $1,725 | $0.96 | 17d | 1 | 0.43mi |
| 234 Heritage Mill Trl Elgin, TX | 3.0 | 2.0 | 1530 | $1,850 | $1.21 | 2d | 1 | 0.43mi |
| 18505 Quiet Range Dr Elgin, TX | 4.0 | 2.0 | 1794 | $1,950 | $1.09 | 24d | 1 | 0.44mi |
| 18505 Quiet Range Dr Unit 18505 Elgin, TX | 4.0 | 2.0 | 1794 | $1,785 | $0.99 | 4d | 1 | 0.44mi |
| 107 Tillage Rd Elgin, TX | 3.0 | 2.0 | 1548 | $1,775 | $1.15 | 19d | 1 | 0.47mi |
| 18721 Quiet Range Dr Elgin, TX | 3.0–5.0 | 2.0–3.5 | 1773 | $2,452 | $1.38 | 1d | 1 | 0.51mi |
| 116 Honeybee Ln Elgin, TX | 3.0 | 2.5 | 1782 | $2,000 | $1.12 | 4d | 1 | 0.54mi |
| 242 Barley Ln Elgin, TX | 3.0 | 2.5 | 1782 | $2,150 | $1.21 | 1d | 1 | 0.56mi |
| 11524 Rush Ln Elgin, TX | 4.0 | 3.0 | 2473 | $2,300 | $0.93 | 43d | 1 | 0.68mi |
| 19017 Romano Dr Elgin, TX | 4.0 | 3.0 | 2473 | $2,198 | $0.89 | 4d | 1 | 0.74mi |
| 19405 Bear Grass Dr Elgin, TX | 3.0 | 2.0 | 1495 | $1,760 | $1.18 | 43d | 1 | 0.83mi |
| 102 Blanco Woods Blvd Elgin, TX | 3.0 | 2.5 | 2450 | $1,800 | $0.73 | 43d | 1 | 1.04mi |
| 101 Bandara Woods Blvd Elgin, TX | 3.0 | 2.0 | 1499 | $1,769 | $1.18 | 15d | 1 | 1.06mi |
| 722 Lavaca Loop Elgin, TX | 4.0 | 2.5 | 2075 | $1,895 | $0.91 | 17d | 1 | 1.15mi |
| 401 Bandara Woods Blvd Elgin, TX | 3.0 | 2.0 | 1665 | $1,875 | $1.13 | 43d | 1 | 1.17mi |
| 419 Gettysburg Loop Elgin, TX | 3.0 | 2.0 | 1565 | $1,850 | $1.18 | 12d | 1 | 1.38mi |
HOA detail
- Monthly dues
- $35 · $420/yr
Listing history 29 events
-
2026-06-18days on market $312,900 Active 28 DOM
-
2026-06-17days on market $312,900 Active 27 DOM
-
2026-06-16days on market $312,900 Active 26 DOM
-
2026-06-15days on market $312,900 Active 25 DOM
-
2026-06-13days on market $312,900 Active 23 DOM
-
2026-06-09days on market $312,900 Active 19 DOM
-
2026-06-08days on market $312,900 Active 18 DOM
-
2026-06-07days on market $312,900 Active 17 DOM
-
2026-06-04days on market $312,900 Active 14 DOM
-
2026-06-03days on market $312,900 Active 13 DOM
-
2026-06-02days on market $312,900 Active 12 DOM
-
2026-06-01days on market $312,900 Active 11 DOM
-
2026-05-31days on market $312,900 Active 10 DOM
-
2026-05-20historical $2,465
-
2026-05-08$2,465
-
2026-05-07status Active
-
2026-05-07price
-
2026-03-03historical $2,455
-
2026-03-03status Pending
-
2026-03-02price
-
2026-02-21$2,455
-
2026-02-19historical $2,455
-
2026-02-13Active
-
2026-02-10price
-
2026-01-23$2,455
-
2026-01-22historical $2,455
-
2026-01-16Active
-
2025-12-07$2,455
-
2025-12-05Active
ⓘ Source: listings_history table (triggers on properties + properties_extension) + one-shot
backfill from property_details.listing_events for pre-trigger history.
Tax reassessment forecast TX · Resets to sale price
- Current annual tax
- $7,365 · $614/mo
- Projected year-2 tax
- $7,365 · $614/mo
- Expected delta
- $0/yr ($0/mo · -0.0%)
ⓘ Screening estimate from a state-policy table — verify with the county assessor before closing.
Nearby sold comps map
Loading sold comps map…
Walkable amenities ~0.75 mi
Loading nearby amenities…
Taxation est. · year 1
- Rental income
- $25,376
- − Mortgage interest
- −$17,527
- − Property taxes
- −$7,365
- − Insurance
- −$1,564
- − Repairs & maintenance
- −$2,030
- − Management
- −$2,030
- − HOA
- −$420
- − Depreciation
- −$9,103
- Taxable loss
- −$14,664
- Est. tax savings @ 24.0%
- +$3,519
- After-tax cash flow
- $-5,474/yr
For passive investors: Depreciation is non-cash, so a rental often shows a tax loss while cash-flowing — sheltering income. Rental losses are passive: they offset passive income freely, and up to $25,000/yr can offset ordinary (W-2) income if you actively participate and your MAGI is under $100k (phasing out to $0 by $150k); unused losses carry forward. On sale, claimed depreciation is recaptured at up to 25%, and gains may owe capital-gains tax (a 1031 exchange can defer both). Figures are a year-1 estimate at your 24.0% rate — not tax advice; consult a CPA.
Schools (NCES district)
- District
- Elgin ISD
- NCES district ID
- 4818360
- Math proficiency
- 17% ▼ -9.00%
- Reading proficiency
- 26% ▼ -5.00%
- Median HH income
- $55,176
- Composite
- 19.62/100
- National rank
- #8749
- State rank
- #741 of 826 in TX
Livability — Elgin
- Score
- 74/100
- State rank
- #167
- US rank
- #4404
Category grades
Schools grade is shown separately in the Schools card above.
Census & demographics
- Census place
- Elgin, TX
- County
- Bastrop County · 68,601 people
- City population
- 27,860
- Metro
- Austin-Round Rock-Georgetown, TX
- Population (ZIP)
- 30,411
- Household income
- $98,534
- Rent vs Own
- Severe rent burden
- 235.0
Population outlook (Travis County) Hauer SSP2
- Today (2025)
- 1,545,133 people
- By 2030
- 1,729,269 · +11.9%
- By 2040
- 2,097,596 · +35.8%
- By 2050
- 2,463,890 · +59.5%
- By 2075
- 3,249,374 · +110.3%
- By 2100
- 3,801,868 · +146.1%
Race, ethnicity, and origin ACS 2023
- Neighborhood character
- Diverse neighborhood (Simpson 0.64)
- Race & ethnicity
- Hispanic / Latino 46% White 38% Two or more races 19% Black 11% Native American 1%
- Hispanic origin (detail)
- Mexican 38%
- Common ancestry
- Slovak 2% Italian 2% Romanian 1%
- Foreign-born
- 17% · Canada, Vietnam
- Languages at home
- 63% English-only · Spanish 36%
Political lean MEDSL · Travis
- 2024 margin
- Solid D (+39.3) · D 68.8% · R 29.4% · Other 1.8%
- 2008→2024 swing
- +9.9pp toward D · 2008: 29.4pp · 2024: 39.3pp
- All cycles
- 2024: D+39.3 2020: D+45.0 2016: D+38.9 2012: D+23.9 2008: D+29.4
Not yet ingested
- Civics
- —
Market trends
- HPI YoY
- ▲ 29.47%
- Current HPI
- 416.87
- Rent YoY
- ▲ 3.12%
- Metro
- Austin-Round Rock-Georgetown, TX
- State GDP YoY
- ▲ 3.95%
- F500 in state
- 110
Industry mix (Fortune 500 HQ in TX)
| Industry | F500 HQs | Revenue |
|---|---|---|
| Energy | 16 | $1,198B |
|
||
| Technology | 5 | $198B |
|
||
| Engineering / Construction | 4 | $72B |
|
||
| Energy Services | 3 | $60B |
|
||
| Utilities | 3 | $41B |
|
||
| Healthcare | 2 | $330B |
|
||
Price history
+0.4% since first listed16 events — show timeline
- 2026-05-20 Rental Removed $2,465 ACTRIS
- 2026-05-08 Listed for Rent $2,465 ACTRIS
- 2026-05-07 Relisted — Unlock MLS
- 2026-05-07 Price Changed — Unlock MLS
- 2026-03-03 Rental Removed $2,455 ACTRIS
- 2026-03-03 Pending — Unlock MLS
- 2026-03-02 Price Changed — Unlock MLS
- 2026-02-21 Listed for Rent $2,455 ACTRIS
- 2026-02-19 Rental Removed $2,455 ACTRIS
- 2026-02-13 Listed — Unlock MLS
- 2026-02-10 Price Changed — Unlock MLS
- 2026-01-23 Listed for Rent $2,455 ACTRIS
- 2026-01-22 Rental Removed $2,455 ACTRIS
- 2026-01-16 Listed — Unlock MLS
- 2025-12-07 Listed for Rent $2,455 ACTRIS
- 2025-12-05 Listed — Unlock MLS
Property tax history
+286.6%/yrLatest (2026): $7,365 · +286.6% YoY. Source: county tax records.
Cash-flow waterfall
monthlySold comps — $/sqft
last 12 mo · ≤1 miLoading sold comps…