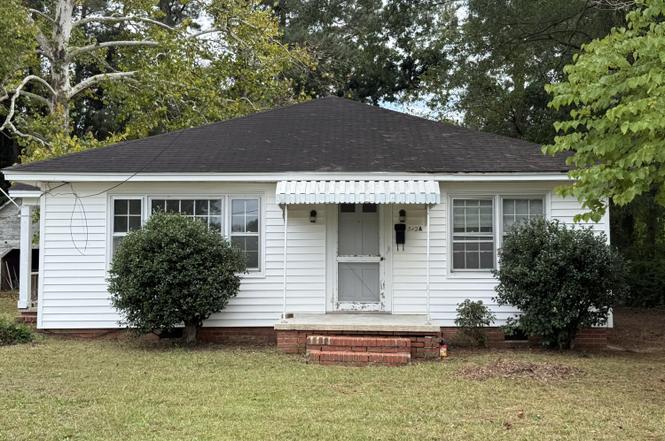
512 Nicholson St · Clinton, NC
Flood risk 5/10 · Moderate
- FEMA flood zone
- X (unshaded)
- Chance of flooding over 30 yrs
- 0.53%
- Est. flood insurance / yr
- $507 – $1,088
Fire risk 3/10 · Minor
- Est. fire insurance / yr
- $906 – $1,684
Heat risk 8/10 · Major
- Hot days now (above 105°F)
- 7 days/yr
- Hot days in 30 yrs
- 17 days/yr
Wind risk 8/10 · Major
- Chance of severe wind over 30 yrs
- 80.0%
Air-quality risk 2/10 · Minimal
- Unhealthy air days now
- 1 days/yr
- Unhealthy air days in 30 yrs
- 1 days/yr
Risk factors via First Street. Map © Google.
Why this score? — see what drove the B- grade
The composite is a weighted blend of 9 inputs, each scored 0–100. Each bar is that input's sub-score; the figure is the points it added to the 100-point composite (weight × sub-score).
- Cash flow +29.5/30.0
- DSCR +10.0/10.0
- 1% rule +8.0/10.0
- ARV discount +7.5/15.0
- Schools +3.6/10.0
- Livability +3.3/5.0
- Rent growth +2.5/5.0
- Condition / age +2.5/5.0
- Appreciation +0.0/10.0
$92,000
🖨 Deal sheet 📄 Offer letter ✓ Due diligence
Listing remarks
Conveniently located within the city limits and within walking distance of downtown, this duplex offers excellent potential. Each unit features 2 bedrooms and 1 full bath. The property requires extensive repairs and updates but provides a great opportunity for renovation or investment. With its central location and solid structure, this property has strong potential for future income or resale. Property sold AS-IS.
Key facts
- Central location
- Solid structure
- 9,148 sq ft lot
Tags
Neighborhood map
What this means for you Summary
Snapshot
- This is a 4-bed/2.0-bath single-family listed at $92k.
Deal economics
- At list price, monthly cash flow is $328 ($4k/yr) — positive.
- The deal already cash-flows at list — no discount required.
- Meets the 1% rule at list price ($1k rent vs $92k).
- Cap rate 10.6% vs local median 3.0% in Clinton — top-decile yield for the area; either an underpriced asset or a hidden risk that comps aren't pricing in. Stress-test before assuming the spread holds.
Location & tenants
- Location reads 66/100 on livability (#261 in NC) — a middle-class / working-renter tenant base. Strengths: cost of living A+, health & safety A+, housing A-; Watch: crime F, amenities F, commute F.
- Clinton City Schools (town): math 46% / reading 40% proficiency, ranked #102 of 178 in NC (top 57%) — families likely to look elsewhere, expect single-tenant / working-renter base with shorter leases; 71% free/reduced lunch — lower-income household profile, screen leases tightly.
- Zoned schools: Langdon C Kerr Elementary (396 students, 99% FRL); Sampson Middle (math 43% / reading 44%, grade D, #182 of 475 statewide, top 40%, 647 students, 100% FRL); Clinton High (math 62% / reading 44%, grade C-, #281 of 535 statewide, top 53%, 851 students, 99% FRL) — zoned schools average 99% FRL vs 71% district-wide (28 pts higher); higher-poverty schools than district average — tighter screening recommended.
- Market conditions: 147 active listings in the ZIP; 1 comparable units currently listed for rent nearby; 189 units permitted in Sampson County in 2024 (0 in 5+ unit buildings).
Forward outlook
- Local home prices are declining (-3.0%/yr); year-one equity from $636 of loan paydown is wiped out by about $3k of value loss. Plan a longer hold.
- Sampson County population projected to shrink 5% by 2050 — rents likely to lag national; underwrite the cash flow, not the appreciation.
- At projected returns (-3.0% appreciation + 3.0% rent growth), your $26k cash investment doubles in ~8 years — after that, you're playing with house money.
Negotiation context
- Only 12 days on market — expect competitive offers; lowballing is unlikely to land.
Risks & watch-outs
- Watch-outs: built in 1950 — expect roof / HVAC / electrical / plumbing capex.
- Climate carrying-cost: moderate flood risk; severe wind risk, 80% chance of damaging wind over 30y; extreme-heat days projected 7→17/yr by 2055 (HVAC capex compounding) — expect insurance premiums to compound above CPI over the hold.
Questions for the listing agent
- Built in 1950 — when were the roof, HVAC, electrical panel, plumbing, and water heater last replaced?
- Is there a deadline driving the sale (1031 exchange, divorce, estate, relocation)? That informs how much negotiation room exists.
- Schools are D-rated, which usually means shorter tenancies and higher turnover. Who's the typical renter profile here, and what's been the actual vacancy rate?
- Crime grade is F in this area — have there been break-ins, vandalism, or insurance claims at this property in the last 3 years? What carrier currently insures it and at what premium?
- What's the average days-on-market for RENTAL listings here right now (not sales)? A rising rental-DOM trend means longer vacancies and softer asking-rent achievability than the comps imply.
- What's the recent tenant-quality profile in this submarket — average credit score on applications, eviction rate, late-payment / NSF rate, and stable-employment percentage? A property-management company in the area should have these aggregated.
- How much new for-sale + rental construction is in the pipeline within 1–3 miles? Heavy new supply typically softens prices + rents 12–24 months out; constrained supply supports both.
Investment metrics
- 1% rule
- 1.30% ✓
- Cap rate
- 10.57%
- Cash-on-cash
- 15.28%
- DSCR
- 1.68
- GRM
- 6.4
CMA / ARV
- ARV (on-the-fly)
- $227,328
- Comps found
- 12
Show comp detail 12 sales within ~0.75 mi
| Address | Dist | Beds/Ba | Sqft | Sold | Price | $/sf | Match |
|---|---|---|---|---|---|---|---|
| 306 E Johnson St | 0.33mi | 3/2.0 (-1) | 1,585 (+3%) | 6mo | $195,000 | $123 | 69 |
| 207 Pearl St | 0.38mi | 3/2.0 (-1) | 1,500 (-2%) | 14mo | $259,900 | $173 | 61 |
| 604 Blaney St | 0.15mi | 3/2.0 (-1) | 1,713 (+12%) | 11mo | $199,500 | $116 | 60 |
| 108 Carolina Ave | 0.52mi | 3/2.0 (-1) | 1,505 (-2%) | 11mo | $200,000 | $133 | 58 |
| 400 Grove St | 0.66mi | 3/2.0 (-1) | 1,506 (-2%) | 3mo | $290,000 | $193 | 58 |
| 306 Warsaw Rd | 0.64mi | 3/1.5 (-1) | 1,478 (-4%) | 2mo | $235,000 | $159 | 55 |
| 907 Raleigh Rd | 0.62mi | 3/2.0 (-1) | 1,451 (-6%) | 8mo | $215,000 | $148 | 51 |
| 301 Graham St | 0.60mi | 3/2.0 (-1) | 1,650 (+7%) | 11mo | $255,000 | $155 | 46 |
| 912 College St | 0.41mi | 3/1.0 (-1) | 1,347 (-12%) | 12mo | $124,000 | $92 | 41 |
| 316 Carolina Ave | 0.63mi | 3/3.0 (-1) | 1,640 (+7%) | 12mo | $275,000 | $168 | 40 |
| 506 Underwood St | 0.74mi | 3/2.5 (-1) | 1,700 (+11%) | 11mo | $205,000 | $121 | 32 |
| 303 Dixie Cir | 0.73mi | 3/1.0 (-1) | 1,353 (-12%) | 11mo | $182,900 | $135 | 28 |
Match score weights: distance 35% · size 25% · config 20% · recency 20%. Top-matched comps best support the ARV.
Projected returns pro-forma
-3.0% appreciation · 3.0% rent growth · sell at horizon
- IRR
- 6.0%
- Equity multiple
- 1.23×
- Total profit
- $5,985
- Equity at exit
- $13,717
- IRR
- 15.4%
- Equity multiple
- 2.25×
- Total profit
- $32,139
- Equity at exit
- $7,954
Cash invested: $25,760 (down + closing). Projections, not guarantees.
Landlord ↔ Tenant lean methodology
- Overall (STATE)
- 85 Strongly Landlord-Friendly
- State North Carolina
- 85 Strongly Landlord-Friendly · R+3
- County
- — inherits STATE
- City
- — inherits STATE
ZIP-level market 28328
- Home prices YoY
- -17.3%
- Active inventory
- 147
- Price-to-rent
- 6.4×
Monthly cashflow live
- Estimated rent
- $1,200 medium interval (Pro) →
- Mortgage (P&I)
- −$482
- Tax from tax record
- −$99 /mo · $1,192/yr
- Insurance
- −$38
- HOA
- −$0
- Vacancy / Maint / Mgmt
- −$252
- Net cashflow
- $328
Break-even live
UW: 25.0% down · 7.5% · 30yr · 1.5% tax · 5.0% vac · 8.0% maint · 8.0% mgmt
Financing live
Cash to close
- Down payment
- $23,000
- Closing costs
- $2,760
- Reserves months
- —
- Total cash needed
- —
Loan-product check · same deal, 3 products live
Conventional
25% down · 7.5% · 30yr
- Down + closing
- —
- Monthly P&I
- —
- Monthly cashflow
- —
- DSCR
- —
- Eligible?
- —
Personal DTI + credit; lowest rate.
DSCR
20% down · 8.5% · 30yr
- Down + closing
- —
- Monthly P&I
- —
- Monthly cashflow
- —
- DSCR
- —
- Eligible?
- —
No personal income docs; deal must DSCR.
Hard money
10% down · 12.0% · 12mo
- Down + closing
- —
- Monthly P&I
- —
- Monthly cashflow
- —
- DSCR
- —
- Eligible?
- —
Short-term bridge; refi at stabilization.
Rent comps 1 comps
| Address | Beds | Baths | Sqft | Rent | $/sqft | DOM | Units | Dist |
|---|---|---|---|---|---|---|---|---|
| 400 W Boney St Clinton, NC | 3.0 | 1.0 | 1125 | $1,200 | $1.07 | 13d | 1 | 0.96mi |
Listing history 2 events
-
2026-05-31remarks 418-char remark
-
2026-05-31$92,000 Pending 12 DOM
ⓘ Source: listings_history table (triggers on properties + properties_extension) + one-shot
backfill from property_details.listing_events for pre-trigger history.
Tax reassessment forecast NC · Resets to sale price
- Current annual tax
- $1,192 · $99/mo
- Projected year-2 tax
- $1,192 · $99/mo
- Expected delta
- $0/yr ($0/mo · 0.0%)
ⓘ Screening estimate from a state-policy table — verify with the county assessor before closing.
Climate risk First Street
- Flood 5/10 Major FEMA zone X (unshaded) · 53% chance over 30 yrs
- Wildfire 3/10 Moderate
- Heat 8/10 Severe 7 d/yr ≥105°F today · 17 d/yr by 30 yrs out
- Wind 8/10 Severe 80% chance of damaging wind over 30 yrs
- Air quality 2/10 Low 1 unhealthy d/yr today · 1 by 30 yrs out
Nearby sold comps map
Loading sold comps map…
Walkable amenities ~0.75 mi
Loading nearby amenities…
Taxation est. · year 1
- Rental income
- $14,400
- − Mortgage interest
- −$5,153
- − Property taxes
- −$1,192
- − Insurance
- −$460
- − Repairs & maintenance
- −$1,152
- − Management
- −$1,152
- − Depreciation
- −$2,676
- Taxable income
- $2,615
- Est. tax owed @ 24.0%
- −$628
- After-tax cash flow
- $3,307/yr
For passive investors: Depreciation is non-cash, so a rental often shows a tax loss while cash-flowing — sheltering income. Rental losses are passive: they offset passive income freely, and up to $25,000/yr can offset ordinary (W-2) income if you actively participate and your MAGI is under $100k (phasing out to $0 by $150k); unused losses carry forward. On sale, claimed depreciation is recaptured at up to 25%, and gains may owe capital-gains tax (a 1031 exchange can defer both). Figures are a year-1 estimate at your 24.0% rate — not tax advice; consult a CPA.
Schools (NCES district)
- District
- Clinton City Schools
- NCES district ID
- 3700930
- Math proficiency
- 46% ▲ 7.00%
- Reading proficiency
- 40% ▲ 3.00%
- Median HH income
- $34,166
- Composite
- 35.5/100
- National rank
- #4919
- State rank
- #102 of 178 in NC
Livability — Clinton
- Score
- 66/100
- State rank
- #261
- US rank
- #11402
Category grades
Schools grade is shown separately in the Schools card above.
Census & demographics
- Census place
- Clinton, NC
- City population
- 26,314
- Population (ZIP)
- 26,314
Population outlook (Sampson County) Hauer SSP2
- Today (2025)
- 63,499 people
- By 2030
- 62,970 · -0.8%
- By 2040
- 61,609 · -3.0%
- By 2050
- 60,462 · -4.8%
- By 2075
- 60,108 · -5.3%
- By 2100
- 62,120 · -2.2%
Race, ethnicity, and origin ACS 2023
- Neighborhood character
- Diverse neighborhood (Simpson 0.69)
- Race & ethnicity
- White 40% Black 29% Hispanic / Latino 26% Two or more races 4% Native American 4%
- Hispanic origin (detail)
- Mexican 12% Cuban 1%
- Common ancestry
- Serbian 1% Slovak 1%
- Foreign-born
- 15% · Canada
- Languages at home
- 77% English-only · Spanish 22%
Political lean MEDSL · Sampson
- 2024 margin
- Strong R (+29.8) · D 34.8% · R 64.6%
- 2008→2024 swing
- -21.3pp toward R · 2008: -8.4pp · 2024: -29.8pp
- All cycles
- 2024: R+29.8 2020: R+22.5 2016: R+16.7 2012: R+11.0 2008: R+8.4
Not yet ingested
- Civics
- —
Market trends
- HPI YoY
- ▼ -49.24%
- Current HPI
- 236.0823
- Rent YoY
- —
- Metro
- —
- State GDP YoY
- ▲ 3.28%
- F500 in state
- 26
Industry mix (Fortune 500 HQ in NC)
| Industry | F500 HQs | Revenue |
|---|---|---|
| Financial Services | 2 | $213B |
|
||
| Retail | 2 | $95B |
|
||
| Industrial Conglomerate | 1 | $38B |
|
||
| Metals / Steel | 1 | $35B |
|
||
| Utilities | 1 | $30B |
|
||
| Industrial Machinery | 1 | $19B |
|
||
Price history
3 events — show timeline
- 2025-12-11 Pending — Hive MLS
- 2025-10-27 Pending — Hive MLS
- 2025-10-15 Listed $92,000 Hive MLS
Property tax history
+3.3%/yrLatest (2025): $1,192 · +5.6% YoY. Source: county tax records.
Cash-flow waterfall
monthlySold comps — $/sqft
last 12 mo · ≤1 miLoading sold comps…