2000 Squaw Vly · Sunnyside-Tahoe City, CA
Flood risk 1/10 · Minimal
- FEMA flood zone
- X (unshaded)
- Chance of flooding over 30 yrs
- 0.0%
- Est. flood insurance / yr
- $507 – $1,088
Fire risk 6/10 · Moderate
- Est. fire insurance / yr
- $659 – $1,223
Heat risk 2/10 · Minimal
- Hot days now (above 83°F)
- 14 days/yr
- Hot days in 30 yrs
- 35 days/yr
Wind risk 1/10 · Minimal
- Chance of severe wind over 30 yrs
- —
Air-quality risk 7/10 · Major
- Unhealthy air days now
- 10 days/yr
- Unhealthy air days in 30 yrs
- 17 days/yr
Risk factors via First Street. Map © Google.
Why this score? — see what drove the C- grade
The composite is a weighted blend of 9 inputs, each scored 0–100. Each bar is that input's sub-score; the figure is the points it added to the 100-point composite (weight × sub-score).
- Cash flow +15.0/30.0
- ARV discount +7.5/15.0
- Appreciation +6.6/10.0
- 1% rule +5.0/10.0
- DSCR +5.0/10.0
- Schools +4.4/10.0
- Rent growth +2.5/5.0
- Livability +2.5/5.0
- Condition / age +2.5/5.0
$6,000
🖨 Deal sheet 📄 Offer letter ✓ Due diligence
Listing remarks MLS
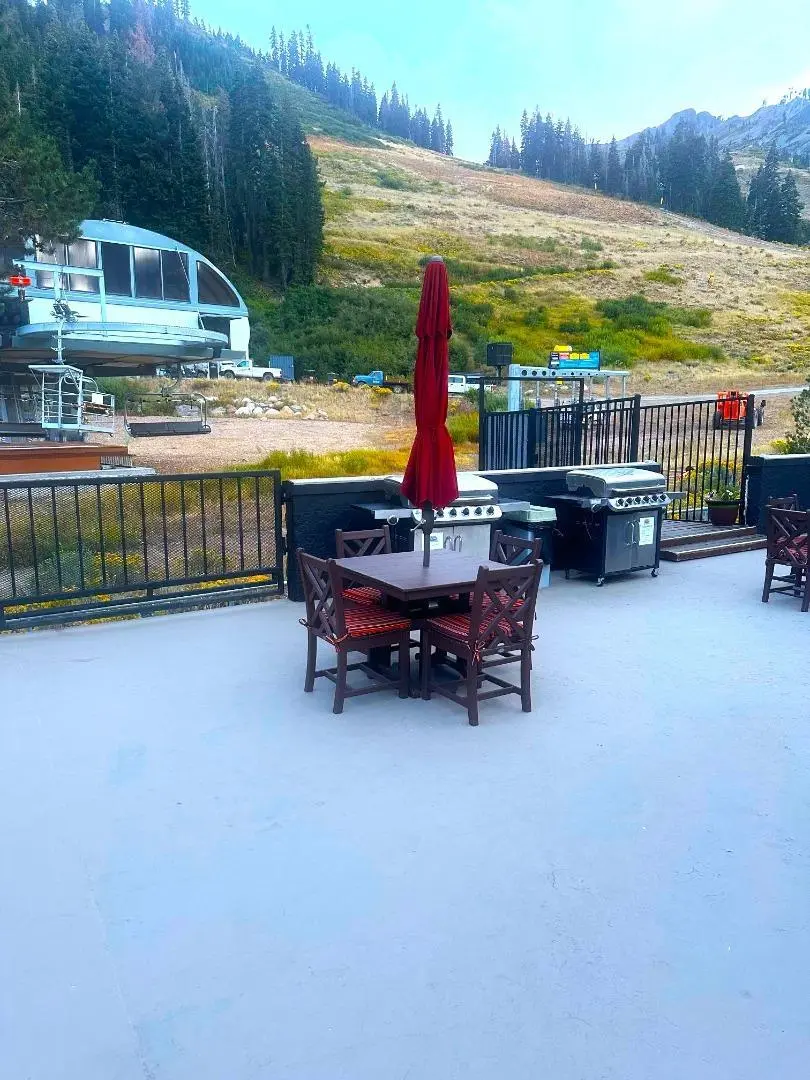
This is a beautiful time share condo in Olympic Valley near Lake Tahoe. Sellers' children are grown and they do not need the use of the place anymore. This is a great for family have children enjoy snow and nature. Please contact sellers for further information if you are interested and serious about having this 1 week time share for the odd year.
Key facts
- 5,000 sq ft lot
- 50 parking spots
- Built 1970
Neighborhood map
What this means for you Summary
Snapshot
- This is a 1-bed/1.0-bath condo listed at $6k.
Deal economics
- At list price, monthly cash flow is $-285 ($-3k/yr) — negative.
- The deal already cash-flows at list — no discount required.
- Meets the 1% rule at list price ($2k rent vs $6k).
- Recommended offer: $5k (12.0% below list) — sets the bar for market timing.
- Cap rate -50.8% vs local median 0.1% in Sunnyside-Tahoe City — below-typical yield; the buyer is paying a premium for something (appreciation thesis, condition, location) that the cap rate doesn't capture.
Location & tenants
- Location reads: area grade C — affects rentability + tenant quality, not the cash-flow math above.
- Tahoe-Truckee Unified (town): math 44% / reading 56% proficiency, ranked #136 of 517 in CA (top 26%) — acceptable for families but not a draw, mixed tenant base, ~2y average lease.
- Market conditions: 50 active listings in the ZIP; 1 comparable units currently listed for rent nearby; 3,535 units permitted in Placer County in 2024 (689 in 5+ unit buildings).
Forward outlook
- In year one you build about $234 of equity ($41 loan paydown + $193 appreciation (3.2% local appreciation)).
- Placer County population projected at +20% by 2050 — long-run rental-demand tailwind backs the buy-and-hold thesis.
Negotiation context
- It's been on market 358 days — a 12% lower offer ($5k) is reasonable based on typical stale-listing flexibility.
- 2 sale attempts since 6y ago with the ask held roughly flat each time — persistent listings suggest the price (not the market) is what's stuck; bring a comps-based counter.
Risks & watch-outs
- Watch-outs: HOA is 95% of rent.
- Climate carrying-cost: major wildfire risk — expect insurance premiums to compound above CPI over the hold.
Questions for the listing agent
- What do current leases actually rent for vs. the listed asking? Can we see a recent rent roll and the last 12 months of T-12 income?
- It's been on market 358 days. Have you received any prior offers? Is the seller open to a 12% concession, seller financing, or rate buy-down credit?
- Built in 1970 — when were the roof, HVAC, electrical panel, plumbing, and water heater last replaced?
- What does the HOA fee cover, when was the last increase, and are there any pending special assessments or reserve-fund shortfalls?
- Any open or pending special assessments — roof, HVAC, plumbing, elevator, façade? What's the per-unit balance and payoff schedule, and is the seller paying it off at close or rolling it to the buyer?
- Why hasn't it sold? Are there any deal-killer items the seller is aware of (foundation, flood, title, zoning, code violations)?
- Is there a deadline driving the sale (1031 exchange, divorce, estate, relocation)? That informs how much negotiation room exists.
- What's the average days-on-market for RENTAL listings here right now (not sales)? A rising rental-DOM trend means longer vacancies and softer asking-rent achievability than the comps imply.
- What's the recent tenant-quality profile in this submarket — average credit score on applications, eviction rate, late-payment / NSF rate, and stable-employment percentage? A property-management company in the area should have these aggregated.
- How much new apartment / multifamily construction is in the pipeline within 1–3 miles? Heavy new supply (>2% of stock underway) typically softens rents 12–24 months out; light construction supports rent growth.
Investment metrics
- 1% rule
- 25.00% ✓
- Cap rate
- -50.80%
- Cash-on-cash
- -203.90%
- DSCR
- -8.07
- GRM
- 0.3
CMA / ARV
No comps found within radius.
Projected returns pro-forma
3.22% appreciation · 3.0% rent growth · sell at horizon
- IRR
- —
- Equity multiple
- -8.81×
- Total profit
- $-16,488
- Equity at exit
- $2,772
- IRR
- -88.4%
- Equity multiple
- -18.09×
- Total profit
- $-32,064
- Equity at exit
- $4,330
Cash invested: $1,680 (down + closing). Projections, not guarantees.
Landlord ↔ Tenant lean methodology
- Overall (STATE)
- 18 Strongly Tenant-Friendly
- State California
- 18 Strongly Tenant-Friendly · D+13
- County
- — inherits STATE
- City
- — inherits STATE
ZIP-level market 96146
- Home prices YoY
- 1.5%
- Active inventory
- 50
- Price-to-rent
- 0.3×
Monthly cashflow live
- Estimated rent
- $1,500 medium interval (Pro) →
- Mortgage (P&I)
- −$31
- Tax est. 1.5%
- −$8 /mo · $90/yr
- Insurance
- −$2
- HOA est. from 8 same-building comps
- −$1,429
- Vacancy / Maint / Mgmt
- −$315
- Net cashflow
- $-285
Break-even live
UW: 25.0% down · 7.5% · 30yr · 1.5% tax · 5.0% vac · 8.0% maint · 8.0% mgmt
Financing live
Cash to close
- Down payment
- $1,500
- Closing costs
- $180
- Reserves months
- —
- Total cash needed
- —
Loan-product check · same deal, 3 products live
Conventional
25% down · 7.5% · 30yr
- Down + closing
- —
- Monthly P&I
- —
- Monthly cashflow
- —
- DSCR
- —
- Eligible?
- —
Personal DTI + credit; lowest rate.
DSCR
20% down · 8.5% · 30yr
- Down + closing
- —
- Monthly P&I
- —
- Monthly cashflow
- —
- DSCR
- —
- Eligible?
- —
No personal income docs; deal must DSCR.
Hard money
10% down · 12.0% · 12mo
- Down + closing
- —
- Monthly P&I
- —
- Monthly cashflow
- —
- DSCR
- —
- Eligible?
- —
Short-term bridge; refi at stabilization.
Rent comps 1 comps
| Address | Beds | Baths | Sqft | Rent | $/sqft | DOM | Units | Dist |
|---|---|---|---|---|---|---|---|---|
| 420 Squaw Creek Rd Unit 23 Olympic Valley, CA | 1.0 | 1.0 | 621 | $1,500 | $2.42 | 43d | 1 | 1.46mi |
HOA detail condo
- Monthly dues
- $0 · $0/yr
- Assessments
- None detected in remarks — confirm with the listing agent.
Listing history 20 events
-
2026-06-18days on market $6,000 Active 358 DOM
-
2026-06-17days on market $6,000 Active 357 DOM
-
2026-06-16days on market $6,000 Active 356 DOM
-
2026-06-15days on market $6,000 Active 355 DOM
-
2026-06-14days on market $6,000 Active 353 DOM
-
2026-06-10days on market $6,000 Active 350 DOM
-
2026-06-09days on market $6,000 Active 349 DOM
-
2026-06-08days on market $6,000 Active 348 DOM
-
2026-06-07days on market $6,000 Active 347 DOM
-
2026-06-05days on market $6,000 Active 344 DOM
-
2026-06-03days on market $6,000 Active 343 DOM
-
2026-06-02days on market $6,000 Active 342 DOM
-
2026-06-01days on market $6,000 Active 341 DOM
-
2026-05-31days on market $6,000 Active 340 DOM
-
2026-05-30days on market $6,000 Active 339 DOM
-
2025-06-25$6,000 Active 349-char remark
Show marketing remark (349 chars)
This is a beautiful time share condo in Olympic Valley near Lake Tahoe. Sellers' children are grown and they do not need the use of the place anymore. This is a great for family have children enjoy snow and nature. Please contact sellers for further information if you are interested and serious about having this 1 week time share for the odd year.
-
2020-02-04$3,595,000
-
2011-11-17soldstatus $8,020,000
-
2010-02-03soldstatus $1,963,500
-
2003-06-26soldstatus $770,000
ⓘ Source: listings_history table (triggers on properties + properties_extension) + one-shot
backfill from property_details.listing_events for pre-trigger history.
Climate risk First Street
- Flood 1/10 Low FEMA zone X (unshaded) · 0% chance over 30 yrs
- Wildfire 6/10 Major
- Heat 2/10 Low 14 d/yr ≥83°F today · 35 d/yr by 30 yrs out
- Wind 1/10 Low
- Air quality 7/10 Severe 10 unhealthy d/yr today · 17 by 30 yrs out
Nearby sold comps map
Loading sold comps map…
Walkable amenities ~0.75 mi
Loading nearby amenities…
Taxation est. · year 1
- Rental income
- $18,000
- − Mortgage interest
- −$336
- − Property taxes
- −$90
- − Insurance
- −$30
- − Repairs & maintenance
- −$1,440
- − Management
- −$1,440
- − HOA
- −$17,148
- − Depreciation
- −$175
- Taxable loss
- −$2,659
- Est. tax savings @ 24.0%
- +$638
- After-tax cash flow
- $-2,788/yr
For passive investors: Depreciation is non-cash, so a rental often shows a tax loss while cash-flowing — sheltering income. Rental losses are passive: they offset passive income freely, and up to $25,000/yr can offset ordinary (W-2) income if you actively participate and your MAGI is under $100k (phasing out to $0 by $150k); unused losses carry forward. On sale, claimed depreciation is recaptured at up to 25%, and gains may owe capital-gains tax (a 1031 exchange can defer both). Figures are a year-1 estimate at your 24.0% rate — not tax advice; consult a CPA.
Schools (NCES district)
- District
- Tahoe-Truckee Unified
- NCES district ID
- 0638770
- Math proficiency
- 44% ▼ -9.00%
- Reading proficiency
- 56% ▼ -4.00%
- Median HH income
- $67,136
- Composite
- 44.38/100
- National rank
- #2816
- State rank
- #136 of 517 in CA
Livability — Sunnyside-Tahoe City
No livability data for this city. (Only ~50 U.S. cities are tracked.)
Census & demographics
- Population (ZIP)
- 1,120
Population outlook (Placer County) Hauer SSP2
- Today (2025)
- 422,709 people
- By 2030
- 444,249 · +5.1%
- By 2040
- 480,192 · +13.6%
- By 2050
- 506,390 · +19.8%
- By 2075
- 550,219 · +30.2%
- By 2100
- 547,760 · +29.6%
Race, ethnicity, and origin ACS 2023
- Neighborhood character
- Predominantly White (87%)
- Race & ethnicity
- White 87% Hispanic / Latino 10% Two or more races 8%
- Hispanic origin (detail)
- Mexican 4% Puerto Rican 2%
- Common ancestry
- Lithuanian 8% Italian 5% Scandinavian 3%
- Foreign-born
- 7% · Canada
- Languages at home
- 89% English-only · French/Haitian/Cajun 4% Spanish 3% German/W. Germanic 2%
Political lean MEDSL · Placer
- 2024 margin
- Lean R (+8.5) · D 44.3% · R 52.8% · Other 2.9%
- 2008→2024 swing
- +2.8pp toward D · 2008: -11.3pp · 2024: -8.5pp
- All cycles
- 2024: R+8.5 2020: R+6.7 2016: R+11.3 2012: R+20.1 2008: R+11.3
Not yet ingested
- Civics
- —
Market trends
- HPI YoY
- ▲ 3.22%
- Current HPI
- 224.1632
- Rent YoY
- —
- Metro
- —
- State GDP YoY
- ▲ 3.21%
- F500 in state
- 116
Industry mix (Fortune 500 HQ in CA)
| Industry | F500 HQs | Revenue |
|---|---|---|
| Technology | 27 | $1,492B |
|
||
| Financial Services | 3 | $174B |
|
||
| Retail | 3 | $44B |
|
||
| Insurance | 3 | $26B |
|
||
| Media / Entertainment | 2 | $115B |
|
||
| Pharmaceuticals / Biotech | 2 | $62B |
|
||
Price history
-99.2% since first listed5 events — show timeline
- 2025-06-25 Listed $6,000 MLSListings
- 2020-02-04 Listed $3,595,000 IVRMLS
- 2011-11-17 Sold (Public Records) $8,020,000 Public Records
- 2010-02-03 Sold (Public Records) $1,963,500 Public Records
- 2003-06-26 Sold (Public Records) $770,000 Public Records
Property tax history
+8.7%/yrLatest (2025): $15,498 · +3.0% YoY. Source: county tax records.
Cash-flow waterfall
monthlySold comps — $/sqft
last 12 mo · ≤1 miLoading sold comps…