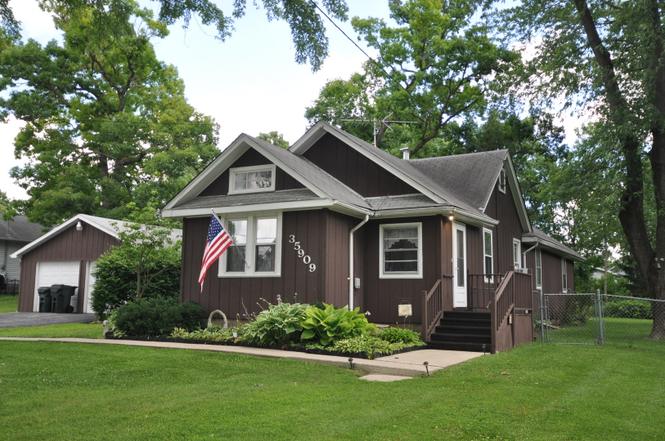
35909 N Helendale Rd · Long Lake, IL
Flood risk 4/10 · Minor
- FEMA flood zone
- X (unshaded)
- Chance of flooding over 30 yrs
- 0.2%
- Est. flood insurance / yr
- $507 – $1,088
Fire risk 2/10 · Minimal
- Est. fire insurance / yr
- $804 – $1,492
Heat risk 2/10 · Minimal
- Hot days now (above 100°F)
- 7 days/yr
- Hot days in 30 yrs
- 14 days/yr
Wind risk 2/10 · Minimal
- Chance of severe wind over 30 yrs
- —
Air-quality risk 3/10 · Minor
- Unhealthy air days now
- 2 days/yr
- Unhealthy air days in 30 yrs
- 3 days/yr
Risk factors via First Street. Map © Google.
Why this score? — see what drove the B grade
The composite is a weighted blend of 9 inputs, each scored 0–100. Each bar is that input's sub-score; the figure is the points it added to the 100-point composite (weight × sub-score).
- Cash flow +30.0/30.0
- ARV discount +11.3/15.0
- 1% rule +10.0/10.0
- DSCR +10.0/10.0
- Livability +3.4/5.0
- Rent growth +2.5/5.0
- Condition / age +2.5/5.0
- Schools +2.3/10.0
- Appreciation +0.0/10.0
$264,900
🖨 Deal sheet (PDF) 📄 Offer letter ✓ Due diligence
Listing remarks
Come and enjoy the tranquility and privacy of this ranch home located on a huge fenced in yard. Enter into the home through a enclosed foyer with French door leading into the front room that is light and airy. Galley kitchen with an oversized dining area for all you entertaining needs. 3 good size bedrooms, remodeled bath with newer walk in shower. home offers a separate mud room with mechanicals and laundry with access to private deck, garage, picnic table area and the spacious yard. The 2 car garage is 25 x 24 and has separate garage door openers. This home has been a great family home and is ready for a new family to enjoy.
Key facts
- Huge fenced in yard
- Galley kitchen
- Enclosed foyer
Tags
Property features AI
Finance
- Other: School bus service and commuter train access noted
- HOA & community: No master association fees required
Exterior
- Parking: Detached garage with garage door opener; Asphalt parking; Two garage spaces (two total parking spaces)
- Utilities: Well water; Public sewer
- Home design: Detached single-family ranch; One-story; Fee simple ownership; Approximately 1,276 total finished space
- Construction: Built 71–80 years ago; Frame construction; Asphalt roof; Block and concrete perimeter foundation; Built before 1978
- Exterior features: Deck; Patio; Fenced yard; Wooded lot
Interior
- Kitchen: Range; Microwave; Refrigerator; Kitchen on the main level (9 x 9)
- Bedrooms: Four bedrooms (all on the main level); Master bedroom on the main level (13 x 10); Bedroom 2 on the main level (12 x 10); Bedroom 3 on the main level (12 x 9); Bedroom 4 (no level listed)
- Bathrooms: One full bathroom
- Heating & cooling: Natural gas heating with baseboard units; Window air conditioning units
- Interior features: Six total rooms; Separate dining room; Crawl space basement
- Laundry & utility: Main-level laundry room (12 x 7)
Neighborhood map
What this means for you Summary
Snapshot
- This is a 3-bed/1.0-bath single-family listed at $265k.
Deal economics
- At list price, monthly cash flow is $3k ($30k/yr) — positive.
- The deal already cash-flows at list — no discount required.
- Meets the 1% rule at list price ($6k rent vs $265k).
Location & tenants
- Location reads 67/100 on livability (#527 in IL) — a middle-class / working-renter tenant base. Strengths: employment A+, cost of living A+, housing A+; Watch: amenities F, commute F, health & safety F.
- Grant Chsd 124 (suburban): math 23% / reading 27% proficiency, ranked #296 of 620 in IL (top 48%) — low school quality limits family demand, transient renter base, plan for 1-2y turnover.
- Zoned schools: Grant Community High School (math 23% / reading 27%, grade F, #247 of 693 statewide, top 36%, 1,837 students, 0% FRL).
- Market conditions: 35 active listings in the ZIP; 2 comparable units currently listed for rent nearby; 948 units permitted in Lake County in 2024 (424 in 5+ unit buildings).
Forward outlook
- Local home prices are declining (-3.0%/yr); year-one equity from $2k of loan paydown is wiped out by about $8k of value loss. Plan a longer hold.
- Lake County population projected to shrink 8% by 2050 — rents likely to lag national; underwrite the cash flow, not the appreciation.
- At projected returns (-3.0% appreciation + 3.0% rent growth), your $74k cash investment doubles in ~3 years — after that, you're playing with house money.
Negotiation context
- Only 4 days on market — expect competitive offers; lowballing is unlikely to land.
Risks & watch-outs
- Watch-outs: built in 1951 — expect roof / HVAC / electrical / plumbing capex.
Questions for the listing agent
- Built in 1951 — when were the roof, HVAC, electrical panel, plumbing, and water heater last replaced?
- Is there a deadline driving the sale (1031 exchange, divorce, estate, relocation)? That informs how much negotiation room exists.
- Schools are D-rated, which usually means shorter tenancies and higher turnover. Who's the typical renter profile here, and what's been the actual vacancy rate?
- What's the average days-on-market for RENTAL listings here right now (not sales)? A rising rental-DOM trend means longer vacancies and softer asking-rent achievability than the comps imply.
- What's the recent tenant-quality profile in this submarket — average credit score on applications, eviction rate, late-payment / NSF rate, and stable-employment percentage? A property-management company in the area should have these aggregated.
- How much new for-sale + rental construction is in the pipeline within 1–3 miles? Heavy new supply typically softens prices + rents 12–24 months out; constrained supply supports both.
Investment metrics
- 1% rule
- 2.08% ✓
- Cap rate
- 17.73%
- Cash-on-cash
- 40.85%
- DSCR
- 2.82
- GRM
- 4.0
CMA / ARV
- ARV (on-the-fly)
- $289,652
- Comps found
- 12
Show comp detail 12 sales within ~0.75 mi
| Address | Dist | Beds/Ba | Sqft | Sold | Price | $/sf | Match |
|---|---|---|---|---|---|---|---|
| 35737 N Hunt Ave | 0.19mi | 3/1.5 | 1,300 (+2%) | 1mo | $350,000 | $269 | 86 |
| 35694 N Helendale Rd | 0.22mi | 3/1.0 | 1,275 (-0%) | 10mo | $179,900 | $141 | 81 |
| 35850 N Benjamin Ave | 0.29mi | 3/2.5 | 1,260 (-1%) | 12mo | $297,500 | $236 | 68 |
| 35790 N Wilson Rd | 0.24mi | 3/1.0 | 1,188 (-7%) | 12mo | $280,000 | $236 | 67 |
| 35694 N Laurel Ave | 0.41mi | 3/2.0 | 1,415 (+11%) | 0mo | $261,000 | $184 | 58 |
| 35663 N Helendale Rd | 0.25mi | 4/1.5 (+1) | 1,416 (+11%) | 6mo | $300,000 | $212 | 58 |
| 35706 N Benjamin Ave | 0.35mi | 3/2.0 | 1,100 (-14%) | 1mo | $250,000 | $227 | 56 |
| 26177 W Lakeview Ave | 0.53mi | 2/1.0 (-1) | 1,182 (-7%) | 3mo | $199,000 | $168 | 56 |
| 35729 N Watson Ave | 0.24mi | 3/2.0 | 1,092 (-14%) | 7mo | $230,000 | $211 | 55 |
| 404 Monroe Ave | 0.48mi | 3/2.0 | 1,368 (+7%) | 12mo | $290,000 | $212 | 51 |
| 502 Monroe Ave | 0.47mi | 3/2.0 | 1,160 (-9%) | 14mo | $270,000 | $233 | 48 |
| 314 Mastodon Dr | 0.51mi | 2/1.0 (-1) | 1,092 (-14%) | 4mo | $287,500 | $263 | 44 |
Match score weights: distance 35% · size 25% · config 20% · recency 20%. Top-matched comps best support the ARV.
Projected returns pro-forma
-3.0% appreciation · 3.0% rent growth · sell at horizon
- IRR
- 37.4%
- Equity multiple
- 2.59×
- Total profit
- $117,970
- Equity at exit
- $39,497
- IRR
- 43.9%
- Equity multiple
- 5.18×
- Total profit
- $310,136
- Equity at exit
- $22,904
Cash invested: $74,172 (down + closing). Projections, not guarantees.
Landlord ↔ Tenant lean methodology
- Overall (STATE)
- 43 Moderately Tenant-Leaning
- State Illinois
- 43 Moderately Tenant-Leaning · D+7
- County
- — inherits STATE
- City
- — inherits STATE
ZIP-level market 60041
- Home prices YoY
- -25.0%
- Active inventory
- 35
- Price-to-rent
- 4.0×
Monthly cashflow live
- Estimated rent
- $5,513 medium interval (Pro) →
- Mortgage (P&I)
- −$1,389
- Tax est. 1.5%
- −$331 /mo · $3,974/yr
- Insurance
- −$110
- HOA
- −$0
- Vacancy / Maint / Mgmt
- −$1,158
- Net cashflow
- $2,525
Break-even live
Sensitivity live
| Price | -10% $2,708 | -5% $2,616 | +0% $2,525 | +5% $2,433 | +10% $2,342 |
|---|---|---|---|---|---|
| Rent | -10% $2,089 | -5% $2,307 | +0% $2,525 | +5% $2,743 | +10% $2,960 |
| Rate | -1.0pp $2,658 | -0.5pp $2,592 | base $2,525 | +0.5pp $2,456 | +1.0pp $2,386 |
UW: 25.0% down · 7.5% · 30yr · 1.5% tax · 5.0% vac · 8.0% maint · 8.0% mgmt
Financing live
Cash to close
- Down payment
- $66,225
- Closing costs
- $7,947
- Reserves months
- —
- Total cash needed
- —
Loan-product check · same deal, 3 products live
Conventional
25% down · 7.5% · 30yr
- Down + closing
- —
- Monthly P&I
- —
- Monthly cashflow
- —
- DSCR
- —
- Eligible?
- —
Personal DTI + credit; lowest rate.
DSCR
20% down · 8.5% · 30yr
- Down + closing
- —
- Monthly P&I
- —
- Monthly cashflow
- —
- DSCR
- —
- Eligible?
- —
No personal income docs; deal must DSCR.
Hard money
10% down · 12.0% · 12mo
- Down + closing
- —
- Monthly P&I
- —
- Monthly cashflow
- —
- DSCR
- —
- Eligible?
- —
Short-term bridge; refi at stabilization.
Rent comps 2 comps
| Address | Beds | Baths | Sqft | Rent | $/sqft | DOM | Units | Dist |
|---|---|---|---|---|---|---|---|---|
| 184 E Grand Ave Unit 1374785P Fox Lake, IL | 4.0 | 3.0 | 1593 | $7,875 | $4.94 | 7d | 1 | 1.37mi |
| 601 Blue Springs Dr Unit 289 Fox Lake, IL | 3.0 | 2.5 | 1837 | $2,750 | $1.50 | 25d | 1 | 1.39mi |
Listing history 3 events
-
2026-06-21days on market $264,900 Active 4 DOM
-
2026-06-17remarks 634-char remark
-
2026-06-17$264,900 Active 1 DOM
ⓘ Source: listings_history table (triggers on properties + properties_extension) + one-shot
backfill from property_details.listing_events for pre-trigger history.
Climate risk First Street
- Flood 4/10 Moderate FEMA zone X (unshaded) · 20% chance over 30 yrs
- Wildfire 2/10 Low
- Heat 2/10 Low 7 d/yr ≥100°F today · 14 d/yr by 30 yrs out
- Wind 2/10 Low
- Air quality 3/10 Moderate 2 unhealthy d/yr today · 3 by 30 yrs out
Nearby sold comps map
Loading sold comps map…
Walkable amenities ~0.75 mi
Loading nearby amenities…
Taxation est. · year 1
- Rental income
- $66,160
- − Mortgage interest
- −$14,839
- − Property taxes
- −$3,974
- − Insurance
- −$1,324
- − Repairs & maintenance
- −$5,293
- − Management
- −$5,293
- − Depreciation
- −$7,706
- Taxable income
- $27,732
- Est. tax owed @ 24.0%
- −$6,656
- After-tax cash flow
- $23,643/yr
For passive investors: Depreciation is non-cash, so a rental often shows a tax loss while cash-flowing — sheltering income. Rental losses are passive: they offset passive income freely, and up to $25,000/yr can offset ordinary (W-2) income if you actively participate and your MAGI is under $100k (phasing out to $0 by $150k); unused losses carry forward. On sale, claimed depreciation is recaptured at up to 25%, and gains may owe capital-gains tax (a 1031 exchange can defer both). Figures are a year-1 estimate at your 24.0% rate — not tax advice; consult a CPA.
Schools (NCES district)
- District
- Grant Chsd 124
- NCES district ID
- 1717340
- Math proficiency
- 23% ▼ -9.00%
- Reading proficiency
- 27% ▼ -7.00%
- Median HH income
- $59,450
- Composite
- 22.95/100
- National rank
- #7989
- State rank
- #296 of 620 in IL
Livability — Long Lake
- Score
- 67/100
- State rank
- #527
- US rank
- #10914
Category grades
Schools grade is shown separately in the Schools card above.
Census & demographics
- Population (ZIP)
- 8,920
Population outlook (Lake County) Hauer SSP2
- Today (2025)
- 700,217 people
- By 2030
- 693,290 · -1.0%
- By 2040
- 673,588 · -3.8%
- By 2050
- 643,556 · -8.1%
- By 2075
- 562,792 · -19.6%
- By 2100
- 457,715 · -34.6%
Race, ethnicity, and origin ACS 2023
- Neighborhood character
- Predominantly White (65%)
- Race & ethnicity
- White 65% Hispanic / Latino 23% Two or more races 15% Black 4% Asian 2%
- Hispanic origin (detail)
- Mexican 15% Puerto Rican 2% Cuban 2%
- Common ancestry
- Romanian 12% Lithuanian 3% Iranian 2%
- Foreign-born
- 8% · Canada
- Languages at home
- 83% English-only · Spanish 15% Russian/Polish/Slavic 1% French/Haitian/Cajun 1%
Political lean MEDSL · Lake
- 2024 margin
- Strong D (+20.8) · D 59.7% · R 38.9% · Other 1.4%
- 2008→2024 swing
- +1.1pp toward D · 2008: 19.6pp · 2024: 20.8pp
- All cycles
- 2024: D+20.8 2020: D+24.1 2016: D+20.3 2012: D+8.1 2008: D+19.6
Not yet ingested
- Civics
- —
Market trends
- HPI YoY
- ▼ -76.75%
- Current HPI
- 230.4464
- Rent YoY
- —
- Metro
- —
- State GDP YoY
- ▲ 1.59%
- F500 in state
- 60
Industry mix (Fortune 500 HQ in IL)
| Industry | F500 HQs | Revenue |
|---|---|---|
| Insurance | 4 | $201B |
|
||
| Consumer Goods | 4 | $87B |
|
||
| Industrial Machinery | 3 | $64B |
|
||
| Healthcare | 2 | $55B |
|
||
| Retail / Pharmacy | 1 | $148B |
|
||
| Agriculture / Food | 1 | $86B |
|
||
Price history
1 event — show timeline
- 2026-06-15 Listed $264,900 MRED as Distributed by MLS Grid
Property tax history
-6.8%/yrLatest (2024): $503 · -28.3% YoY. Source: county tax records.
Cash-flow waterfall
monthlySold comps — $/sqft
last 12 mo · ≤1 miLoading sold comps…